


Servicios Personalizados
Articulo
 Inglés (pdf)
 Articulo en XML
 Referencias del artículo
Indicadores

Links relacionados
-
 Citado por Google
 -
 Similares en Google
Compartir

 Permalink
South African Journal of Industrial Engineering
versión On-line ISSN 2224-7890
versión impresa ISSN 1012-277X
S. Afr. J. Ind. Eng. vol.33 no.4 Pretoria dic. 2022
http://dx.doi.org/10.7166/33-4-2549
GENERAL ARTICLES
An multi-criteria decision-making based course assessment framework: development and application
H.M. Aburas*; I.A. Batarfi; A.F. Bahshwan; R.A. Alzahrani; A.M. Qarout
Department of Industrial Engineering, Faculty of Engineering, King Abdulaziz University, Saudi Arabia
ABSTRACT
Evaluation of the educational process is essential to its development and improvement. This paper aims to create a model for evaluating students' satisfaction with industrial engineering courses using Multi-Criteria Decision-Making (MCDM) tools. The research began with a course evaluation data survey with 28 questions (variables). Then the assessment model was proposed, based on the previously collected data. The suggested assessment model identified the constructs using exploratory factor analysis (EFA). Then the extracted variables and the resulting constructs were prioritised using the analytic hierarchy process (AHP). Next, a structured local questionnaire was drawn up and distributed to industrial engineering students at a Saudi university to validate the developed model. After that, the suggested framework was applied to the data to assess the students' overall satisfaction with the course. Finally, it was found that the Operations Research Track, of the five current tracks, scored the highest satisfaction rate. This study's results could be helpful in knowing the importance of MCDM in the evaluation process, as it distinguishes the value of students' evaluations for the development and growth of the evaluation of educational courses.
OPSOMMING
Evaluering van die opvoedkundige proses is noodsaaklik vir die ontwikkeling en verbetering daarvan. Hierdie artikel het ten doel om 'n model te skep vir die evaluering van studente se tevredenheid met bedryfsingenieurswese kursusse deur gebruik te maak van Multi-Kriteria Besluitneming (MCB) instrumente. Die navorsing begin met 'n kursusevaluering data opname met 28 vrae (veranderlikes). Daarna is 'n assesseringsmodel voorgestel gebaseer op data wat voorheen ingesamel was. Die voorgestelde assesseringsmodel het die konstrukte geïdentifiseer deur gebruik te maak van verkennende faktoranalise. Daarna is die onttrekte veranderlikes en die gevolglike konstrukte geprioritiseer deur gebruik te maak van die analitiese hiërargieproses. 'n Soortgelyke gestruktureerde plaaslike vraelys was daarna opgestel en versprei aan bedryfsingenieurswese studente by 'n universiteit in Saoedi-Arabië om die ontwikkelde model te valideer. Daarna is die voorgestelde raamwerk op die verkrygde data toegepas om die studente se algehele kursus tevredenheid te assesseer. Die resultate toon dat die Operasionele Navorsingsbaan die hoogste tevredenheidskoers behaal het van die vyf huidige bane. Die resultate van hierdie studie kan nuttig wees om die belangrikheid van MCB in die evalueringsproses uit te ken aangesien dit die waarde van studente se evaluerings vir die ontwikkeling en groei van die opvoedkundige kursus-evaluering van opvoedkundige kursusse onderskei.
1. INTRODUCTION
The process of continuous improvement is essential to maintain a competitive position in every industry or sector. Evaluation is one of the basic parts of such a process, and should be performed periodically to enable development. Furthermore, listening to the targeted audience of any organisation, the voice of the customer (VOC) is also crucial, as it allows the organisation to identify and prioritise the low-hanging fruit and to maintain its potential leading edge; and this applies to all aspects of life. Overall, course satisfaction is essential in the educational industry to attract stakeholders and to compete efficiently and effectively. Therefore, management should continually seek to measure and evaluate overall performance. Such evaluation ensures an objective-based assessment approach to the educational process.
Course evaluation by students is not appreciated owing to a preconceived notion among students, instructors, and other stakeholders. This conflict can seriously hinder course evaluation, in that the vital element - students' satisfaction -is not generally evaluated or chosen to be part of a final evaluation [2]. Yet the importance of course evaluation is not gainsaid by any stakeholder. Course evaluation is considered to be a development-focused approach to check the validity of certain courses for a specific level. This is why it is regarded as a constructive way to measure learning outcomes for each specified group. For this purpose, multiple evaluation policies have been framed and structured to validate the effectiveness of study courses [3].
Previous studies have touted the importance of a student-centred approach, as it can lead to a focus on complex learning. Instructors often implement new techniques to ensure students' satisfaction, as it is that satisfaction that ensures the usefulness and importance of the teaching-and-learning process [4-5]. They have also used various tools to judge the effectiveness of newly adopted ways and techniques. All important decisions are based on the students' satisfaction index, whether it is to check the utility of the teaching-and-learning process or to judge the value of the courses being taught [6]. Researchers have used a range of instruments for this, such as multiple attribute decision-making (MADM), multiple objective decision-making (MODM), and preference ranking organisation methods for enrichment evaluation (PrOMETHEE) [7]. These techniques help to evaluate the thresholds of preferences and of indifference.
Multiple studies have been conducted to elucidate the importance of evaluation in any system, and how strength and growth are connected to evaluating policies [8]. Cloud computing is also one of the popular techniques that are widely applied in evaluation; but research has identified a few major problems with the results of cloud computing. A rapid increase in the use of cloud computing has also been noticed, but it has produced different classifications of different results. This results in unauthentic and inaccurate results. PROMETHEE is another widely applied evaluation technique to evaluate the performance of pairs and groups [9]. It could been considered a multi-criteria technique in which groups were observed when working on any complex problem with accurate data.
Decision-making plays a vital role in daily life [10]. Decisions depend on the weights given to sets of criteria. It thus plays an important part in engineering education.
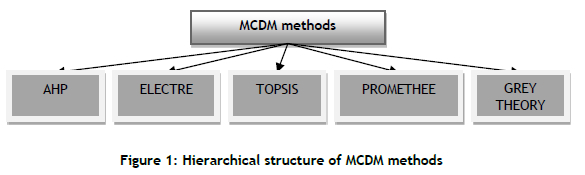
Figure 1 outlines a number of MCDM methods. AHP was applied in the current research to validate students' responses. The main objective of this paper was to create a course satisfaction assessment framework that would help the management to evaluate and improve its educational programmes. To develop a scientifically-based assessment framework, two particular tools were used in this research: exploratory factor analysis (EFA) and the analytic hierarchy process (AHP). These techniques were combined to give weight to students' evaluations and to obtain measured results to improve learning outcomes.
2. METHODOLOGY
This research aimed to build a scientifically-based course assessment framework. In other words, the goal was to propose an assessment framework that allows industrial engineering courses to be evaluated for overall satisfaction. Such a scientific approach would help a department to identify opportunities for improvement and to maintain a leading position among its competitors. This section ends by briefly discussing the course assessment framework's methodology.
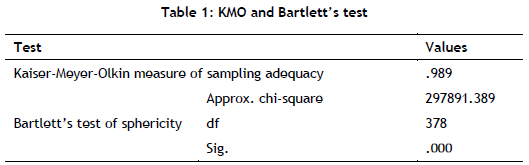
It began by taking universally available survey data consisting of 28 questions and representing more than 5000 students' responses. Then, to identify the latent factors and the variables that represent these factors, an exploratory factor analysis (EFA) was conducted. Before the researchers applied the EFA methodology, its assumptions were tested and found to have been satisfied, based on its SPSS software outcomes. The first assumption was the adequacy of the sample size, which was checked using the Kaiser-Meyer-Olkin (KMO) test. Table 1 shows a KMO of 0.989 (more than the acceptance level of 0.7) [11]; therefore, the sample was adequate to conduct the EFA. In other words, the EFA was appropriate for the research data [12]. The sphericity assumption was tested using Bartlett's test; the result was significant, which meant that at least two variables were correlated. Thus, the EFA's assumptions were satisfied. Finally, the analytic hierarchy process (AHP) was applied to prioritise the variables and constructs. Generally, the validity of the sampling size and the questionnaire is not considered to be a critical issue; but for the current results, the population, the questionnaire, and accuracy mattered a lot for the final evaluation. Similarly, the strengths and weaknesses of the evaluation were based on the accuracy of each construct, tool, and technique being applied.
3. RESULTS AND FINDINGS
3.1. Exploratory factor analysis
Exploratory factor analysis (EFA) is a dimensionality reduction technique that belongs to multivariate statistical methods to identify the smallest number of the hypothetical constructs - known as latent factors, dimensions, or internal attributes - that can explain the observed covariation among a set of measured variables. In other words, it defines specific factors that explain the order and structure between the measured variables. In the social and behavioural sciences, factors are assumed to be unobservable features of people, demonstrating the variations in the scores obtained on the measured variables. Factor analysis provides methods to evaluate the nature of the interrelationships (correlations) between many variables (such as survey responses or scores) by identifying a set of strongly intercorrelated variables, known as factors. EFA was applied in this study to define the constructs on which this research work would rely [1315]). Table 2 shows the two latent factors that were extracted, based on their eigenvalue (i.e., more than 1). Furthermore, parallel analysis - another technique used to select the number of factors [16] - was applied, and confirmed our decision to extract only two latent factors or constructs.
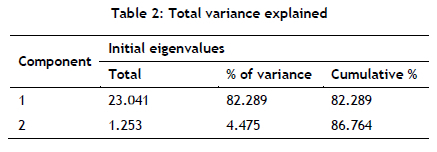
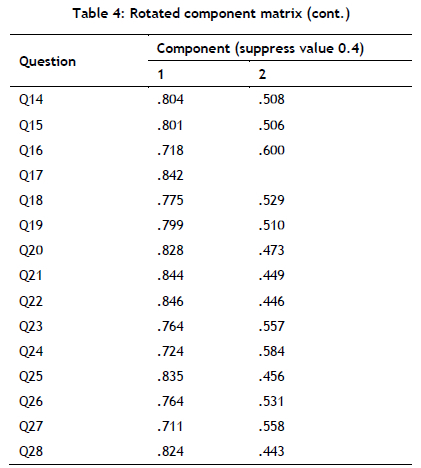
Table 3 below shows the latent factors and the variables within them. Researchers have found that variables from 1 to 12 belong to the second latent factor, while the remaining variables belong to the first latent factor. Thus, depending on the nature of these sets of questions, a brainstorming session was conducted to label both constructs. The first latent factor was called 'the instructor factor', and the second was called 'the course factor'. A reliability analysis was also conducted, and Cronbach's alpha was found to be more than 0.7 [17] for both constructs. Therefore, the two latent factors and their corresponding variables represented the hypothetical model or structure of the research study.
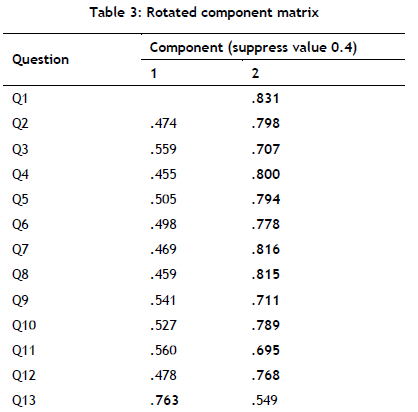
It should be noted that the missing values for Q1 and Q17 in Table 3 were suppressed, using an option from SPSS software that allows the suppression of values below a specific limit. In this research, the absolute value of 0.4 was used. There is no specific rule to work with; there are many theories about the limit of the absolute value below which the values are suppressed in the extraction process. For example, [18] used 0.32; in another example, [19] used 0.4.
3.2. Analytic hierarchy process (AHP)
The analytic hierarchy process (AHP) is a multi-criteria decision-making tool developed by Saaty [20] and used in several applications to handle multi-attribute decision-making problems in real situations. It is a robust technique for defining the problems in detail, and also for solving technical, managerial, and unstructured problems that might have interactions and correlations among different objectives and goals. The AHP helps decision-makers to organise the critical aspects of a problem into a hierarchical structure similar to a family tree; it connects all the levels of the hierarchy, which helps to clarify how changing one criterion might affect other alternatives and criteria; and it starts with pairwise comparison matrices and is based on experts' judgements [21 -23].
After the two latent factors had been identified and labelled, the AHP was applied within and between both constructs, following three steps. The first step was to build the pairwise comparison matrices using Saaty's scales of relative importance [24]. The scales are proper when the individual preferences are expressed on verbal scales, which is the benefit of using scales of relative importance to convert them into meaningful numerical values. This paper used the scale as an initial step to determine the relative importance of different criteria.
In order to build the pairwise comparison matrices, the researchers conducted a brainstorming session. The second step was to normalise the pairwise comparison matrix to obtain the criteria weights (CW) by dividing each cell in the pairwise comparison matrix by the sum of its column. Then the CWs were calculated by finding the average of each row in the normalised pairwise comparison matrix. The third step was to calculate the consistency ratio (CR). Several calculations were performed using the original non-normalised pairwise comparison matrix. This process began by multiplying each cell in each question by its corresponding CW, then calculating the weighted sum value (WSV) by finding the sum of each row in the matrix. Then each ratio (R) was calculated by dividing each row's WSV by its associated CW. After that, the lambda max (Amax) was calculated by finding the average of all the ratios, and the consistency index (CI) was calculated using the following formula:
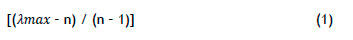
where n is the number of compared elements in the matrix. Finally, the CR was calculated by dividing the CI by the random index (RI) that is suggested for more than fifteen variables [25]. Fortunately, the calculated CRs were less than 10% [26], [27], which meant that the CWs obtained from the normalised pairwise comparison matrices were reliable.
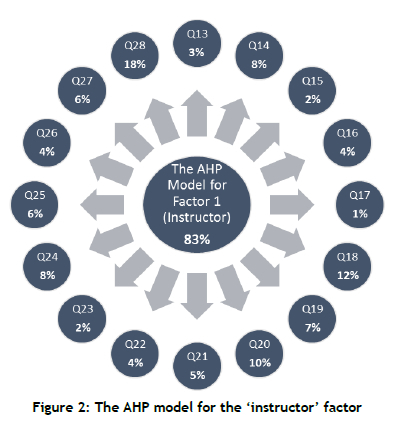
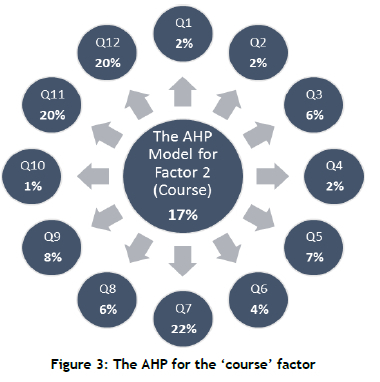
The fuzzy analytic hierarchy process (FAHP), which is similar to AHP, but has been improved by fuzzy logic theory and uses the fuzzy triangle scale [28], was also applied to confirm the results of the AHP and to see whether any different criteria weights might appear. The results were almost the same, and so the researchers decided to continue their work and use the AHP models. Figures 2 and 3 illustrate the prioritisations of both latent factor variables.
Although the techniques applied in this research were very limited, it was based on the authenticity of the data, the questionnaire, the design of the questions, the population, the sample size, and each chosen variable. This research produced limited but accurate results with the quality of the data. This is the reason that the accuracy of the results depends on the accuracy of the data-driven tools and the population.
Once the suggested framework that measured students' satisfaction with courses was ready, a locally based survey, similar to the original one with the addition of an overall course satisfaction question, was designed and distributed, using Google Forms, to the industrial engineering department students at King Abdulaziz University (KAU-IE), from whom 107 responses were collected. After that, the researchers calculated the predicted satisfaction for each industrial engineering track and its courses before comparing them with the ones they had observed, based on the overall course satisfaction feedback.
The collected responses to the 28 main questions were then multiplied by their corresponding weights; and, since the 28 main questions were categorised into two latent factors, the sum of each construct's resulted weight was multiplied by its overall priority. An illustrative example is given below:
{((5*0.02) + (5*0.02) + (5*0.06) + (4*0.02) + (3*0.07) + (4*0.04) + (3*0.22) + (5*0.06) + (5*0.08) + (5*0.01) + (4*0.2) + (5*0.2)) * (0.17)} + {((5*0.03) + (3*0.08) + (3*0.02) + (4*0.04) + (5*0.01) + (5*0.12) + (4*0.07) + (4*0.1) + (5*0.05) + (4*0.04) + (4*0.02) + (4*0.08) + (4*0.06) + (4*0.04) + (4*0.06) + (5*0.18)) * (0.83)} = 4
Next, the observed and predicted satisfaction scores were calculated for each course and track; as a statistic, the median was selected owing to its insensitivity to extreme value. In order to calculate the prediction accuracy, the matching responses were counted and then divided by the number of the responses. An illustrative example, from the operations research track, is given here:
Number of all responses in track = 33
Number of matching responses (the observed satisfaction matched the predicted satisfaction) = 19
Accuracy = (19 / 33) * 100 = 58%%
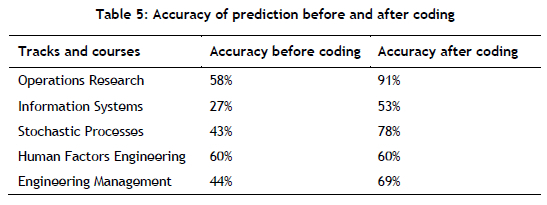
In this research, a five-point Likert scale survey was used. Given the relatively small sample size, and to enhance the accuracy of the results, the responses were coded. In other words, to minimise the gap between the observed and the predicted satisfaction, the observed satisfaction was converted into coded satisfaction, such that responses 1 and 2 were coded as 1; response 3 was coded as 2; and responses 4 and 5 were coded as 3.
Table 4 shows the accuracy of the prediction before and after coding the results. The prediction accuracy improved significantly, except for one track, owing to its limited number of responses. Furthermore, the proposed assessment framework showed a better and more reliable performance with the coded responses.
Various techniques can used to check the validity and authenticity of decision-making. In the current research it was evaluated with the help of the MCDM tool. Different techniques were combined to obtain an accurate result and to check the importance of decision-making in evaluating students' satisfaction index. The importance of students' satisfaction could be seen in the results: it was similar to the success or failure choice. Similarly, Fisher and Miller [29] highlighted the importance of students in achieving the best outcomes in the teaching-and-learning process. If students were evaluated as important stakeholders, this could help to shape the future plans of the higher-education institutions. There are many engineering programmes that exist in the same socio-cultural context; this study could be relevant in giving them an outlet. Although the findings of the current research were specific and limited, they could still be used to develop or improve the specifications of any engineering or technical educational programme.
4. CONCLUSION
This research began with an international student questionnaire with 28 questions that produced more than 5000 responses. The exploratory factor analysis (EFA) technique was applied to identify the latent factors and to aggregate the different variables under each construct. The eigenvalues and a parallel analysis were considered to identify the number of extracted latent factors. Two latent factors were identified: the first was called 'the Instructor factor', with 16 variables associated with it, and the second was called 'the course factor', with 12 variables. The analytic hierarchy process (AHP) was then applied to prioritise constructs and their associated variables. The fuzzy analytic hierarchy process (FAHP) was also applied, and the results were almost the same. Thus, a course assessment framework was proposed based on the resulting constructs and the calculated priorities of their associated variables.
A questionnaire on industrial engineering students' satisfaction with the course was distributed to validate our suggested assessment framework. The locally distributed questionnaire contained the same 28 questions; however, the overall course satisfaction questions and a few other general questions were added. After that, the model calculated or predicted satisfaction compared with the observed satisfaction of all of the participants, by track level and course level. The overall accuracy of the assessment framework was very satisfactory. It was also found that the Operations Research track had the highest satisfaction rate of the five KAU-IE tracks. The students' involvement in evaluating the five tracks ensured the sustainability of those course codes. MCDM was applied to obtain the calculated and measured results for a strategy that would be sustainable in the future. The MCDM technique was helpful in the current research in obtaining rational results, and so could improve the quality of the courses and of education in general.
The researchers recommend that, in future work, a locally based assessment model be constructed, based on local data only, before comparing it with the internationally based assessment model proposed in this paper. Furthermore, it is recommended that other multi-criteria decision-making (MCDM) methods and tools be applied, such as the technique for order preferences by similarity to ideal solutions (TOPSIS), simple additive weighting (SAW), and ELECTRE [30]. Finally, a fully automated system based on the proposed assessment framework might help to expedite the evaluation process
REFERENCES
[1] Gunduz, G., & Fokoue, E. (2013). UCI machine learning repository [Web link]. Irvine, CA: University of California, School of Information and Computer Science. [ Links ]
[2] Edström, K. (2008). Doing course evaluation as if learning matters most. Higher Education Research & Development, 27(2), 95-106. [ Links ]
[3] Kember, D., & Leung, D.Y. (2008). Establishing the validity and reliability of course evaluation questionnaires. Assessment & Evaluation in Higher Education, 33(4), 341-353. [ Links ]
[4] Rizwan, A., AM, M.S., & Hammouda, M.M. (2008). Analysis of factors affecting the satisfaction levels of engineering students. International Journal of Engineering Education, 24(4), 811 -816. [ Links ]
[5] Hooda, M., Rana, C., Dahiya, O., Rizwan, A., & Hossain, M.S. (2022). Artificial intelligence for assessment and feedback to enhance student success in higher education. Mathematical Problems in Engineering, 2022(1), 1-19. https://doi.org/10.1155/2022/5215722. [ Links ]
[6] Rizwn, A., Farooq, S., AM, M.S.I., & Nawaz, S. (2012). Analysis of factors affecting the stress level of female engineering students. The Global Journal of Human Social Science Arts & Humanities, 12(1), pp. 1-9. [ Links ]
[7] Hashemkhani Zolfani, S., Maknoon, R., & Zavadskas, E.K. (2016). Multiple attribute decision making (MADM) based scenarios. International Journal of Strategic Property Management, 20(1 ), pp. 101-111. [ Links ]
[8] Kumar, A., Sah, B., Singh, A.R., Deng, Y., He, X., Kumar, P., & Bansal, R.C. (2017). A review of multi criteria decision making (MCDM) towards sustainable renewable energy development. Renewable and Sustainable Energy Reviews, 69, pp. 596-609. [ Links ]
[9] Macharis, C., Springael, J., De Brucker, K., & Verbeke, A. (2004). PROMETHEE and AHP: The design of operational synergies in multicriteria analysis: Strengthening PROMETHEE with ideas of AHP. European Journal of Operational Research, 153(2), 307-317. [ Links ]
[10] Rao, R.V. (2007). Decision making in the manufacturing environment: Using graph theory and fuzzy multiple attribute decision making methods (Vol. 2). London: Springer. [ Links ]
[11] Glen, S. (2022). Kaiser-Meyer-Olkin (KMO) test for sampling adequacy. Statistics how to: Statistics for the rest of us. Retrieved from https://www.statisticshowto.com/kaiser-meyer-olkin [Accessed 4 April 2020]. [ Links ]
[12] IBM Corporation. (2022). KMO and Bartlett's test. Retrieved from https://www.ibm.com/docs/en/spss-statistics/28.0.0?topic=detection-kmo-bartletts-test [Accessed 17 April 2020]. [ Links ]
[13] Hair, J.F., Black, W.C., Babin, B.J., & Anderson, R.E. (2013). Multivariate data analysis. Prentice-Hall, Saddle River: Pearson. [ Links ]
[14] Henson, R., & Roberts, J. (2006). Use of exploratory factor analysis in published research. Educational and Psychological Measurement, 66(3), 393-416. [ Links ]
[15] Statistics Solutions. (2022). Exploratory factor analysis. Retrieved from https://www.statisticssolutions.com/free-resources/directory-of-statistical-analyses/exploratory-factor-analysis/ [Accessed 24 March 2020]. [ Links ]
[16] Lim, S., & Jahng, S. (2019). Determining the number of factors using parallel analysis and its recent variants. Psychological Methods, 24(4), 452-467. https://doi.org/10.1037/met0000230 [ Links ]
[17] Statistics Solutions. (2022). Cronbach's alpha. Retrieved from https://www.statisticssolutions.com/cronbachs-alpha/ [Accessed 4 April 2020]. [ Links ]
[18] Yong, A.G., & Pearce, S.C. (2013). A beginner's guide to factor analysis: Focusing on exploratory factor analysis. Tutorials in Quantitative Methods for Psychology, 9, 79-94. https://doi.org/10.20982/tqmp.09.2.p079. [ Links ]
[19] Williams, B., Onsman, A., & Brown, T. (2010). Exploratory factor analysis: A five-step guide for novices. Australasian Journal of Paramedicine, 8(3), 1-16. https://doi.org/10.33151/ajp.8.3.93. [ Links ]
[20] Asadabadi, M.R., Chang, E., & Saberi, M. (2019). Are MCDM methods useful? A critical review of analytic hierarchy process (AHP) and analytic network process (ANP). Cogent Engineering, 6(1), 1623153. [ Links ]
[21] Palcic, I. (2009). Analytical hierarchy process as a tool for selecting and evaluating projects. International Journal of Simulation Modelling, 8(1), 16-26. [ Links ]
[22] Peko, I., Gjeldum, N., & Bilic, B. (2018). Application of AHP, Fuzzy AHP and PROMETHEE method in solving additive manufacturing process selection problem. Tehnicki Vjesnik - Technical Gazette, 25(2), 453-461. https://doi.org/10.17559/TV-20170124092906. [ Links ]
[23] MaletiC, D., Lasrado, F., MaletiC, M., & Gomiscek, B. (2016). Analytic hierarchy process application in different organisational settings. In F. de Felice, T.L. Saaty, & A. Petrillo (eds), Applications and theory of analytic hierarchy process - Decision making for strategic decisions. London: IntechOpen. https://doi.org/10.5772/64511. [ Links ]
[24] Triantaphyllou, E., & Mann, S. (1995). Using the analytic hierarchy process for decision making in engineering applications: Some challenges. The International Journal of Industrial Engineering: Theory, Applications and Practice, 2, 35-44. [ Links ]
[25] Alonso, J.-A., & Lamata, M. (2006). Consistency in the analytic hierarchy process: A new approach. International Journal of Uncertainty, Fuzziness and Knowledge-Based Systems, 14(4), 445-459. [ Links ]
[26] Teknomo, K. (2006). Analytic hierarchy process (AHP) tutorial. Revoledu.com, 6(4), 1-20. https://people.revoledu.com/kardi/tutorial/AHP/ [Accessed 20 April 2020]. [ Links ]
[27] Xu, K., & Xu, J. (2020). A direct consistency test and improvement method for the analytic hierarchy process. Fuzzy Optimization and Decision Making, 19(3), 359-388. [ Links ]
[28] Putra, M.S.D., Andryana, S., Kasyfi, F., & Gunaryati, A. (2018). Fuzzy analytical hierarchy process method to determine the quality of gemstones. Advances in Fuzzy Systems, 2018, 9094380. https://doi.org/10.1155/2018/9094380. [ Links ]
[29] Fisher, R., & Miller, D. (2008). Responding to student expectations: A partnership approach to course evaluation. Assessment & Evaluation in Higher Education, 33(2), 191-202. [ Links ]
[30] Velasquez, M., & Hester, P.T. (2013). An analysis of multi-criteria decision making methods. International Journal of Operations Research, 10(2), 56-66. [ Links ]
Submitted by authors 7 Jul 2021
Accepted for publication 5 Aug 2022
Available online 14 Dec 2022
* Corresponding author: haburas@kau.edu.sa
ORCID® identifiers
H.M. Aburas: 0000-0002-7643-8995
I.A. Batarfi: 0000-0003-0870-7222
A.F. Bahshwan: 0000-0003-2519-5847
R.A. Alzahrani: 0000-0003-1801-880X
A.M. Qarout: 0000-0001-5799-9984

