


Services on Demand
Article
 English (pdf)
 Article in xml format
 Article references
Indicators

Related links
-
 Cited by Google
 -
 Similars in Google
Share

 Permalink
South African Journal of Industrial Engineering
On-line version ISSN 2224-7890
Print version ISSN 1012-277X
S. Afr. J. Ind. Eng. vol.33 n.3 Pretoria Nov. 2022
http://dx.doi.org/10.7166/33-3-2808
SPECIAL EDITION
Reduced order topology optimisation of a planar honeycomb defined by a linear elastic Ti6al4V (ELI) material model
M.I. ChibinyaniI,*; T.C. DzogbewuI; M. MaringaI; A.M. MuiruriII
IMechanical and Mechatronic Engineering Department, Central University of Technology, Bloemfontein, South Africa
IIDepartment of Mechanical and Manufacturing Engineering, Southern Eastern University Kenya, Kitui, Kenya
ABSTRACT
Combined numerical modelling and topology optimisation methods are useful in the design and analysis of engineering structures. The two tools are used to predict and optimise the mechanical properties of structures. Numerical modelling and optimisation of three-dimensional honeycomb structures is challenged by the sharp angles in its geometry. This reduces effective iterations in topology optimisation at the vertices and edges. The alternative - generating effective iterations at the vertices and edges in planar honeycombs of Ti6Al4V (ELI) - is presented in this paper. Mesh convergence tests with varying mesh densities were conducted on planar unit hexagonal cells at the start. The results obtained from planar unit hexagonal cells under out-of-plane compression loads before and after topology optimisation were compared. This was followed by shape optimisation and numerical analysis, and the results were compared with the numerical analysis before topology optimisation. The same procedure was followed for a planar honeycomb model. Acceptable predictions were obtained for the planar numerical models. Material reductions of 30% and 8% for the planar unit hexagon cell and for the honeycomb model respectively were obtained in topology optimisation. The maximum stresses in these numerical models after shape optimisation reduced by 58% and 4% respectively.
OPSOMMING
Gekombineerde numeriese modellering en topologie-optimeringsmetodes is nuttig in die ontwerp en ontleding van ingenieurstrukture. Die twee instumente word gebruik om die meganiese eienskappe van strukture te voorspel en te optimaliseer. Numeriese modellering en optimalisering van driedimensionele heuningkoekstrukture word uitgedaag deur die skerp hoeke in die geometrie. Dit verminder effektiewe iterasies in topologie-optimalisering by die hoekpunte en kante. Die alternatief - die generering van effektiewe iterasies by die hoekpunte en rande in vlakke heuningkoeke van Ti6Al4V (ELI) - word in hierdie artikel aangebied. Maaskonvergensietoetse met wisselende maasdigthede is aan die begin op vlakke eenheid seskantige selle uitgevoer. Die resultate wat verkry is van planêre eenheid seskantige selle onder buite-vlak kompressiebelastings voor en na topologie optimering is vergelyk. Dit is gevolg deur vormoptimering en numeriese analise, en die resultate is vergelyk met die numeriese analise voor topologie-optimering. Dieselfde prosedure is gevolg vir 'n plat heuningkoekmodel. Aanvaarbare voorspellings is vir die planêre numeriese modelle verkry. Materiaalverminderings van 30% en 8% vir die planêre eenheid seskantige sel en vir die heuningkoekmodel onderskeidelik is verkry in topologie-optimering. Die maksimum spannings in hierdie numeriese modelle na vormoptimering het met 58% en 4% onderskeidelik verminder.
1. INTRODUCTION
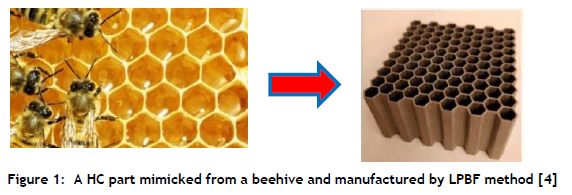
In the application of additively manufactured (AM) lightweight honeycomb (HC) parts, improving the absorption of strain energies in biomedical implants, aircraft, and automobile components is most common [1-4]. These HC parts can be manufactured using titanium alloys, including Ti6Al4V (ELI - extra low interstitial). The alloy is biocompatible, has good mechanical properties, and is corrosion-resistant [5-6]. Incorporating HC models in AM technologies has led to the manufacture of bioinspired HC parts such as the one shown in the image on the right of Figure 1[4]. Direct metal laser sintering, a subset of laser powder bed fusion, is a layer-wise manufacturing method that has been used for the manufacture of these metallic HC parts [15].
For the efficient design and manufacture of engineering components, structural optimisation is carried out to improve the mechanical properties and reduce the amount of material used [7]. Topology optimisation (TO) is the most common method used for structural optimisation. Specific algorithms that are built into TO software packages are used to take advantage of the geometric complexity allowed by AM. These algorithms assist with assigning the amount of material, loading, and setting boundary conditions effectively, particularly in areas of concern such as the vertices and edges [8]. The structural optimisation of simple cellular parts with sharp angles in their geometry, such as the HC, which is made of thin connected plates, requires careful analysis. This is because the vertices and edges are regions of high stress that are liable to fail at lower applied loads than other parts of the HC. Topology optimisation can be useful in improving the structural stability of HC parts [9]. However, the TO method struggles when dealing with three-dimensional (3D) HC parts, as they have fewer effective iterations at the vertices and edges. These fewer effective iterations can lead to inaccurate changes of shape for the HC model. This inaccuracy is usually noted when the HC model has lower densities at the vertices and edges than other HC parts after TO [9-11]. Topology optimisation gives rise to models with changes of shape at their boundaries. The models produced are then exposed to numerical modelling that is followed by shape and size optimisation to fine-tune the solution. The method of shape optimisation (SO) affects the boundaries of a geometry the most. These changes of shape are implemented on the boundary of a structure to reduce stresses in highly stressed regions [12-13].
1.1. Topology optimisation of 3D HC parts
There are two popular techniques for TO: the method of solid isotropic material with penalisation (SIMP), which is based on the solution of binary constraints by introducing continuous relaxations to a problem; and the evolutionary structural optimisation (ESO) method, which is based on engineering heuristics with proof of optimality [9, 12]. The SIMP method is the more commonly used of the two because the optimisation with discrete design variables that is required of ESO can be difficult. Further details of the SIMP and ESO methods can be found in [9, 12-17].
In this paper, the SIMP method was adopted, since the ESO method has difficulty reaching convergence in topology optimisation, as illustrated in Figure 2[17-18].
The HC 3D parts can be reduced to planar geometries in numerical analyses [11]. It is assumed that the material forming the ribs of the HC structure is isotropic, which makes its behaviour highly predictable [7]. The purpose of this study was to investigate the ability of topology optimisation effectively to generate iterations of topologies in areas of concern, using a planar hexagonal unit cell and HC model.
2. MATERIALS AND METHODS
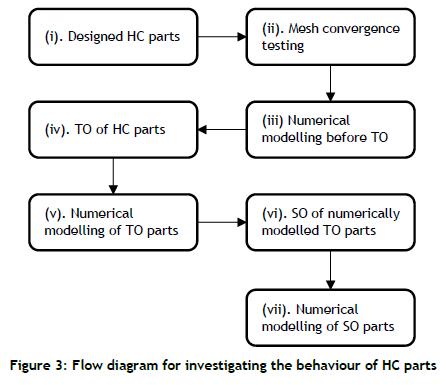
The investigation undertaken in this study followed the flowchart in Figure 3
2.1. Honeycomb part design
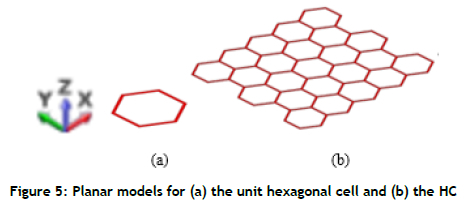
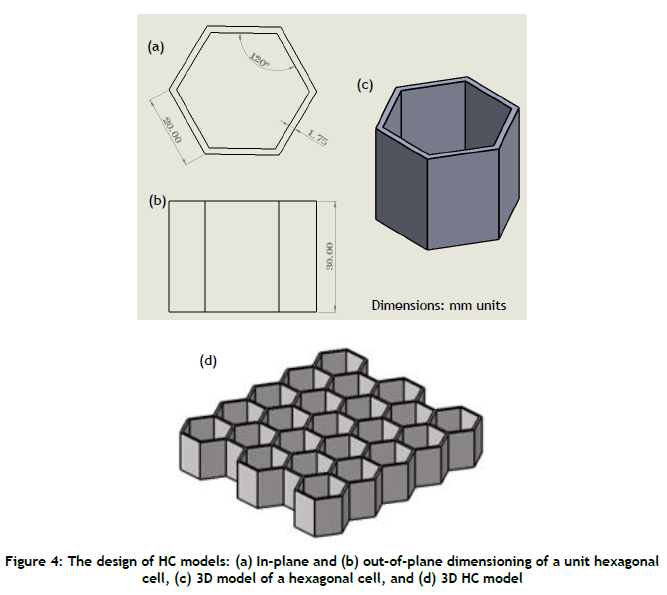
The 3D unit hexagonal cell and the HC model were generated in SolidWorks design software (version 2021 SP5) using millimetre units, as shown in Figure 4 The HC model with consistent wall thickness was produced by linear patterning the unit 3D hexagonal cell with a 5x5 cell configuration, as shown in Figure 4(d). The two models were then reduced to planar problems using Altair-Optistruct design software (HyperWorks 2021), as shown in Figure 5
2.2. Mesh convergence testing
Using Altair-Optistruct software, mesh convergence tests were conducted on a planar unit hexagonal cell model with material properties of Ti6Al4V (ELI). The Young's modulus, Poisson's ratio, yield strength, and density assigned to the model were 113.8 GPa, 0.342, 790 MPa, and 4430 Kg/m3 respectively [19]. The yield strength of materials is a variable dependent on their microstructure. The properties used in the present work are those reported for the bimodal microstructure of Ti6Al4V (ELI) with equiaxed-a and a + β lamellar microstructure, shown in Figure 6[20].
The planar model was assigned a shell property with a depth of 2 mm, and used to predict the behaviour of the material. A second-order quadrilateral element type was used as the primary element to generate mesh on the geometry. This type of element was recommended for stress analysis, especially for finding stress concentrations near small features such as vertices and edges. The reason is that, when quadrilateral elements are used, it is easier to create streamlined meshes around the vertices [12]. This helps to capture the normal stress-strain relations with more accuracy. Numerical tests were conducted using different mesh sizes in the range of 0.7 to 9 mm in order to test for mesh convergence. A descending order sequence of mesh sizes, from 9 mm, 8 mm, 7 mm, 6 mm, 5 mm, 4 mm, 3 mm, 2 mm, 1 mm, 0.9 mm, 0.8 mm, to 0.7 mm was used, and mesh convergence was considered to have been achieved when the result of stress obtained varied from the previous one by less than 5%. Convergence of the mesh size was first tested with reference to the Von Mises stress at mid-span of the loaded member for transverse deflection. This was because the maximum transverse deflection, and therefore the Von Mises stress, was expected to occur at mid-span. A similar test was conducted for axial and bending deformation for all types of members in the structure. These members all experienced maximum values of axial and bending deformation for each different mesh size that was used.
The mesh size for convergence determined this way was then used in all ensuing numerical analyses and structural optimisations of the planar unit hexagonal cell and the HC model. However, it is worth noting that previous studies such as [5, 9-11, 14, and 21 ] have observed that mesh failure is dependent on the size of the sharp angles formed at the edges and vertices, irrespective of type of geometrical shape such as the honeycomb. By increasing the sharpness of the angles in a geometry, the meshing algorithm in many numerical modelling packages automatically finds it increasingly difficult to identify the best possible arrangement of elements [9-10]. The elements generated in the corner regions of the HC model showed low connectivity. To correct this, triangular elements were substituted for the quadrilateral elements at the vertices.
2.3. The preliminary finite element (FE) hexagonal unit cell and HC model
Preliminary finite element modelling for the unit hexagonal cell and HC geometries was conducted in Optistruct software before implementing TO. The numerical models were based on the Gibson and Ashby models for the elastic behaviour of honeycombs [22]. The material parameters considered were the same ones used for the mesh convergence tests described in the previous section. The FE models were investigated, based on a linear elastic behaviour for all load states that were modelled. For the loading boundary condition (BC), a simple compressive mid-span uniaxial concentrated load was used, as shown in Figure 7 Furthermore, fixed constraints were assigned to the labelled region of the model, also shown in Figure 7 The fixed constraint was chosen because of its ability to restrain against both rotation and translation displacement of the walls so restrained [4].
The FE model for the unit hexagon cell and HC was also simulated, based on the following expression for the Von Mises stresses σv:
where the symbols E and e represent the material elastic modulus and the strain of the model. It was assumed that the generated Von Mises stresses were equal to the yield strength of the material (σv - σy) [22]. This implied that the material was modelled at yield to determine its mechanical behaviour at the maximum elastic load it could carry.
The results of this preliminary work served to define the load paths and stress distribution in the hexagonal unit cell and the HC model. This provided useful insights to assist in TO for the purposes of light-weighting.
2.4. The topology optimisation of hexagonal unit cell and HC model
The topology optimisation of the hexagon unit cell and the HC model was implemented in a two-phase structural optimisation process of light-weighting followed by stress reduction. The first part was implemented, based on the SIMP method developed by Bendsoe [14]. An Altair-Optistruct solver was used to carry out TO of the unit hexagonal cell and HC structures. First, the solver automatically assigned a mathematical objective function to the discretised problem to describe a typical discrete result during the process of optimisation. This result was based on iterating the design variables (x) from the geometry space or material distribution, while following the objective function f(x,y). In turn, state variables (y) were generated in terms of stresses and strains to describe the loading behaviour of the subsequent FE models. The TO model of the hexagon cell unit and HC structures obtained using equation (2) were obtained as discrete element densities. Therefore, a second step of TO was automatically carried out to change the discrete structure into a continuous structure. This involved interpolating the Young's modulus of the material into that of specific members in the structure. Thus, effective stiffnesses Es were assigned to the TO model for which the fictitious densities of the iterations carried out were given penalty scores according to the power law [8], expressed as follows:

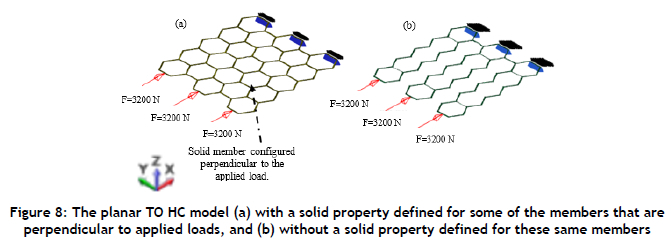
where p is the penalisation parameter used to allocate penalty scores for element densities (x - pe) between 0 and 1 values. The range of the parameter p lies between 1 and 3. The range is responsible for confirming the varying densities of the material at different points in the structure being modelled. A continuous structure is modelled with a value of the parameter p - 3 [15]. The higher the p-value, the more effective the penalty score is in controlling the TO algorithm using the continuous relaxation approach. For TO, the penalty scores were implemented by reducing the densities on the TO model until the possible minimum densities were left on the continuous structures. The initial TO of the planar HC structure deleted most of the members that were perpendicular to the applied loads because they were redundant, thus leading to the mechanism (not structure) shown in Figure 8(b). Therefore, these members were allocated a solid property, as shown in Figure 8(a).
The topology optimised models were subsequently analysed numerically, as described in the next subsection, and the obtained results were compared with those of preliminary numerical modelling done before carrying out TO.
2.5. The topology-optimised finite element unit cell and HC model
The topology-optimised finite element HC models were meshed with dominant second-order triangular elements of the size arrived at in the convergence tests. The meshes in the regions found to have poor connectivity of elements were refined. Following this, numerical analyses were implemented with the same boundary conditions used for the numerical analysis done before carrying out TO.
The topology optimised finite element HC models were fine-tuned as described in the next subsection using a complementary TO method known as shape optimisation to reduce stresses and the results were compared to the results of preliminary numerically modelling carried out before TO.
2.6. The shape optimised finite element unit cell and HC model
The boundary sensitivity or shape optimisation method developed by Hadamard [23] was introduced on the full design space of the FE honeycomb model to fine-tune the shape in order to reduce stresses. The method considered an adaptable shape for the change of shape of the topology-optimised finite element hexagonal unit cell and HC model, while maintaining adequate control over the design fillets. The recommended control over the design fillets is significant because free-shape optimisation does not preserve small design features such as the rounding of sharp edges or corners. The iterations of the topologies were implemented based on an objective to reduce the maximum stresses to the lowest possible stresses that could be achieved. The application of SO also smoothened the sharp edges and vertices found on the topology-optimised finite element hexagonal unit cell and HC model.
3. RESULTS AND DISCUSSION
The results of the mesh convergence studies carried out in this study are first presented and discussed. This is followed by the results of the preliminary numerical modelling of a unit hexagonal cell and HC structure to establish the distribution of stresses and deformations. The results of this preliminary work were then fed into the SIMP method for TO, followed by numerical modelling of the topology-optimised finite element hexagonal unit cell and HC model, with the results presented and discussed next. Finally, the SO of the topology-optimised finite element HC model, followed by the numerical modelling of the shape-optimised finite element HC model, was carried out, for which the results are presented.
3.1. Mesh convergence analysis
At first, a unit hexagonal cell model was implemented in a numerical integration and meshed with different mesh sizes to predict the optimal mesh size. The twelve different mesh sizes of 9, 8, 7, 6, 5, 4, 3, 2, 1, 0.9, 0.8, and 0.7 mm, when applied to a unit hexagonal cell using Altair-Optistruct software, generated 20, 36, 54, 72, 96, 120, 168, 264, 504, 690, 780, and 900 second-order quadrilateral shell elements, with the results shown in Figure 9
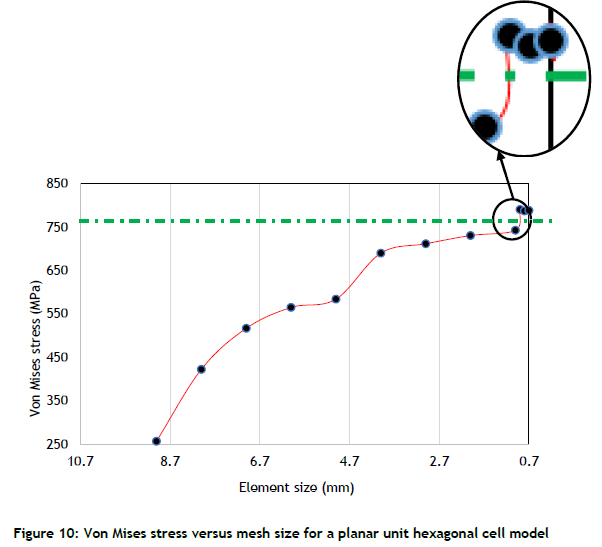
The percentage changes of the Von Mises stresses Δσv, defined in Equation 3, between one mesh size and the next, were obtained as 64.47%, 22.33%, 9.30%, 3.38%, 18.16%, 3.11%, 2.67%, 5.71%, 0.36%, 0.078%, and 0.083%, starting with a mesh size of 9 mm and ending with a mesh size of 0.7 mm. These results were calculated with the following expression:
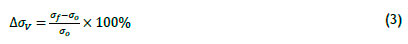
where σf and σ0 are the Von Mises stresses of the current and previous mesh size respectively [9]. A curve plot of the Von Mises stress (σv) obtained at each of these mesh sizes is shown in Figure 10 The curve shows a tendency towards a limiting value as the mesh size decreases, with an acceptable low percentage change of σv = 0.36% at a mesh size of 0.9 mm.
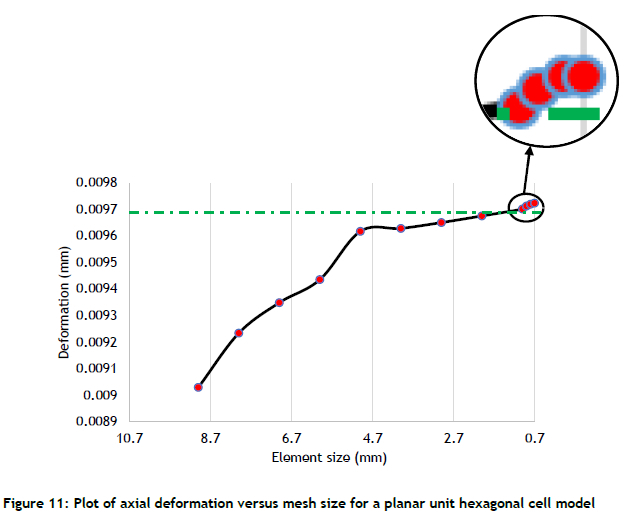
The percentage change of deformation for mesh sizes ranging from 0.7 to 9 mm were found to be 0.041%, 0.072°%, 0.11°%, 0.27°%, 0.20°%, 0.29°%, 0.11°%, 1.93°%, 0.93°%, 1.25°%, and 2.27°% respectively and are plotted in Figure 11. These results were obtained from the following equation for percentage change of axial deformation Δδ:
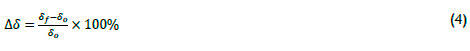
where δf, and δ0 are the X1 direction deformation of the current and previous analysed mesh sizes respectively [9]. The curve of axial deformation against mesh size shown in Figure 10 shows a trend to convergence with decreasing mesh size, with an acceptable low percentage change of δ = 0.11% at a mesh size of 0.9 mm.
The discretisation errors in the two figures for Von Mises stress and axial deformation were therefore considered insignificant below a mesh size 0.9 mm, based on the maximum allowed percentage changes of 5% [9] and 1% [12] respectively. The discretisation errors in a unit hexagonal cell are expected to be higher in the regions with sharp changes of geometry. However, these errors will also diminish with decreasing mesh sizes [9, 10, 12 and 24].
The low percentage changes of Von Mises stress and deformation obtained with mesh sizes of 0.9 mm, 0.8 mm, and 0.7 mm in Figures 10 and 11 create confidence in the use of these mesh sizes in the simulation of the planar unit hexagonal cell and HC model that are the subject of investigation in this work. The smallest of these meshes, that of 0.7 mm, was selected for use in all subsequent modelling.
3.2. Preliminary FEA analysis (numerical analysis before TO)
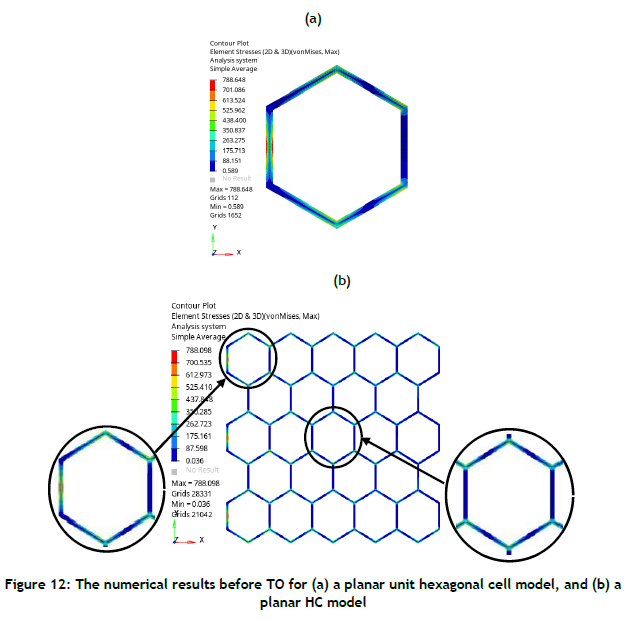
The analysis was done with a limiting axial stress σv = σys, of 788.089 MPa, which was slightly lower than the known yield stress of 790 MPa for the material of interest, Ti6Al4V, for a mid-span concentrated load P =3188 N. The load was applied to the vertical cell wall (member) of the unit hexagonal cell shown on the extreme left of Figure 12(a) and to the three vertical cell walls (members) of the HC model indicated on the extreme left of Figure 12(b). The σv contour plots of the two FE models are shown in Figure 12. The contour plots in the figure show the highest stresses to occur at the mid-span of the edges of the loaded member and some parts of the inner and outer edges of the inclined members near the vertices.
It is evident from Figure 12 that the outer regions of the cell members were more highly stressed than the central regions, with the exception of some vertices, certain locations on the cell members that are inclined to the vertical, and the vertical members other than those on which load was applied. Similar observations were noted in [4, 8, and 14]. The distribution of Von Mises stresses for a unit hexagonal cell model shown in Figure 12(a) were compared with two magnified unit cells placed on the left and right side of a HC model shown in Figure 12(b). The magnified unit cell on the left side showed a distribution of stresses that was similar to that of Figure 12(a). The magnified unit cell on the right side had a similar distribution of Von Mises stresses except for the loaded vertical member. The vertical members without load had close to zero stresses. This was because the stresses in structural frames are only transferred along the axial directions of the members. It is proposed that the application of multiaxial loads on the unit planar hexagonal and HC structures would ensure the presence of a load applied parallel to these members, and therefore lead to a different distribution of stress in them. Moreover, the general case of a load inclined to the horizontal direction at an arbitrary angle theta should be useful in exploring the effect of the size of this angle on the stress distribution, deformation, and deflection of members.
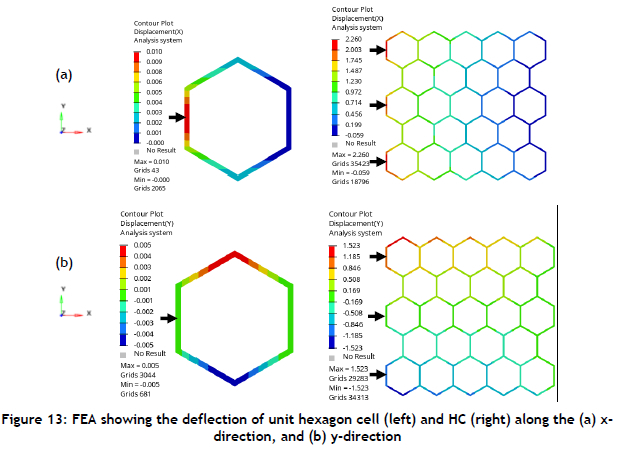
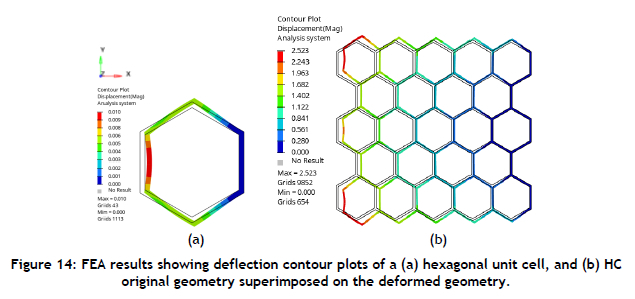
Deflection of the members of the frame structures occurred along the x- and y-axes to the magnitudes shown in Figure 13 The two diagrams from the left to the right of Figure 13(a) are deflection contour plots for the unit hexagonal cell and the HC model in the x-direction respectively. The two diagrams on the left and right of Figure 13(b) are similar to the one in Figure 13(a), but show contour plots for deflections in the y-direction. The contour plots in the figures show the largest deflection to occur in the x-direction of the mid-span of the loaded member. In the y-direction, the largest possible deflections are in the top vertices and adjacent members of the three top left-most unit cells.
It is evident from Figure 13that the largest deflections to occurred in the unit hexagonal cell and the HC structure were because of bending loads acting on the loaded members. The deflections in the x-direction were higher than those in the y-direction. In addition to the bending deflection of the inclined members, the members also deformed axially, as is expected from the theory of structural frames. The inclined members, therefore, behaved like beam-columns that contributed to both their x- and y-directional bulk movement. The vertices and the regions close to these vertices that connect the inclined members exhibited these bulk movements, as shown in Figure 14(a, b). Such bulk movements will be dependent on the angle of inclination at the vertices, as both the axial and transverse loads on the members vary with the angle of inclination. This was also observed in [22].
The TO results in the next section were generated using these same geometries, with the advantage of knowledge about the distribution of stress, deformation, and deflection in their members.
3.3. The TO analysis
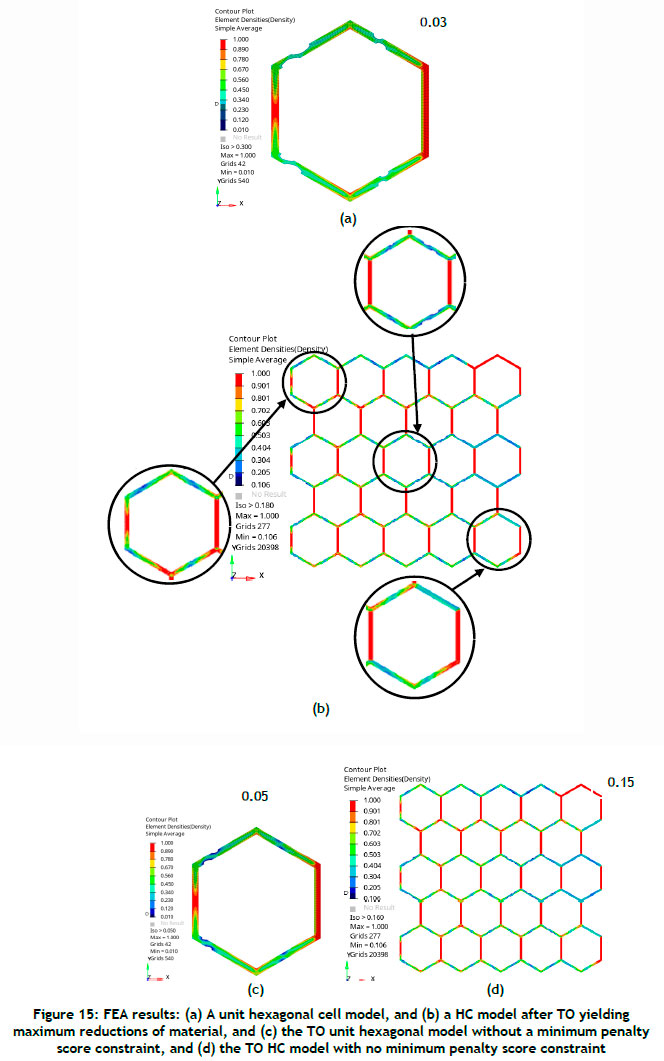
Topology optimisation of the unit hexagonal cell and the HC model generated maximum reductions of the material used of 30% and 8% respectively for the maximum respective penalty scores of 0.3 and 0.18 before structural connectivity was lost. The optimised members for these maximum reductions were as shown in Figures 15(a) and (b) respectively. The TO solver allowed a minimum penalty score constraint value of 0.106 for the intermediate solid densities of the FE HC model. However, better results for the model shown in Figure 15(b) were obtained using a minimum penalty score value of 0.15, as shown in Figure 15(d). In contrast, TO unit hexagonal cell models in both Figures 15(a) and (c) were obtained without any minimum penalty score constraint. This is because TO results depend on the mesh predicted before TO was carried out. The unit hexagonal cell had a lower total number of sharp angles in its geometry, which meant that there were fewer repetitions of mesh errors in the geometry than in the HC model.
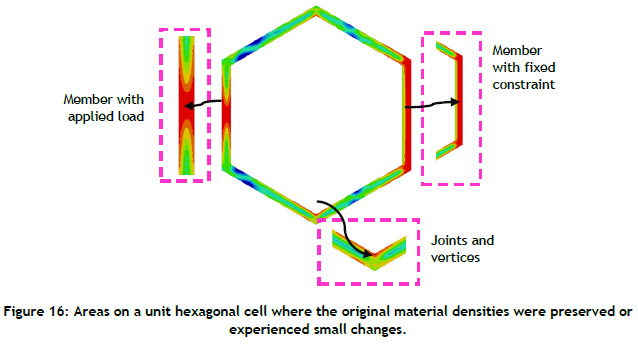
These new topologies in Figures 15(a) and (c) show that the densities of the material in areas that were observed to have high stresses in Figure 12(a) remained largely intact or changed by small amounts. These areas included the vertices and edges of the inclined members and the mid-span of the member with an applied load and the one with a fixed constraint, as shown in Figure 16
It is not surprising that the material densities reduced from the original models were small percentage areas of the total area. The honeycombs are classified as delicate structures because of their thin members and the multiple constraints arising from their complex geometry [4, 14]. The densities of the structural members in both models were predominantly preserved in the regions with high stresses shown in Figure 12 to preserve the stiffness of the structures, which ties in with the observations made by [9, 12, 25, and 14]. These TO results, however, had rough-edged geometries at this stage, and required implementation of SO to reduce them [9].
The new topologies obtained showed that the fictitious densities were reduced from the edges of the members instead of creating voids in the design space as expected from the TO theory [12, 26]. To determine the location, to create and shape voids in thin wall sections is very difficult when using the SIMP method for many software packages of TO. This is because such structures have a delicate structural connectivity, and by creating voids to optimise the wall sections, further structural discontinuities can easily occur [9-10, 17]. Such voids can also lead to impractical designs because of the limitation of low resolutions required in their manufacture [27]. It is recommended that TO be implemented before and during the design process. The TO done before ensures that the load paths and weaknesses in a structure are identified and considered more effectively when introducing constraints that allow voids to be created in the thin wall sections during TO.
3.4. Numerical analysis of TO model
The numerical stress analysis of the TO models obtained in the preceding sections are shown in Figure 17 The use of penalty score values of 0.05, 0.10, 0.15, 0.20, 0.25, and 0.30 on the unit hexagonal cell model resulted in values of Von Mises stresses aa of 797.7, 810.9, 825.1, 848.4, 856, and 869.7 MPa respectively. This trend was consistent with the linear relation expected between the densities and the material stiffness of a structure. By reducing the densities of a structure, the stresses increase, causing its stability to decrease. The numerical models shown in Figure 12 had better stiffnesses than the numerical models of the TO models.
It is evident from Figure 17that removing densities causes the stiffness of a frame structure to decrease. Increasing the penalty score values introduced more regions with sharp changes to their geometry, specifically in regions where densities were removed. This caused the stresses in a structure to increase and in return, the stiffness of the structure was decreased.
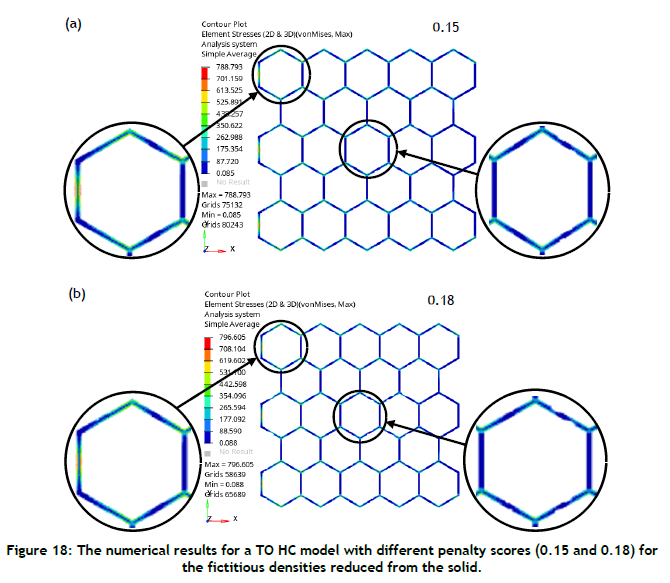
The numerical results in Figure 18that were obtained for a TO HC model were similar to those of the previous analysis. However, a linear relation between material stiffness and density occurred for the minimum penalty scores, as was the case for the previous model. This relationship was also limited by the multiple constraints arising in the HC model, which were discussed in the TO section. The many sharp angles in the geometry reduced effective iterations in TO.
The numerical results of the TO models showed that the stiffnesses were decreased compared with the results observed and discussed in Figure 12. This agreed with the findings in [9]. These numerical models were produced before structural connectivity was lost, and the results that were obtained agreed with what was observed in [22]. The next section shows that the numerical results for TO geometries can be fine-tuned using shape optimisation to reduce stresses in areas of concern.
3.5. Numerical analysis of SO model
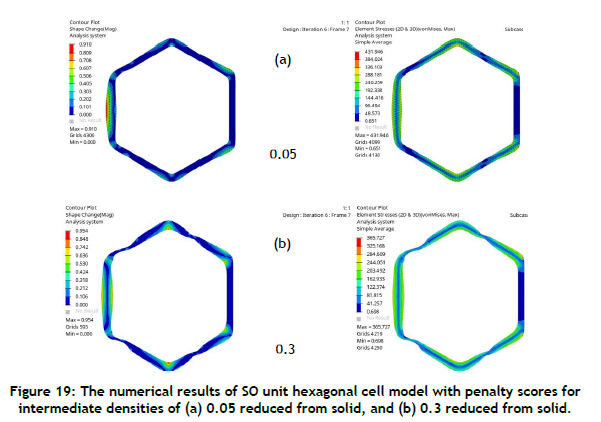
Shape optimisation was carried out on the numerical models of the TO unit hexagonal cells presented in Figure 17 with σv values of 797.7 MPa and 869.7 MPa. The maximum stresses obtained decreased from those of non-topologically optimised unit hexagonal cells by 46% and 58% respectively, as shown in Figure 19 For the HC models shown in Figure 18 with σv values of 788.8 MPa and 796.6 MPa, the percentage stress reductions obtained after shape optimisation were 4% and 2.9 x 10⁻⁵% respectively, as shown in Figure 20 These last percentage stress reduction results were negligibly small.
The effects of SO on the reduction of maximum stresses for the unit hexagonal cell after TO showed more effective stress reduction than for the HC model. This was consistent with the behaviour observed in [14, 23]. This could be because the unit hexagonal cell had a lower total number of sharp angles in its geometry than the HC. These sharp angles contributed to mesh errors that reduced the effectiveness of iterations in mesh-dependent SO. Having fewer errors occurring ensured that the change of shape during SO was more effective in reducing stresses. The HC model showed lower percentage values of reduction in maximum stresses because of the many constraints and sharp angles at the vertices and edges. This caused mesh errors to increase, and as a result, the effectiveness of iterations in SO reduced in areas of concern.
4. CONCLUSION
Numerical modelling and the consecutive use of topology optimisation followed by shape optimisation applied to a unit hexagonal cell and an HC, presented in this paper, led to the following deductions:
• The mesh converged for mesh sizes below 0.9 mm.
• The topology-optimised planar unit hexagonal cell and the HC had maximum material density reductions of 30% and 8% respectively. The respective fictitious densities gave rise to maximum penalty scores of 0.3 and 0.18 before a lack of continuity in the elements was visible on them. The unit hexagonal cell had high penalty scores compared with the HC model because it had fewer constraints that reduced the effectiveness of TO.
• The reduction of densities occurred on the edges instead of through the creation of voids in the design space. This was chosen by the solver as the most effective solution for controlling the occurrence of element discontinuities, which randomly reduced the stiffness of thin-walled structures.
• The vertices and edges for the inclined members and the mid-span for the loaded and fixed members exhibited higher preservations of density.
• The numerical models of TO with penalty score values of 0.3 and 0.15 with respect to the unit hexagonal cell and the HC model gave rise to maximum stress reductions of 58% and 4% respectively after shape optimisation. The unit hexagonal cell was expected to have higher stress reductions than the HC model because it had fewer constraints that reduced the effectiveness of SO.
Future study should aim at developing additive manufactured HC parts to validate the optimised FE models experimentally. Numerical simulation of optimised FE models under harsh load conditions such as dynamic loading should also be carried out to test the load-bearing capacity of HC parts.
REFERENCES
[1] M. Attaran, The rise of 3D printing: the advantages of additive manufacturing over traditional manufacturing. Bus. Horiz., vol. 60, pp. 677-688, 2017. [ Links ]
[2] W. Gao et al., The status, challenges, and future of additive manufacturing in engineering. Comput. Aided Des., vol. 69, pp. 65-89, 2015. [ Links ]
[3] S. Wang, L. Liu, Z. Huang, Z. Li, J. Liu, & Y. Hao, Honeycomb structure is promising for the repair of human bone defects. Mater. Des., vol. 207, pp. 109832, 2021. [ Links ]
[4] Q. Zhang et al., Bioinspired engineering of honeycomb structure-using nature to inspire human innovation. Prog. Mater. Sci., vol. 74, pp. 332-400, 2015. [ Links ]
[5] A. du Plessis, I. Yadroitsava, & I. Yadroitsev, Ti6Al4V lightweight lattice structures manufactured by laser powder bed fusion for load-bearing applications. Opt Laser Technol., vol. 108, pp. 521-528, 2018. [ Links ]
[6] S. Maietta, A. Gloria, G. Improta, M. Richetta, R. De Santis, & M. Martorelli, A further analysis on Ti6Al4V lattice structures manufactured by selective laser melting. J. Healthc. Eng., vol. 2019, pp. 1-9, 2019. [ Links ]
[7] J. Zhu, H. Zhou, C. Wang, L. Zhou, S. Yuan, & W. Zhang, A review of topology optimisation for additive manufacturing: status and challenges. CJA, vol. 34, pp. 91-110, 2021. [ Links ]
[8] A. M. Vilardell et al., Topology optimisation and characterisation of Ti6Al4V ELI cellular structures by laser powder bed fusion for biomedical applications. Mater. Sci. Eng., vol. 766, pp. 138330, 2019. [ Links ]
[9] J. Plocher, & A. Panesar, Review on design and structural optimisation in additive manufacturing: towards next-generation lightweight structures. Mater. Des., vol. 183, pp. 108164, 2019. [ Links ]
[10] Q. Wang, H. Han, C. Wang, & Z. Liu, Topological control for 2D minimum compliance topology optimisation using SIMP method. Struct. Multidiscip. Optim., vol. 65, pp. 1-16, 2022. [ Links ]
[11] K. Maute, & E. Ramm, Adaptive topology optimisation. Springer Sci. Rev., vol. 10, pp. 100-112, 1995. [ Links ]
[12] D. Yago, J. Cante, O. Lloberas-Valls, & J. Oliver, Topology optimisation methods for 3D structural problems: a comparative study. Springer Sci. Rev., vol. 29, pp. 1525-1567, 2022. [ Links ]
[13] M. P. Bendsoe, Optimal shape design as a material distribution problem. Springer Sci. Rev., vol. 1, pp. 193-202, 1989. [ Links ]
[14] C. S. Edwards, H. A. Kim, & C. J. Budd, An evaluative study on ESO and SIMP for optimising a cantilever tie-beam. Struct. Multidiscip. Optim., vol. 34, pp. 403-414, 2007. [ Links ]
[15] M. P. Bendsoe, & O. Sigmund, "Topology optimisation theory, methods, and applications," Springer Sci. Rev., pp. 1-69, 2004. [ Links ]
[16] P. Tanskanen, The evolutionary structural optimisation method: theoretical aspects. Comput. Methods Appl. Mech. Eng., vol. 191, pp. 5485-5498, 2002. [ Links ]
[17] P. Browne, "Topology optimisation of linear elastic structures," Doctoral thesis, University of Bath, 2013. [ Links ]
[18] G. I. Rozvany, A critical review of established methods of structural topology optimisation. Struct. Multidiscip. Optim., vol. 37, pp. 217-237, 2009. [ Links ]
[19] X. P. Tan, Y. J. Tan, C. S. L. Chow, S. B. Tor, & W. Y. Yeong, Metallic powder-bed based 3D printing of cellular scaffolds for orthopaedic implants: a state-of-the-art review on manufacturing, topological design, mechanical properties, and biocompatibility. Mater. Sci. Eng., vol. 76, pp. 13281343, 2017. [ Links ]
[20] J. Case, A. Chilver, & T. F. Ross, Strength of materials and structures. Elsevier Sci, New York: John Wiley & Sons Inc, 1997. [ Links ]
[21] A. Panesar, D. Brackett, I. Ashcroft, R. Wildman, & R. Hague, Hierarchical remeshing strategies with mesh mapping for topology optimisation. Int. J. Numer. Methods Eng., vol. 111, pp. 676-700, 2017. [ Links ]
[22] M. F. Ashby, & L. J. Gibson, Cellular solids: structure and properties. Camb. J. Educ. UK, pp. 93158, 1997. [ Links ]
[23] J. S. Hademard, Mouvement permanent lent d'unesphère liquid et visqueuse dans un liquidevisqueux. CR Hebd. Seances Acad. Sci. Paris, vol 152, pp. 1735-1738, 1911. [ Links ]
[24] S. Li, H. Wei, S. Yuan, J. Zhu, J. Li, & W. Zhang, Multidisciplinary topology optimisation incorporating process-structure-property-performance relationship of additive manufacturing. Struct. Multidiscip. Optim., vol. 63, pp. 2141-2157, 2021. [ Links ]
[25] C. Beyer, Strategic implications of current trends in additive manufacturing. J. Manuf. Sci. Eng., vol. 136, pp. 64701-64709, 2014. [ Links ]
[26] M. K. Thompson et al., Design for additive manufacturing: trends, opportunities, considerations, and constraints. CIRP Ann. Manuf. Technol., vol. 65, pp. 737-760, 2016. [ Links ]
* Corresponding author: chibinyanimunashe@gmail.com
ORCID® identifiers
M.I. Chibinyani: 0000-0002-5319-4975
T.C. Dzogbewu: 0000-0002-8070-7940
M.Maringa 0000-0002-8965-1242
A.M. Muiruri: 0000-0002-8455-3731

