


Serviços Personalizados
Artigo
 Inglês (pdf)
 Artigo em XML
 Referências do artigo
Indicadores

Links relacionados
-
 Citado por Google
 -
 Similares em Google
Compartilhar

 Permalink
South African Journal of Industrial Engineering
versão On-line ISSN 2224-7890
versão impressa ISSN 1012-277X
S. Afr. J. Ind. Eng. vol.33 no.3 Pretoria Nov. 2022
http://dx.doi.org/10.7166/33-3-2790
SPECIAL EDITION
Use of kaizen principle and line balancing technique for process improvement in the assembly of automotive components
P. Govender*; M. Dewa
Department of Industrial Engineering, Durban University of Technology, Durban, South Africa
ABSTRACT
Continuous process improvement is critical for organisations to stay in business. An automotive component manufacturer faced productivity challenges after the launch of a new hybrid C-SUV automobile in South Africa. This paper aims to improve the seat cover sewing process line through a line balancing technique. The use of process standard times to balance the production process initially led to bottlenecks, and the cycle time was above the takt time of the assembly line. Through the use of work-study analysis and time studies, the bottleneck processes were identified. Elements were then categorized, and kaizen implementation occurred at the processes. The processes were then rebalanced to meet the calculated cycle time. A root cause analysis was also conducted to investigate the sources of muda and the factors affecting the rate of working. The assembly line was then rebalanced, and the balance delay decreased by 33%.
OPSOMMING
Deurlopende prosesverbetering is van kritieke belang vir organisasies om in besigheid te bly. 'n Vervaardiger van motoronderdele het produktiwiteitsuitdagings in die gesig gestaar nä die bekendstelling van 'n nuwe hibriede C-SUV-motor in Suid-Afrika. Hierdie artikel is daarop gemik om die naaldwerklyn van die sitplekoortreksel te verbeter deur 'n lynbalanseringstegniek. Die gebruik van prosesstandaardtye om aanvanklik die produksieproses te balanseer, het aanvanklik tot knelpunte gelei, en die siklustyd was bo die takttyd van die monteerlyn. Deur die gebruik van werkstudie-analise en tydstudies is die bottelnekprosesse geidentifiseer. Elemente is dan gekategoriseer, en 'n kaizen-implementering het plaasgevind in die prosesse. Die prosesse is dan herbalanseer om aan die berekende siklustyd te voldoen. 'n Grondoorsaak-analise is ook gedoen om die bronne van muda en die faktore wat die werktempo beinvloed, te ondersoek. Die monteerbaan is toe herbalanseer, en die balansvertraging het met 33% afgeneem.
1. INTRODUCTION
The only way for companies to stay in business and to keep up with the dynamic changing environment is to constantly change their processes and products to keep up with market demand. It is vital that companies stay up to speed to fulfil customers' requirements and to be a step ahead of competitors. A leading automotive company based in Durban experienced countless issues on their seat cover sewing line, and struggled to reach their output and operational availability score from the start of this new line's production. The initial planning and set-up of the processes and balancing was done on measured cycle times of the new design of the cover. This process was then planned for the predetermined set-up; however, this assembly line incurred a loss of score and efficiency due owing to bottlenecks in the processes throughout the production lines. Line balancing can help to reduce production time, eliminate bottlenecks, and maximise the output with minimum cost [1].
The aim of this study is to identify the root causes of ineffiency in the seat cover sewing process, using the line balancing technique to improve the process output. This paper will also focuses on the use of the kaizen principle, root cause analysis, and an investigation of the factors affecting the rate of working to rebalance the process and to reduce the balance delay.
2. LITERATURE REVIEW
An assembly line is described as a flow-orientated production system whose, parts are known as workstations. Work-stations are placed in such a way that work-pieces that need to be assembled move from one station to the next with the aid of some kind of transport system [1]. The term "bottleneck" comes from the analogy of the shape of a bottle. When an assembly line system happens to have bottlenecks, this can create queues at work-stations and so increase the cycle times of products and delay production targets that need to be met [2].
Shamuvel et al. [1] state that bottlenecks and that detailed information on cycle times and work content at each station has to be collected in order to identify the bottlenecks in an entire assembly line. For assembly lines to be efficient, the identification of bottlenecks is fundamental [3]. Analysis of these bottlenecks helps to provide useful insight for engineers to understand how to design efficient systems, and gives them an indication of where to start improving their systems. Bottlenecks can be then ironed out using the line balancing technique. Manaye [5] indicates that this technique focuses on increasing the accuracy of standard time, using time studies for each process, by re-arranging the work among the operators of a production line through line balancing. This can greatly assist in making production processes efficient and optimal. The main objective of line balancing is to distribute tasks evenly among the workstations to eliminate idle time and fully to use either the man or the machine involved in the process. When the number of workstations is fixed, the objective is to allocate the work between the stations in such a way that the maximum time required, which is known as the cycle time between processes, is minimised across all feasible stations [6].
Berher [2] stipulates that, when exploring kaizen practices, developing frameworks, identifying drivers and barriers, and using charts and diagrams can aid in optimizing processes. Organisations continually face different challenges in improving operations and the quality of products. Kaizen - a philosophy that refers to improvements every day, everywhere - is one of the best approaches, and is widely accepted in the service and manufacturing industries. This can assist firms to achieve operational excellence and better productivity [2]. To achieve efficient production, the approach is to minimise waste, or "muda". This can be done by identifying and eliminating over-production, the wasteful movement of materials and people, and waiting and delays [4]. The primary goal of any production system is to have only value-added processing of elements. No system is completely perfect: all systems and assembly lines need to be developed daily with small and frequent steps. These steps consist of identifying the problem, examining the current situation, analysing the causes, proposing improvement strategies and counter-measures, and implementing the options that would be best for the line.
The fishbone diagram, also known as the Ishikawa diagram, has become a key diagnostic tool for analysing and illustrating problems through root cause analysis. This is also a useful diagnostic tool for improvement [7]. Fishbone analysis begins with a problem, this diagram provides a template to separate and categorise the causes of the major problems in a process [8]. Because this method allows problems to be analysed, if it is used with colleagues, it gives everybody an insight into the problem so that solutions can be developed collaboratively [7]. This tool can also assist groups or individuals to identify the root causes of problems to understand the reasons behind the failures, and to determine a progression of actions and consequences to prevent another failure from occurring [9].
3. RESEARCH APPROACH
The seat cover line was selected from the sewing section. Figure 1 shows the process flow of the research approach. The pattern description, fabric types, and colour were chosen, and the necessary data was accumulated from the selected line. The first step was to identify the problem and to understand the scope of the work. The second step was to gather the data about the problem and statistically represent the data to identify the processes that contributed to the downtime and the bottleneck processes that caused the balance delay. Here, the analysis and interpretation were done using charts, diagrams, graphs, and tables. In this step, the process sequence and machine requirements of the inputs of the operating lines were analysed.
The third step was to describe the problem accurately after gathering all the data about the problem, and to draw a fishbone for the root cause analysis for possible reasons that the production line was not meeting its score. The fourth step was to identify muda in the process and the fifth step was to suggest improvements to eliminate that muda. In the sixth step, the process being studied was then rebalanced by re-distributing the elements between processes. This helped to ensure a smoother flow of parts from one process to the next and to avoid having parts stuck at the bottleneck processes. There would then be implementation at the line side to carry out trials for a month, during which the new percentage of operational availability (OA) was recorded. New trial results were then captured and analysed. The actual and target values before and after the trials were also compared and analysed to give an indication of progress. A comparison of the productivity and efficiency of each process before and after implementing and standardising the work, was also done.
4. CASE STUDY BACKGROUND
4.1. Problem definition
An automotive component manufacturer based in Durban, South Africa produces covers and seats for a new hybrid SUV automobile. At the final seat cover assembly line, it was found that the production line stopped on many occasions and for many reasons. Figure 2 shows the process flow for the C-SUV cut pieces, which were then transported to the sewing assembly line. When a cover is fully sewn and assembled during the sewing process, it is then transported to the seat assembly process. This is where the final seat set is assembled and then sent to the customer.
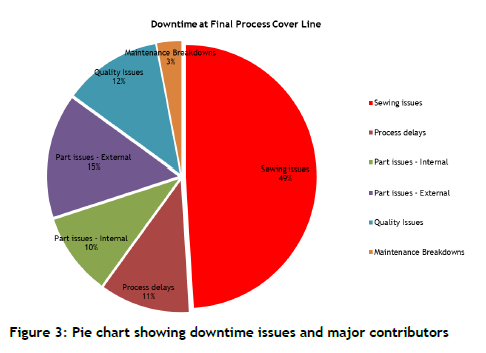
During the seat assembly process, each line stoppage is recorded on the daily production sheets. Data from the production sheets of the process were summarized. The information about the factors leading to downtime is summarised in the pie chart that is shown in Figure 3. The major contributor to the final production line was the sewing assembly line, followed by external part issues and quality issues.
The overall front sewing line being investigated is made up of two interconnecting lines, the front sub-line and the front main line. In the sub-line, which is at the start of the line, work units are pushed downstream after each sub-component is finished at each station. Here, smaller handling and detailed working parts are sewn to avoid causing further delays on the main line. These parts, when completed, are put back in dunnages on rollers and move to each station. Space is allocated for one or more work units in front of each station, providing it with an available supply of work. The front main line is a continuous transport system (conveyor) that operates at a constant speed. Here parts from the sub-line are placed on the conveyor for front main line operations to be completed. Once all of the components have been assembled, the finished goods (covers) are then sent to quality inspection for quality checks.
The process work sequence and elements for the front sub-line and the front main line are shown in Table 1 and Table 2.
4.2. Potential causes of bottlenecks in processes
A fishbone diagram helps staff in organisations to determine and understand the cause of a particular problem and to clarify the issues. In this case, when the root cause analysis was done, it was found that many underlying factors led to the process being unable to meet its targets. The fishbone diagram in Figure 5 shows the factors that affected the process.
The material being sewn is either fabric or leather; leather has a higher work content. Concerning measurement, the initial cycle time used was estimated, not the actual cycle times. In addition, there was no actual cover at the time of the planning process to sew and to allow actual cycle times to be recorded. Regarding the employees, specialised skills are hard to find, and so some operators might lack the necessary skills and require a longer period of training
The initial balancing of the process and its elements was done by an affiliate organisation during the initial planning stages. These cycle times were calculated by taking a certain length of a sewn stitch and multiplying that by a standard time, this was then compared with recorded times using a stop watch. An example is shown below.
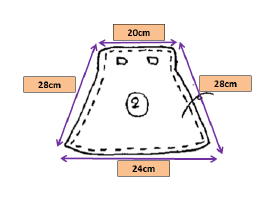
The total sum of all sides x standard sewing time (seconds)
= (18cm+ 10cm+ 18cm + 14cm) x 3 seconds
= (60cm) x 1.2 seconds*
= 72 cm/s
= 1.2cm/min to sew piece
*1.2 seconds considered standard sewing time at company/affiliate
These process information inputs were then used to plan the facility that was required. The total cycle time given to assemble the entire cover component was 2 394 seconds for the front main line sewing and 1 197 seconds for the sub-line sewing. With this information, the number of machines ordered and the headcount required to run this process were calculated, as shown below.
Main line process calculation
Number of processes = Sum of ΣCT / Takt of process
= 2 934 seconds/399 seconds = 6 processes
Sub-line process calculation
Number of processes = Sum of ΣCT / Takt of process
= 1 197 seconds/399 seconds = 3 processes
When in full production, it was found that the daily operational availability (OA) achieved at this sewing section was only between 43% and 55%. From the analysis of this data, the indication was that the process was not meeting the daily target and score as initially set out. The objective of this study was to clarify the measurements, to identify the factors leading to the sewing assembly process being unable to meet its score, and to rebalance the process.
5. RESULTS
5.1. Initial operational availability and process cycle times for bottlenecks
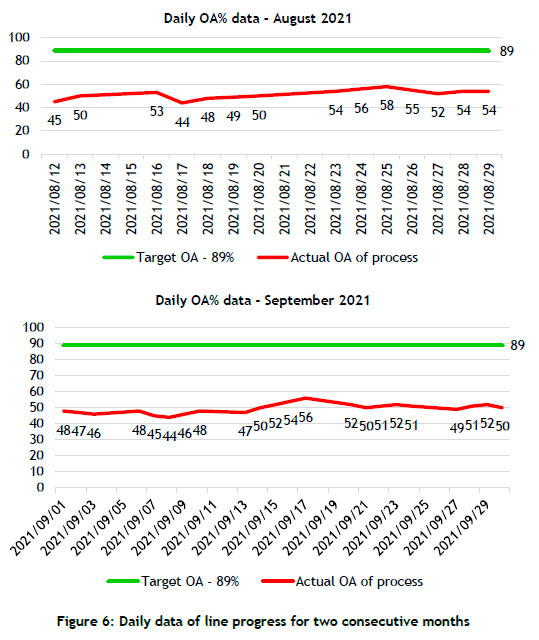
The use of calculated process standard times to balance the production process initially led to bottlenecks in certain processes. There were processes whose cycle times were below takt time, and other processes that were above it. On starting of production and analysing the line, it was found that the line was not able to meet the required score. Even with all of the manpower and material requirements present at the line side, the daily score could not be improved at this sew cover assembly line. Operational availability can be described as the percentage of time that the equipment or assembly line can operate properly when it is needed for production. The target OA of this particular line was set at 89%, while the actual OA was between 43% and 55%. This was the main cause of delays in the seat assembly process and of most of the downtime of the final assembly line.
Upon investigating the sew cover assembly line, it was found that the daily target OA was not being met. Two consecutive months of data were extracted, and are given in the graphs below, showing the score target per day, the planned and actual OA, and the daily trend of the OA that was achieved.
Further investigation of the line process and a video analysis of its elements revealed each process delay and bottleneck. The daily volume was set at 65 sets a shift, and the calculated takt time for the process was 399 seconds. Cycle checks were done at five cycles per process to give an indication of the bottlenecks in the processes. The cycle checks are summarised below in Figure 7, and a bar graph illustrates the bottlenecked processes. The processes above the takt time (line in dark blue) were the bottlenecked processes.
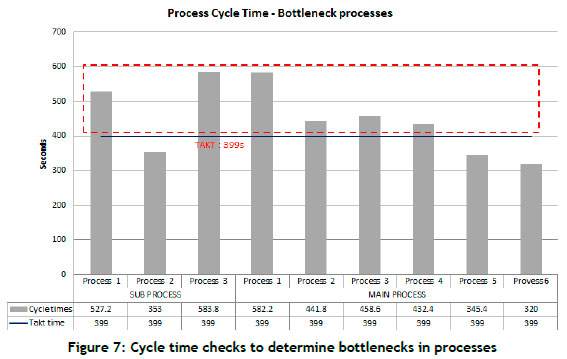
The largest candidate rule was used to calculate the balance delay. Here the assignment of work elements to stations was based on the amount of time required for each work element to be completed. The balance delay was calculated for above the line and is shown below. A "balance delay" can be described as the amount of time lost through imperfect balancing as a ratio. A balance delay of zero indicates a perfect balance.
The production line has nine stations (three in the front sub-line and six in the front main line). The work content time to assemble the cover before any improvement was 67.15 minutes (4 044.4 seconds). The production rate per hour was four units per hour. The proportion uptime = 0.89 and reposition time = 10 sec.
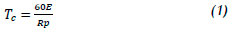
where Tc is the cycle time of the line in minutes/cycle, E is the line efficiency, and the constant 60 converts the hourly production rate to the cycle time in minutes.
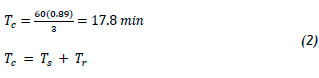
where Tr is repositioning time and Ts is service time
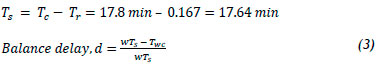
where w is the number of workers and Twc is total work content time
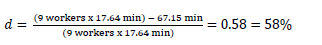
This calculation shows that the balance delay of this line was 58% a huge line imbalance.
5.2. Implementation of possible solutions, reduction of muda, and rebalancing
To balance the production line, we compared its productivity and efficiency before and after implementing the new rebalanced line for each process. A pattern description, the fabric types, and their colour were noted. The leather variant was chosen for this study, as this material type was the variant with a high work content. These new elements and cycle times were done at the process line side and with actual employees. These process cycle times were then used as a base-line for the improvement of the process. This was done to ensure that all processes and elements were accounted for when each process was being rebalanced.
Time studies were completed with the analysis of value-added, non-value-added, and muda identification. Value-added elements can be described as elements that directly add value to a part being assembled. Non-value-added elements need to be carried out so that the value-added elements can be completed, but do not add any value to the product being assembled. Non-value-added elements cannot be eliminated, but they can be reduced. Examples of non-value-added elements are picking up a screwdriver, leaving a wrench aside, etc. Muda can be described as "waste" that is part of a process. The elimination of waste in processes can have a substantial impact on manufacturing companies. By doing this, enhanced performance, improved delivery and quality, and reduced manufacturing costs are guaranteed. The most commonly identified muda in manufacturing are motion, transportation, defects, and waiting time.
The analysis of each process and its elements for value-added, non-value-added, and muda is summarised in the bar graph in Figure 8.
This information was then shared with all of the departments that were involved. This gave us as industrial engineers an overall view of the process and where we could begin the improvement strategies. In the non-value-added category, elements such as picking up a piece of material, cutting threads on a sewn item, and placing it to one side, were some of the elements for which cycle times could be reduced.
Other examples of kaizen were issuing new scissors to a worker to cut the threads of sewn items faster and arranging parts on the conveyor strategically so that the worker does not have to sift through items to find the pieces they need to assemble the cover. Elements such as turning around to pick up pieces, and creating process stands to keep parts near to each process to prevent the member from walking to fetch them, were other examples of improvements implemented. Machines were also moved closer together, and their orientation was changed to ensure that workers took fewer steps when picking up pieces from the process line.
With these new cycle times, elements were rebalanced and re-distributed between processes, taking into consideration the different machine types. Workers were placed at different work stations, based on the operational sequence, the experience of the operators, and the machine types; and a standard time for each station was given to line management. The line was rebalanced, and new elements were taken from time studies. The new balanced sewing assembly line is shown in Figure 9. With these small improvements, muda and non-value-added work was reduced, as the graph reveals.
The analysis of each process's cycle times before and after re-balancing is shown in Table 3. The processes highlighted in light red were the processes that were initially over takt and that were focused on. The cycle times after kaizen are also shown below, along the percentage of improvement for each process. This gives us a clear summary of the improvements to the line.
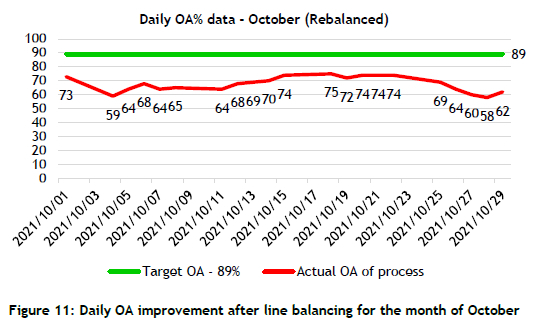
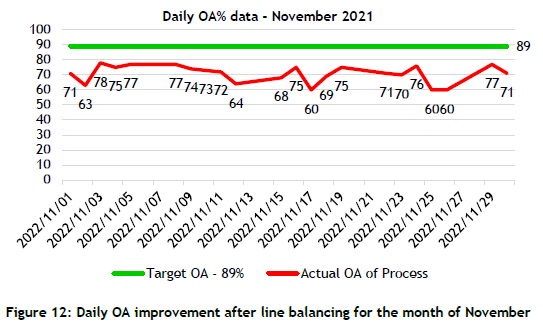
After full implementation on the process line side, the process was observed and the results for October, November, and December 2021 were tracked, as shown in the line graphs below. The process OA had increased by 20% after kaizen and rebalancing. Although the target OA was not met, continuous improvement would be done each week to achieve the target score.
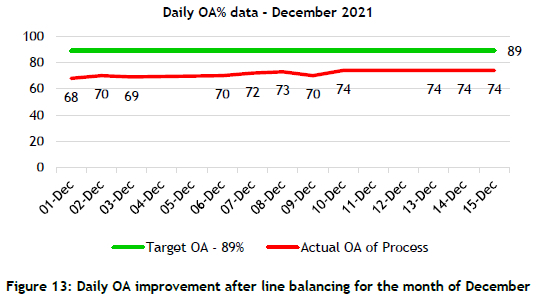
Only half of December was worked because of a scheduled shut down for plant maintenance. The new balance delay was calculated, and the new information and calculations are shown below. The production line has nine stations (three in the front sub-line and six in the front main line). The work content time to assemble the cover before any improvement was 59.70 min. The production rate per hour was six units per hour; the proportion of uptime was 0.89; and the reposition time was six seconds.
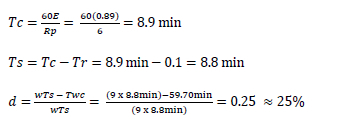
This calculation shows that the newly calculated balance delay was now at 25%. With continuous kaizen and the elimination of further muda in at each process, the balance delay could be decreased further.
6. CONCLUSION AND RECOMMENDATIONS
Bottlenecks in processes are one of the most common factors causing downtime and inefficiency in manufacturing processes and limiting throughput. Without an in-depth analysis of the process elements and a work study, it is often difficult to identify these bottlenecks and evaluate them. Line rebalancing often irons out these bottlenecks and ensures that there is a smooth flow of material from the start to the end of the production line. Line balancing does not just help a production line to meet its targets, but also assists in achieving a number of management objectives, including continuous improvement. In this case, the fishbone diagram and the associated investigation assisted in determining the other factors that played a role in the OA inefficiency. This is an improvement item that covers all aspects of a production line, and can be quite useful in production-related issues. When the line was rebalanced after identifying the bottlenecks, the balance delay was decreased by 33%, and the OA% was increased by 20%, thus reducing downtime on the final seat assembly line.
Even though the target OA was not reached, there are still many process improvement items to be continued to reach the desired OA. Work study analysis will continue, and non-value-adding and muda elements need to be reduced further as part of the continuous improvement process. Training is to be scheduled for each member on the sewing assembly line, and each member is to be evaluated based on skill, efficiency, and time. By doing this, the more experienced and trained operators will work on the assembly line, and achieving the desired OA of 89% will be much more achievable. Kaizen items such as work stands and work side tables are to be placed at the process to ensure that all of the parts required by each station are within reach of each member. A continual reshuffling of the process elements and simulation trials will be done to ensure that the process is structured efficiently and effectively.
REFERENCES
[1] S.V. Pandit, S.J. Kadam, A. Kharat, & C.U. Nayakawade, "Productivity improvement by application of line balancing", International Journal of Innovative Research in Science, Engineering and Technology, vol. 3, no. 4, pp. 11495-11502, 2014. [ Links ]
[2] H. Berhe, "Application of Kaizen philosophy for enhancing manufacturing industries performance: exploratory study of Ethiopian chemical industries," International Journal of Quality & Reliability Management, vol. 39, no. 1, pp. 204-235,2021. [ Links ]
[3] J. Bastos, et al., "Identifying bottlenecks in manufacturing systems using stochastic criticality analysis," in 2017 Forum on specification and Design Languages (FDL), 2017, pp. 1 -8 [ Links ]
[4] M. Tekin, M. Arslandere, M. Etlioglu, & E. Tekin, "An application of Kaizen in a large-scale business" Proceedings of the International Symposium for Production Research, vol. 1, pp. 515-529, 2018. [ Links ]
[5] M. Manaye, 2019 "Line balancing techniques for productivity improvement," International Journal of Mechanical and Industrial Technology, vol. 7, pp. 89-104, 2019. [ Links ]
[6] F.B. Talbot, J.H. Patterson, & W.V. Gehrlein, "A comparative evaluation of heuristic line balancing techniques," Journal of Manufacturing Technology Management, vol. 2, pp. 980-1012, 2005. [ Links ]
[7] M. Kamal, "Using fishbone analysis to investigate problems," International Journal of Mechanical and Production Engineering Research and Development, vol. 105, pp. 283-300, 2013. [ Links ]
[8] A. Jayswal, X. Li, A. Zanwar, H.H. Lou, & Y. Huang, "A sustainability root cause analysis methodology and its application," Computers and Chemical Engineering, vol. 1, pp. 53-67, 2011. [ Links ]
[9] D. Mahto & A. Kumar, "Application of root cause analysis in improvement of product quality and productivity," Journal of Industrial Engineering and Management, vol. 1, pp. 53-72, 2008. [ Links ]
* Corresponding author: 21509155@dut4life.ac.za
P. Govender: 0000-0003-0449-0492
M. Dewa: 0000-0002-0061-3654

