


Services on Demand
Article
 English (pdf)
 Article in xml format
 Article references
Indicators

Related links
-
 Cited by Google
 -
 Similars in Google
Share

 Permalink
South African Journal of Industrial Engineering
On-line version ISSN 2224-7890
Print version ISSN 1012-277X
S. Afr. J. Ind. Eng. vol.33 n.3 Pretoria Nov. 2022
http://dx.doi.org/10.7166/33-3-2803
SPECIAL EDITION
Using zero-waste baselines to identify compressed air system inefficiencies in deep-level mines
A. van der Merwe*; A.G.S. Gous; C.S.L Schutte
Department of Industrial Engineering, Stellenbosch University, South Africa
ABSTRACT
Inefficient compressed air systems in deep-level mines deteriorate energy performance and increase operational costs. Leaks, wastages, and misuse are common inefficiencies that necessitate an oversupply of compressed air. It is therefore important to identify where the opportunities for improvement are located. Underground mining equipment can be used to develop a zero-waste compressed air demand profile. This profile can then be simulated for the entire operation to determine a theoretical baseline. Noticeable inefficiencies are then identified by comparing the actual data with the zero-waste baselines. The results of this study showed that the surface operations oversupply compressed air by 15% (10 kg/s of air) per day. This requires an additional 80 MWh of electricity (14.5% of the total) and costs approximately R91 000 per day. The comparison with the zero-waste baselines showed that 7.9 kg/s of air is wasted at the underground levels during drilling periods, highlighting the areas that require mitigation projects to improve the performance while decreasing costs and wastages.
OPSOMMING
Ondoeltreffende saamgeperste lugstelsels in diepvlakmyne verswak energieprestasie en verhoog bedryfskoste. Lekkasies, vermorsing en misbruik is algemene ondoeltreffendhede wat 'n ooraanbod van saamgeperste lug noodsaak. Dit is dus belangrik om te identifiseer waar daar geleenthede vir verbetering is. Ondergrondse mynboutoerusting kan gebruik word om 'n geen-afval-aanvraagprofiel vir saamgeperste lug te ontwikkel. Hierdie profiel kan dan vir die hele operasie gesimuleer word om 'n teoretiese basislyn te bepaal. Opmerklike ondoeltreffendheid word dan geidentifiseer deur die werklike data te vergelyk met die nul-afval basislyne. Die resultate van hierdie studie het getoon dat die oppervlakbewerkings saamgeperste lug met 15% (10 kg/s lug) per dag oorvoorsien. Dit benodig 'n bykomende 80 MWh elektrisiteit (14,5% van die totaal) en kos ongeveer R91 000 per dag. Die vergelyking met die nul-afval basislyne het getoon dat 7,9 kg/s lug tydens boorperiodes op die ondergrondse vlakke vermors word, wat die gebiede beklemtoon wat versagtingsprojekte vereis om die werkverrigting te verbeter terwyl koste en vermorsing verminder word.
1. INTRODUCTION
1.1. Compressed air usage in the mining industry
Compressed air is widely used in the mining industry because of its effectiveness, variability, and relative safety in use [1], [2]. Compressors use electric energy, consuming up to 18% of the mine's total energy [3], to compress air into complex pipe networks supplying air where needed [2], [4]. The compressed air is then used for numerous mining activities on the surface and underground operations [3], [5], [6].
Table 1 summarises the compressed air users in the underground operations in a deep-level mine. The flow and pressure requirements indicated in the table below show the design specifications of the specified compressed air users. These indicate the conditions that would allow the equipment to operate with optimal efficiency.
Refuge stations are underground areas that are designated as emergency areas [7], and that require a constant flow of compressed air, based on their size, to keep the air pressure within the stations higher than the pressure outside them [3], [6], [7]. The positive pressure difference prevents air flow into the station from the surroundings. Workshops, however, do not require a constant flow of compressed air, since the air is used for tools that are operated briefly and only when needed [6].
Pneumatic rock drills are large tools that are used to drill holes in preparation for the blasting shift [6]. They are handheld and operated with a large amount of compressed air to drill holes in the hard rock panels. Pneumatic cylinders are used to open and close loading boxes and to load ore into ore-cars [3]. Track-bound mechanical loaders use compressed air to load rocks and ore into ore-cars [3], [6]. Pneumatic drills are used during the drilling shift, whereas pneumatic cylinders and mechanical loaders are normally used during the cleaning shift.
From Error! Reference source not found., it is evident that the compressed air demand relies heavily on t he compressed air users and the designated shift, since the majority of air is used by the air consumers listed in the table. Ideally, the demand should equal the supply, based on the law of mass conservation [8]. An ideal system would have no inefficiencies or wastages; therefore such a system could be defined as a zero-waste system [6]. However, as a result of various inefficiencies, the compressed air system needs to be oversupplied, wasting electricity and increasing operating costs.
The demand for compressed air should ideally be determined by the equipment used [8]. Therefore, in a zero-waste system, the equipment should be the only consumers of compressed air. Based on the equipment that is used, its specifications, and the time of use, one can determine a baseline indicating the lowest or ideal demand on the system [3], [6]. This baseline can be defined as a zero-waste baseline. Deviations from this baseline are then identified as inefficiencies and wastages in the system.
Electricity can account for up to 20% of a deep-level mine's operating costs [9], indicating that any increase in electricity usage can have detrimental effects on the profitability of a deep-level mine. Electricity tariffs have increased by 510% over the past 16 years [10], and are a major contributor to increasing operating costs [4]. To manage those increasing costs, mining companies have started implementing demand-side management initiatives to reduce electricity consumption where possible [4], [11].
Demand-side management initiatives are applied to electricity-consuming systems of deep-level mines [4], such as the compressed air system. Compressed air generation constitutes up to a fifth of a deep-level mine's electricity consumption [1], [9]. Reducing the electricity consumption of the compressed air system would directly reduce the mine's operating costs. To minimise the demand, inefficiencies such as leaks, open-ends, inefficient control, and use wastages should be identified, located, and rectified [6].
Furthermore, pressure drop occurs in the compressed air piping system because of friction and flow through bends and valves [12]. Mass flow inefficiencies also decrease the total available pressure in the compressed air system [6]. Therefore, identifying and locating inefficiencies would inevitably reduce compressed air demand and increase the available pressure for production activities.
1.2. Existing methods to identify inefficiencies
Current methods to identify and locate these mass flow inefficiencies in a compressed air network can be software-based or hardware-based [6]. Software-based methods use extensive datasets and data processing to identify the inefficiencies, whereas hardware-based methods require sensors, sampling, and surveys to identify them. Both methods can be time-consuming, expensive, and resource-intensive, and in some cases require special training [13].
Software-based inefficiency detection methods include a range of computing and computer-based processing [14]. These software-based methods can include formulas, monitoring, or even data analysis. Most of these use mass/volume balances, deep learning, or cross-correlation with available data to locate the inefficiencies [15]. Hardware-based methods normally require equipment to locate and identify the inefficiencies [14], [15]. The hardware that is used can be optical fibre, hydrophones, radar systems, and more; however, such equipment can be quite expensive to acquire and/or install.
A possible solution is to use simulation software to locate and identify the inefficiencies. This can be done accurately, at a relative low cost, and with fewer resources by using calibrated simulations (digital twins) [16]. The need for actual surveys, extra hardware, and continual data monitoring is then minimised.
1.3. Simulations and digital twins
A simulation is an artificial representation of reality that can be used to predict or explain certain situations or processes [17]. With this definition in mind, compressed air systems for deep-level mines can be simulated to predict or explain occurrences in the system [18]. Currently, simulations are used to identify opportunities for energy and operational improvements [16].
Simulations use mathematical and thermodynamic equations to calculate certain values, processes, or states dynamically [16]. Using actual values from measured data in these equations can then produce accurate answers that represent actual systems, forming the stepping stones to the creation of a digital twin [19]. However, simulations are often inaccurate owing to inadequate calibration and/or estimations being used instead of actual data for the calibration process [4]. It is therefore necessary to use actual data for the calibration process and to determine the accuracy of the simulation. The evaluation of a simulation's accuracy is measured with identified key performance indicators [20]. When the simulation is an accurate representation of the actual system, it becomes the digital twin used in the investigation [19].
Key performance indicators (KPIs) are quantifiable measures to compare the performance of strategic and operational goals [20]. KPIs can be used to define objectives and to measure success [20], [21]. Common KPIs focus on balancing the demand and supply of compressed air while establishing the impact of wastages, allowing for an increased focus on the specific underperforming areas that would benefit from improvements.
It is therefore necessary to develop a zero-waste baseline (1) to estimate the ideal demand, (2) to identify and quantify inefficiencies, (3) to isolate the areas with inefficiencies, and (4) to assess the potential benefits to be achieved.
1.4. Problem and objectives
The compressed air system of a deep-level mine contains many inefficiencies [22]. However, it can be time-consuming and resource-intensive and, in some cases, requires special training to identify these inefficiencies in a deep-level mine's compressed air system [13], given its complexity and scale. The objective of the paper is to use a zero-waste approach:
• to identify and quantify compressed air inefficiencies,
• to locate inefficiencies at a low cost and
• to identify savings initiatives and opportunities.
The method thus developed will be applied to a case study mine, using the most recent stoping and development plans and the most recent flow, pressure, and power data. Using the plans and crew information, an accurate zero-waste baseline can be developed and applied to the actual system to quantify the inefficiencies. With present flow and pressure meters, the various inefficient locations can be determined, and the effectiveness of the method can be determined with the simulation.
2. ZERO-WASTE BASELINE DEVELOPMENT
2.1. Approach to develop the zero-waste baseline
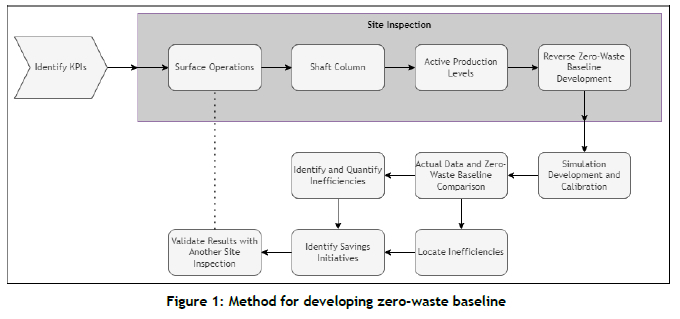
The method followed to identify the compressed air inefficiencies using a developed zero-waste baseline is shown graphically in Figure 1. From Figure 1, the first step is to identify the KPIs of the investigation. The next major step in the strategy to identify the inefficiencies is to do a detailed site inspection; 58his should include the surface operations, shaft column, active production levels [23], and the actual zero-waste baseline development.
The zero-waste baseline is an indication of the ideal compressed air consumption on a deep-level mine [3], [6], [8]. The zero-waste baseline should be developed from the equipment that is used and its time of use. The baseline will then be implemented in the calibrated simulation. The actual data will be compared with the zero-waste baseline to identify, quantify, and locate the inefficiencies with currently installed sensors.
The last two steps are to identify possible savings and initiatives and to validate the results by undertaking another site inspection. One method of validation will be to determine the accuracy of the calibrated simulation by comparing the performance with actual data, as an inaccurate simulation would render the results invalid.
2.2. Identifying key performance indicators
An important step in the process is to identify the important KPIs to be able to determine the actual performance of the simulation. Since the simulation is a significant factor in the entire method, the KPI identification can be defined as equally significant.
It is important that the KPIs be aligned with the objectives of reducing the compressed air wastages. Noting that the study's emphasis is on energy, mass flow, and pressure losses, the KPIs will be directly related to these.
The KPIs for the study were identified to be [1], [6]:
• Compressor power consumption, mass flow, and delivery pressure.
• Shaft mass flows and pressures.
• Underground level station mass flow and pressures.
• Identified flow and pressure where meters are available on each underground level.
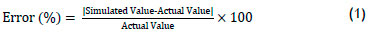
The accuracy of the simulation will be measured by comparing the performance of the KPIs of the simulation model with measured values. The error will be calculated with Equation 1:
2.3. Simulation setup and calibration
Next, a digital twin of the entire compressed air system is developed. This digital twin should consist of all the compressed air suppliers and consumers on the surface operations, shaft columns, and levels. The simulation calibration process is divided into four steps. These steps will assist in identifying inefficiencies in certain sections of the compressed air network by using the basic principle of mass conservation and the locations of currently installed flow and pressure meters. These steps are representative of the different areas indicated in Figure 2.
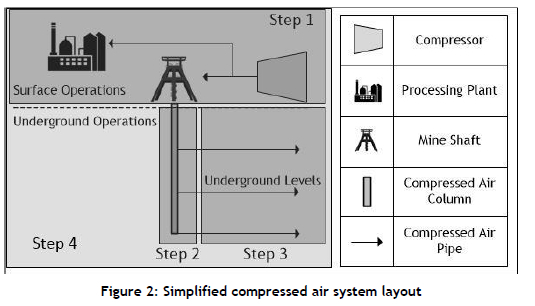
These steps, as represented in Figure 2, are:
Step 1 - Surface operations. First, the surface operations will be investigated. The most important of these is the calibration of the compressors. These simulated compressors should be accurate representations of the supplied flow, pressure, and power requirement of the actual compressors.
Step 2 - Shaft column. When the surface operations have been investigated and the simulation has been calibrated, the shaft column can be investigated. Shaft column losses should only be caused by friction losses and flow restrictions. Any other losses can then be identified as system inefficiencies. Any inefficiencies identified during this step will also indicate the various locations of these inefficiencies.
Step 3 - Active production levels. The shaft column then supplies the various levels with compressed air. The production levels consume air based on the equipment used, the amount of equipment used, and its time of use. The general equipment used on these production levels is indicated in Table 1. During this step, the proposed zero-waste baseline is developed, based on the equipment, time of use, and employee movement on the level.
Step 4 - Reverse zero-waste baseline development. The last step is to implement the zero-waste baseline in the entire operation. The zero-waste baseline is inserted as the demand on the various levels at the identified stoping and development areas. The simulation results are then compared with the actual performance of the operation. Using the results from the comparison, the inefficiencies can be identified and located.
2.4. Zero-waste baseline
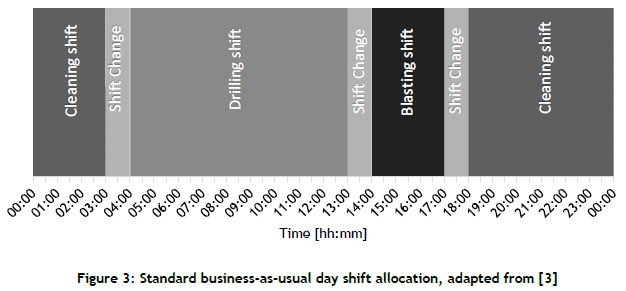
The zero-waste baseline will be developed on the basis of the specific requirements of the operations. An abundance of data and information is needed to be able to build an accurate zero-waste baseline that represents the operation's compressed air demand. According to [1], [3]-[6], the use of equipment is directly related to the time of day or shift. Figure 3 is a general indication of how the shifts are allocated in a normal business-as-usual day.
The highest pressure and flow demand is experienced during the drilling shift, when many pneumatic drills are used for stoping and development. The shift is also an indication of the number of workers underground, which is another indirect indication of the compressed air demand.
Normally, no mechanical loaders or pneumatic cylinders are used during the drilling shift. This is done to ensure that the available compressed air flow and pressure is used for the pneumatic drills alone. This increases drilling efficiency [7], and therefore miner productivity. However, some mines or mining levels continue to use other equipment during the drilling shift, depending on the availability of air and the type of work to be done.
Determining the location of active areas on each crosscut and the number of working crews would be necessary for calculating the demand of each level. So surveys will be done to determine the equipment used by each crew in each working area. This will then also be compared with data collected from each level.
3. IMPLEMENTATION ON CASE STUDY MINE
3.1. Case mine digital twin
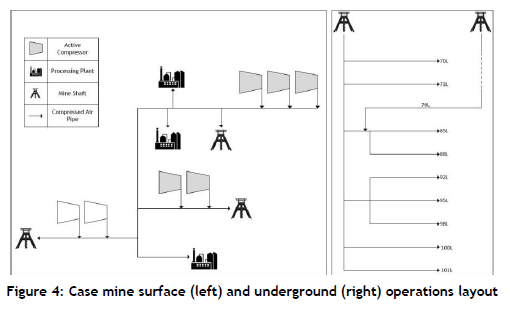
A site inspection is done at the case mine to understand the compressed air system. The system, as indicated in Figure 4 (left), consists of seven compressors feeding a large system consisting of three mining shafts and three processing plants. Only five of the compressors are used to feed the compressed air system. The mining shaft in question is also fed by another shaft on an underground level, as indicated in Figure 4 (right).
The digital twin is built by doing surveys of the entire system, including the surface and underground operations. These surveys are then used to build an accurate simulated representation of the actual system, and thus the digital twin. Data on the compressors, mining shafts, processing plants, and production levels was also gathered to calibrate the simulation.
3.2. Case mine zero-waste baseline
During the site inspection, the active production levels are identified. Further investigation into the active production levels reveals discrete working areas and allocated crews to each of the working areas. Table 2 summarises the findings from the site inspection. There are 10 levels in total that tap from the main shaft column. For three of these levels, either they are fed from another shaft, or the level valve is closed, preventing flow on to the level.
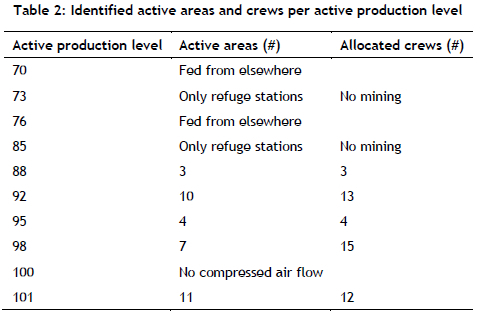
Two of the remaining seven levels only feed refuge stations, as no other mining activity is currently taking place on these levels. The last five levels have a total of 47 crews, divided into the different discrete working areas. These are further divided into stoping and development working areas. Development is done to enlarge the main haulage or crosscuts to a point where stoping starts. Stoping is mining done along the ore-containing vein.
It is determined by surveys and data collection that each working crew is given three pneumatic drills. And, using stoping and development plans, it is also determined where and how many loading boxes are used that require pneumatic cylinders. Last, it is also determined how many mechanical loaders are used on each of these levels.
4. RESULTS, VALIDATION, AND IDENTIFIED INITIATIVES
4.1. Simulation performance
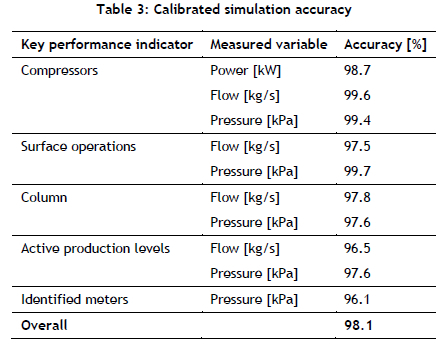
The entire simulation was calibrated, and the accuracy of the simulation calculated with Equation 1. The results are summarised in
Table 3. The entire simulation accuracy was 98.1%; so the results from the simulation could be presumed to be accurate and representative of the actual values and of how the system would perform. It could therefore be defined as a digital twin. The least accurate of the key performance indicators were the pressures taken from the ends of the production levels.
The simulation was calibrated using actual data on a business-as-usual day that was representative of the average performance of the system. Throughout the day, level-feed valves were controlled, based on the demand and on how much air the compressors supplied to the system. During the evening blasting shift, most of the valves were closed and fewer compressors were run, since no mining activity occurred during the blasting shift.
4.2. Surface operations
During the calibration of the surface operations simulation, it was discovered that the compressed air system was oversupplied by an average of 10.1 kg/s (855 tonnes per day) of air, which was about 14.5%. Figure 5 indicates the difference between the compressed air supplied to the system by the compressors and the measured demand.
To determine the amount of energy wasted with the lost compressed air, the following equation was used:

Using Equation 2, it was calculated that the system consumed 0.094 kWh to generate 1 kg of compressed air. Therefore, 855 tonnes of air consumed 80 MWh of energy to be compressed. This was the amount of energy wasted on the surface operations. Based on the April 2022 Eskom power tariff, the wasted energy was equal to about R 91 000 per day.
Using the digital twin, it was also determined that most of the losses occurred near the northern-most compressors. The location was determined by trial-and-error, by comparing the digital twin data with the actual data and finding the area where the data was the most accurate with the loss incorporated.
4.3. Shaft column
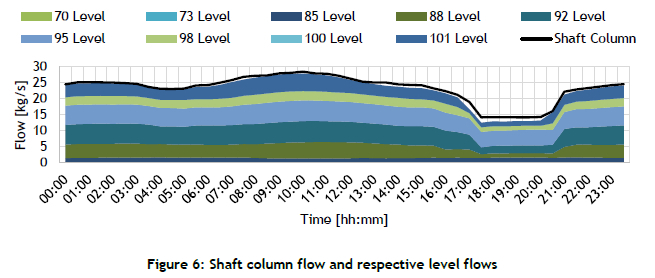
During the calibration of the shaft column, it was discovered that even more losses were occurring there, regardless of the surface operations. The shaft column was oversupplied by an average of 1.1 kg/s (95 tonnes per day) of compressed air, or by 4.6%. Figure 6 shows the flow into the shaft and the different levels' flows. The difference between the shaft flow and the sum of the level flows was the compressed air lost in the shaft column's compressed air column.
The amount of energy wasted in the shaft column alone was calculated to be 8.9 MWh per day, or R9 900 per day. Excluding the active production level, about 90 MWh of energy was wasted on the surface and the shaft column alone. This was a loss of R100 900 per day.
4.4. Active production levels
The method followed to determine the zero-waste baseline on each active production area was to determine accurately what equipment was used when and where on that specific level. Each level was investigated, and the equipment was noted along with its time-of-use. The air that was used more than proposed by the zero-waste baseline could be categorised as a loss to the system.
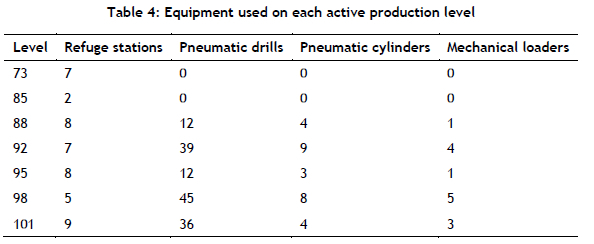
Table 4 summarises the equipment identified on each of the active production levels. Refuge stations consumed air throughout the day. Pneumatic drills were used during the drilling shift, from about 06:30 until about 12:00. Pneumatic cylinders and mechanical loaders were used during the cleaning shift and after the drilling shift but not during the drilling shift or the blasting shift. During shift changes, less equipment was used for a limited time.
A zero-waste baseline was developed for each of the active production levels, based on the location of the active working areas and the number of crews allocated to these working areas. Using the mine's missing persons locator data, the number of miners underground and on specific levels could be determined and used to determine when the compressed air could be decreased to the specific level.
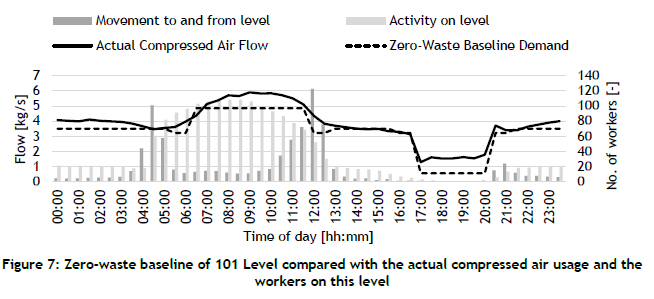
Figure 7 shows how the zero-waste baseline was developed and how it compared with the actual use of compressed air specifically on 101 level. The movement to and from the level, as well as the activity on the level, was indicated on the graph to assist with developing the zero-waste baseline. It can be clearly seen that, during the drilling shift, the activity on the level was very high, which correlates with the increase in demand for this period. During the blasting shift no miners were underground; therefore, the only compressed air to be consumed during this period should have been the refuge bays, which required a minimum pressure of 150 kPa.
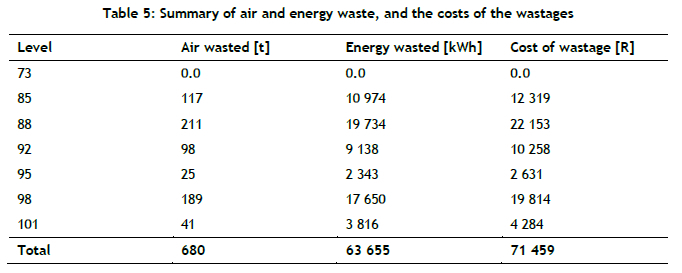
The same method was applied to all the levels. On each level, the air wasted, the energy wasted, and the cost of the wastages were calculated. 95 level and 98 level did not cut back during the blasting shift, even though no workers were underground. This, in turn, increased the compressed air wastages significantly on these levels. Most of the levels had open ends, especially near the hot areas, to increase ventilation and cooling. However, this wasted compressed air.
It was also determined that, on some of the levels, there were compressed air pipes that went through closed-off areas, but that the valves had not been closed. This wasted large amounts of compressed air, and was unnecessary. Using the zero-waste baseline, the wastages were quantified and located on each level.
In an ideal scenario, the system could use 63.7 MWh less energy, which in turn would save about R71 500 per day. The compressed air system would never be able to run at 100% efficiency; however, with the zero-waste baselines, the most troublesome levels could be identified, and the problems, leaks, and wastages rectified. It has previously been shown that at least 35% of energy is wasted as a result of compressed air leaks and inefficiencies [16]. It has also been calculated that improvements to compressed air efficiency could save between 30% and 40% of the total energy [16]. A mine should strive to run the system as close to ideal as possible, which would increase energy savings.
4.5. Reverse zero-waste baseline implementation
The final step in the process was to implement the zero-waste baselines in the entire system by inserting the baselines into the digital twin at the respective discrete working areas. This would then determine the demand required by the system, and the compressors would adjust the supply accordingly. This would ultimately determine what the actual energy savings could be if the system were run according to ideal performance.
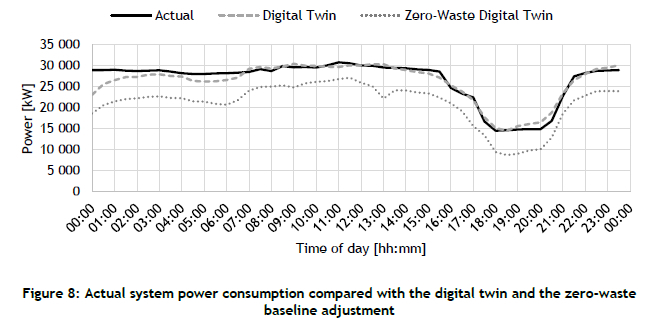
The zero-waste demand was inserted into the digital twin; the resultant power decrease can be seen in Figure 8. There was a decrease of 130.8 MWh (23.7%) per day if the system were to perform as indicated by the zero-waste baseline. It should be noted, however, that the energy saved was only on one shaft, and that there were two other shafts and three processings plants on the same compressed air system. The saved energy equalled R146 816.60 per day, which was being lost through wastages. Throughout the day, an average of 5 500 kW was wasted, indicating that an entire compressor could be switched off throughout the day, thus saving further maintenance, running, and labour costs. This would reduce the energy consumed by a further 13.2 MWh per day.
Given the lower demand on the levels, the pressure also increased at the production ends. This pressure increase ranged from 20 kPa to 50 kPa, without changing the setpoint on the level feed valve controllers. This could then be further increased with optimised level feed valve control.
However, it is recommended that flow meters and pressure meters be installed near active areas to determine on a more micro-scale where the air is wasted and where possible leaks are. The zero-waste baseline was able to locate most losses on the system on the respective levels; but without more flow meters, the precise area where the leaks are cannot be determined.
4.6. Savings initiatives
Eskom has a time-of-use tariff, which means that the tariff increases at certain times of the day [1]. During the evening blasting shift the tariff is higher than normal, which suggests that any cut-back on the compressed air would ensure more savings during this period. Furthermore, it was seen with the missing persons locator data that there is a period before the blasting shift when very few people are underground. If there is sufficient scope, the valves can be closed even earlier, saving more air and power.
Most compressed air leaks and inefficiencies are located in abandoned crosscuts, and these will remain a problem while no-one enters these crosscuts to find the leaks and inefficiencies. It is recommended that valves to the entry of these crosscuts be installed if further work in that crosscut remains possible; otherwise, the compressed air into that crosscut should be blanked off. This would reduce the area to be monitored and surveyed to ensure that leaks are fixed.
5. CONCLUSION AND RECOMMENDATIONS
Compressed air inefficiencies in deep-level mines could be successfully identified and quantified by using zero-waste baselines in combination with simulation software. Major savings opportunities were identified when the actual performance of the system was compared with the zero-waste baseline. Also, quantifying the wastages identified the most problematic areas, somewhat localising them.
The surface operations were the source of approximately 80 MWh of wastages; the shaft column was the source of 8.9 MWh of wastage; and on the levels, about 64 MWh of energy was wasted, with 88 level being the largest contributor, followed closely by 98 level. A total of 153 MWh of energy was being wasted in the deep-level mine. If the system were to perform ideally, the pressure at the production areas would increase as well, increasing drill performance and efficiency.
This method is suitable for quantifying the losses in a system and localising the problematic areas to a general area; however, with more meters on levels, the accuracy of the localised location of wastages could be improved. To ensure that the system performs better, the identified inefficiencies should be found and rectified. Thereafter, the system should be continually monitored to identify immediately when its efficiency decreases.
Further savings initiatives include level feed valve optimisation and time-of-use management, to increase the savings from power savings. This is emphasised because some of the levels do not have their flow reduced during the blasting shift, even though there are no workers on these levels during these times.
REFERENCES
[1] J. Taljaard, "Practical low-cost method to sustain mine compressed air savings," Master's Dissertation, North-West University, Potchefstroom, South Africa, 2019. [ Links ]
[2] J. Daugherty, "Using pressure power graphs to analyze compressor systems," Master's Dissertation, Tennessee Technological University, Tennessee, USA, 2020. [ Links ]
[3] L. Zietsman, "Novel solutions for compressed air demand management on deep-level mines,"PhD Thesis, North-West University, Potchefstroom, South Africa, 2020. [ Links ]
[4] J. Vermeulen, "Simplified high-level investigation methodology for energy saving initiatives on deep-level mine compressed air systems," PhD Thesis, North-West University, Potchefstroom, South Africa, 2018. [ Links ]
[5] J. Watkins, "Trade-off between simulation accuracy and complexity for mine compressed air systems," Master's Dissertation, North-West University, Potchefstroom, South Africa, 2019. [ Links ]
[6] D. L. du Plooy, "Development of a local benchmarking strategy to identify inefficient compressed air usage in deep-level mines," Master's Dissertation, North-West University, Potchefstroom, South Africa, 2019. [ Links ]
[7] P. de Villiers, "Reducing deep-level mine refuge bay compressed air consumption," Master's Dissertation, North-West University, Potchefstroom, South Africa, 2019. [ Links ]
[8] R. M. Felder, R. W. Rousseau, & L. G. Bullard, "Fundamentals of Material Balances," in Elementary Principles of Chemical Processes, 4th ed. New Jersey: John Wiley and Sons, 2016, ch. 4, pp. 83-186. [ Links ]
[9] J. H. Marais, "Evaluating the impact of energy management on deep-level mines during medium-term production stoppages," Master's Dissertation, North-West University, Potchefstroom, South Africa, 2021. [ Links ]
[10] Eskom, "Tariff history - Distribution," 2020. https://www.eskom.co.za/distribution/tariffs-and-charges/tariff-history/ (accessed Mar. 24, 2022). [ Links ]
[11] C. Monye i& A. Adewumi, "Integration of demand side and supply side energy management resources for optimal scheduling of demand response loads - South Africa in focus," Electr. Power Syst. Res., vol. 158, pp. 92-104, 2018. [Online]. Available: https://www.sciencedirect.com/science/article/pii/S0378779617305126. [Accessed: Apr. 13, 2022]. [ Links ]
[12] N. Feng, S. Cheng, H. Yu, W. Shi, X. Liu, & Q. Liu, "The flow and heat transfer characteristics of compressed air in high-pressure air injection wells," Arab. J. Geosci., vol. 11, no. 17, pp. 1-14, 2018. [ Links ]
[13] L.N. Zietsman, J.H. Marais, & W. Schoeman, "A practical method for compressed air leak localisation in deep-level mines," in AIUE Proc. 17th Ind. Commer. Use Energy Conf., Cape Town, 2019, ISBN 978-0-6399647-4-4. [Online]. Available: https://ssrn.com/abstract=3650457 or http://dx.doi.org/10.2139/ssrn.3650457 [ Links ]
[14] M.I.M. Ismail, et al., "A review of vibration detection methods using accelerometer sensors for water pipeline leakage," IEEE Access, vol. 7, pp. 51965-51981, 2019. [ Links ]
[15] M. Zhou, et al., "A pipeline leak detection and localization approach based on ensemble TL1DCNN," IEEE Access, vol. 9, pp. 47565-47578, 2021. [ Links ]
[16] B. Friedenstein, C. Cilliers, & J. van Rensburg, "Simulating operational improvements on mine compressed air systems," South African J. Ind. Eng., vol. 29, no. 3, pp. 69-81, 2018. [ Links ]
[17] N. Merchant, "Virtual experiments and simulations in the science classroom," Honors Thesis, Williams Honors College, Akron, Ohio, USA, 2019. [ Links ]
[18] S. J. Fouché, "Improving efficiency of a mine compressed air system," Master's Dissertation, North-West University, Potchefstroom, South Africa, 2017. [ Links ]
[19] L. Wright & S. Davidson, "How to tell the difference between a model and a digital twin," Adv. Model. Simul. Eng. Sci., vol. 7, no. 13, pp. 1-13, 2020. [ Links ]
[20] M. Jahangirian, S. J. E. Taylor, T. Young, & S. Robinson, "Key performance indicators for successful simulation projects," J. Oper. Res. Soc., vol. 68, no. 7, pp. 747-765, 2017. [ Links ]
[21] C. Cruz Villazón, L. Sastoque Pinilla, J.R. Otegi Olaso, N. Toledo Gandarias, & N. López de Lacalle, "Identification of key performance indicators in project-based organisations through the lean approach," Sustainability, vol. 12, no. 15, 5977, 2020. [ Links ]
[22] D. Nell, "Optimising production through improving the efficiency of mine compressed air networks with limited infrastructure," Master's Dissertation, North-West University, Potchefstroom, South Africa, 2017. [ Links ]
[23] J. G. D. Pretorius, "Optimising mine cooling system performance through monitoring and analysis," Master's Dissertation, North-West University, Potchefstroom, South Africa, 2019. [ Links ]
* Corresponding author: arno.vandermerwel998@gmail.com
ORCID® identifiers
A. van der Merwe: 0000-0001-5217-0915
A.G.S. Gous: 0000-0002-3195-1146
C.S.L. Schutte: 0000-0002-0119-720X

