


Services on Demand
Article
 English (pdf)
 Article in xml format
 Article references
Indicators

Related links
-
 Cited by Google
 -
 Similars in Google
Share

 Permalink
South African Journal of Industrial Engineering
On-line version ISSN 2224-7890
Print version ISSN 1012-277X
S. Afr. J. Ind. Eng. vol.33 n.3 Pretoria Nov. 2022
http://dx.doi.org/10.7166/33-3-2785
SPECIAL EDITION
Optimisation of promotions in the retail industry
H.E. Horden*; C. Bisset
Department of Industrial Engineering, North-West University, South Africa
ABSTRACT
Promotions are a powerful tool at retailers' disposal, but they are often underutilised. This happens when retailers select a suboptimal mix and pricing of vendor items to place on promotion. In this study, a mathematical optimisation model is developed that specifies the optimal mix and pricing of vendor items to put on promotion. First, a solution approach is formed by reviewing existing solutions in the literature, followed by the formulation of a mixed-integer nonlinear programming model. This model is expressed as an integer linear programming model to simplify its solving capabilities. Second, the model is verified by applying it to a retail dataset to confirm that the model is correctly formulated and coded. Last, the model is validated to test its scalability and computational abilities. The results show that the model is highly scalable. This implies that retailers can implement the model practically and effectively to increase the profit obtained from promotion events.
OPSOMMING
Promosies is 'n kragtige hulpmiddel tot die beskikking van kleinhandelaars, maar dit word dikwels onderbenut wanneer kleinhandelaars 'n suboptimale kombinasie en prysbepaling van verskafferitems kies om op promosie te plaas. In hierdie studie word 'n wiskundige optimeringsmodel ontwikkel wat die beste kombinasie en prysbepaling van verskafferitems om op promosie te plaas kan bereken. Eers word 'n oplossingsbenadering gevorm deur bestaande oplossings binne die literatuur te hersien, gevolg deur die formulering van 'n gemengde-heelgetal nie-lineere programmeringsmodel. Daarna word die model geverifieer deur dit op 'n kleinhandeldatastel toe te pas om te bevestig dat die model korrek geformuleer en gekodeer is. Laastens word die model bekragtig om die skaalbaarheid en berekeningsvermoe van die model te toets. Die resultate toon dat die model hoogs skaalbaar is. Dit impliseer dat kleinhandelaars die model prakties kan implementeer om effektief die wins wat uit promosiegeleenthede verkry word te kan verhoog.
1. BACKGROUND
The value of retail promotions is well-known. The marketing mix is a collection of strategies that companies use to market their brand(s). These strategies are associated with the marketing-mix variables of product, price, place, and promotion. Promotions can substantially increase short-term sales [1] and cause an influx of in-store traffic [2]. Promotions are the most critical factor affecting product sales among all the marketing-mix variables [3]. As such, they form the core of marketing-mix decisions [4]. This is reflected in the significant portion of marketing-mix budgets that retailers allocate to conduct promotions [5]. The harmful aspects of promotions, however, are less well-known.
Ailiwadi et al. [6] conducted a prize-winning study in which they quantified the profit impact of every promotion offered in 2003 by CVS, a large drug retailer based in the USA. They found that 50% of promotions are not profitable because the lower profit margins on promotional items are not sufficiently offset by the funding provided by vendors to conduct promotions. In addition, by eliminating promotion events in 15 of the worst-performing product categories, CVS would lose $7.8 million in sales but increase its overall profit by about $52 million.
Over-promotion, which occurs when a retailer conducts promotions too often, can also hurt their bottom line. The next paragraph describes the phenomena that can be exacerbated if an item is over-promoted or if a retailer over-promotes its products.
Promotions have a saturation effect. Consumers tend to stockpile products during promotional events. Repeat purchases tend to drop following promotions [6]. Promotions can change customers' reference prices of a product [7]. Customers might be less likely to purchase an item whenever it is not promoted. Finally, promotions might alter the image of a retailer or the image of a promoted brand.
Retailers should take great care to ensure that promotional margins are sufficiently offset by vendor funding, and that promotions are spaced out sufficiently to prevent over-promotion. The question thus arises: how are retailers currently planning promotions such that these factors are taken into account?
In most supermarket chains, promotion planning is done manually using informal heuristics [8]. This makes decision-making arduous, over-reliant on managerial experience, and prone to human error. Furthermore, by using such methods, retailers frequently select a mix and pricing of vendor items to place on promotions that will not result in the optimal profit being obtained.
There is a clear need for a method that can assist retailers with promotion planning. This study presents a mathematical optimisation model that specifies the optimal parameters of vendor items to place on promotion, and that takes into account the effects of vendor funding and over-promotion.
2. RELATED WORK
Studies that aimed to optimise promotion planning are reviewed to identify possible solution approaches. Key aspects that must be identified in related works include the type of data used in the study, the main deliverable of the study, the nature of the demand module incorporated in the study, whether the study accounts for vendor funding, and whether the study includes optimisation features. In this section, six studies that aimed to optimise promotion planning are identified.
Van Heerde et al. [9] developed a semi-parametric model that uses store-level scanner data to estimate sales based on promotion depth and the level to which the promotion is advertised to consumers. Their model Indicated an s-shaped relationship between item sales and discount depth. This s-shaped deal-effect curve is visualised in Figure 1.
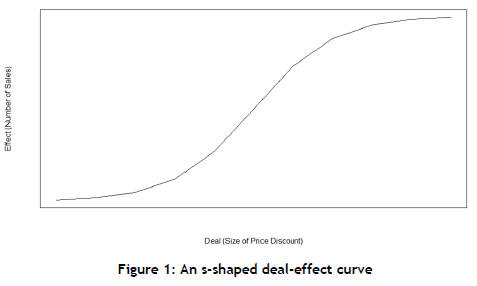
An s-shaped deal-effect curve implies the existence of two phenomena. First, there is a minimum discount depth below which customers are unlikely to change their buying behaviour - a threshold effect. Second, there is a maximum discount depth at which the sale rate of promotional items no longer increases with the increase of discount size - a saturation effect. As Van Heerde et al.'s [9] model predicts sales for multiple periods, the combination of the threshold and saturation effects encompasses the effects of stockpiling. Their model does not, however, include the effects of vendor funding, nor does it have any optimisation features.
Guadagni and Little [4] developed a multinomial logit model that predicts sales as a function of brand and size loyalty, the binary presence of promotions, the regular retail price, and customer purchase history. The study assumes an s-shaped deal-effect curve. Their model was validated using panel data - that is, data from individual customers' purchase histories. The model does not account for discount size nor for the effects of vendor funding, and it does not have any optimisation features.
Tellis and Zufreyden [10] sought to find the optimal timing and depth of retail discounts under various circumstances. They developed a nonlinear programming model that maximises promotional profit. Again, the authors assumed an s-shaped deal-effect curve. The model was validated using a simulated store-level data set. Their model was shown to output effectively the optimal timing and depth of retail discounts over multiple brands and periods. Their model did not factor in vendor funding.
Ma and Fildes [11] developed a decision-support system that is capable of maximising multi-period category profits. They first developed an autoregressive distributed lag model to model retail sales, and then incorporated the model in a linear programming model that specifies the optimal mix and pricing of promotional items. Their demand model resulted in an exponential deal-effect curve, while their linear programming model output the parameters that would result in the maximum category profits being obtained.
Cohen et al. [8] also aimed to specify the optimal timing and depth of price discounts. The authors proposed an exponential demand model, based on store data, that notably captures promotion fatigue from stockpiling events. The demand model was then incorporated in a linear programming model that maximises promotional profit. The study did not take vendor funding into account.
The scopes of the mentioned studies are summarised in Table 1, which indicates that, although numerous studies have aimed to optimise promotion planning, none of them includes the effects of vendor funding while simultaneously incorporating optimisation features.
Guadagni and Little [4] indicated that vendor funding plays a major role in the profitability of retail promotions. The model developed during the current study outputs the optimal parameters of retail promotions, given vendor funding. This makes the study highly significant in the field.
3. LITERATURE STUDY
This literature study explores two topics. The first is the relevance of demand models to this study - that is, the existing models that predict retail sales, and how they could be incorporated into this study. The second topic delves into the various mathematical optimisation methods that exist.
3.1. The relevance of demand models to this study
Modelling demand in retail settings is complex. Demand can differ, depending on a host of factors, such as retailer location, product category, and an item's level of display. Furthermore, the true nature of the relationship between an item's price and its rate of sale is unknown [5].
Numerous attempts have been made to model demand in retail settings. Among these, AC Nielson's SCAN*PRO model is the best-known [12]. The SCAN*PRO model was created to assist retailers with making marketing-mix decisions. The model predicts the impact that a product's price, its competitor's price, and its display level will have on its sales.
Blattberg and Wisniewski [13] developed another well-known demand model, commonly known as the 'B&W model'. Its main purpose is to show how price changes influence observed patterns of brand competition.
Van Heerde et al.'s [9] demand model is discussed in Section Error! Reference source not found.. The a uthors benchmarked their model against the SCAN*PRO and B&W models, and found that their model resulted in a smaller weighted average. The results from their benchmark analysis are summarised in Table 2. Note that the mean square error of the Scan*Pro and B&W models are shown relative to the mean square error of the semiparametric model.
Van Heerde et al. [9] found that there is an s-shaped relationship between an item's price and its rate of sale. This finding is well-supported by Blattberg et al. [5]. An s-shaped relationship between an item's price and its rate of sale implies a saturation and a threshold effect. The gradual slope on the left-hand side of the curve shown in Figure 1 portrays the threshold effect. Once the threshold has been passed, the number of sales increases rapidly as the size of the discount increases. A saturation point is ultimately reached, and the slope levels off once again. At this point, the number of sales no longer increases as the size of the discount is increased.
The choice of a demand model is crucial to ensure that the optimisation model accurately captures customer behaviour. For this reason, it is recommended that the demand model be based on historical sales data, if available.
3.2. Background to optimisation methods
Optimisation methods allow for the selection of the best alternative in the sense of a given objective function [14]. Mathematical optimisation is an extensive subject; however, it was determined that similar studies relied on linear and nonlinear programming to optimise retail promotions. Thus, only linear and nonlinear programming methods are explored in this study.
Linear programming is an optimisation technique to determine the values of decision variables that maximise or minimise a linear objective function, subject to linear constraints [14].
The standard form of a linear programming problem is
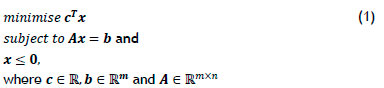
The use of linear programming to solve business problems has precedence. Jain et al. [15] used this method to maximise the Central Bank of India's net return from loans. Akpan [16] used this technique to optimise the use of raw materials in a bakery. Lidia [17] used linear programming to help companies to make fixed-asset acquisition decisions. This technique is well-established, and has been used in many applications.
Numerous algorithms have been invented to solve linear programming problems. These include Khachiyans's method, the affine scaling method, and Karmarkar's method [14]. The simplex method, however, is the most popular, primarily owing to its efficiency. The simplex method works by moving progressively from a position of zero production and zero contribution until no further contributions can be made. A feasible solution is produced at each step, and each solution is more optimal than the one before it [18].
If all the unknown variables of a linear programming problem are required to be integers, the problem is called an integer linear programming problem. If only some of the unknown variables are required to be an integer, the problem is called a mixed-integer programming problem. Integer and mixed-integer programming problems are much harder to solve than their continuous counterparts [19].
The branch-and-bound method is commonly used to reduce the solving time of such problems. The method involves separating the problem into relaxed sub-problems and fathoming the optimality of the solutions obtained for each sub-problem [20].
Nonlinear programming problems are those in which the objective function or some of the constraints are nonlinear. Most nonlinear programming problems are NP-hard [21]. Some methods can solve nonlinear programming problems in a reasonable time; however, approximating a linear equivalent to a nonlinear problem remains a popular solution approach [22].
4. MATHEMATICAL MODEL DEVELOPMENT
The literature review indicated that a demand model can be incorporated into a linear or a nonlinear programming problem to create a tool that can help retailers to optimise promotion planning. The same approach is followed to create a mathematical model that specifies the optimal mix and pricing of vendor items that a retailer should place on promotion. This section documents the development of the potential mathematical model.
This section consists of three subsections. The model's notation and assumptions are described in the first subsection; the nonlinear formulation of the optimisation model is described in the second section, and a linear approximation to the optimisation model is described in the third section.
4.1. Notation and assumptions of the mathematical model
The following indices were used:
iEl is the index of items in a single product category.
t ET is the index of periods for which the retailer wants to plan promotions.
k E K is the index of permissible prices an item may assume.
The following input variables were used:
clt is the cost of item i at time t.
Rit is the rebate received for promoting item i at time t.
qoit is the regular sale price of item i at time t.
qkit is the kth permissible price item i may assume at time t such that q0it > q1it > - > qkit.
Li is the maximum number of times that item i may be placed on promotion throughout the planning horizon.
LTotal is the maximum number of promotions that may take place.
The binary decision variable xkit is equal to 1 if item i should be sold at the price qkit at time t. The demand for product i at time t, if it is sold at the price qkit, is given by the function dit(qkit). Note that the demand for a product is independent of the period in which it is sold.
Finally, it was assumed that:
1. The model would be applied to one product category at a time.
2. The retailer would carry enough stock to meet demand.
3. A rebate was the percentage of an item's cost paid back to the retailer if they discounted an item sufficiently below its selling price.
4.2. Nonlinear formulation of the optimisation model
The approach proposed by Cohen et al. [8] was adapted to allow for multiperiod promotion planning and the inclusion of vendor-driven rebates. The objective of the proposed mixed-integer nonlinear programming model was to maximise

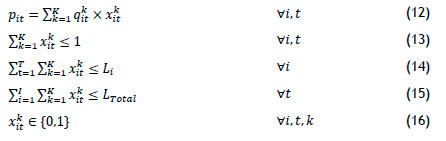
subject to the constraints
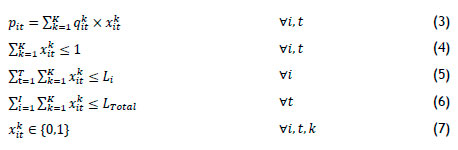
The objective function (2) maximises the profit gained throughout the planning horizon, given the demand associated with selling an item at a specific price. Constraint (3) allows an item's price at each point in time to be expressed as a value from its matrix of permissible prices. Constraint (4) ensures that an item has, at most, a single price at each point in time. Constraints (5) and (6) are added to prevent over-promotion. Constraint (5) ensures that item i is placed on promotion no more than Li times throughout the planning period, while constraint (6) ensures that the maximum number of promotions is not exceeded. Constraint (7) ensures that xkit is binary.
4.3. Linear formulation of the optimisation model
Nonlinear programs are harder to solve than their linear counterparts [22]. In addition, most optimisation software can only solve special instances of nonlinear programming problems. Thus the decision was made to linearise the optimisation model.
The linearisation method proposed by Cohen et al. [8] was followed. The method eliminated the need for an online demand model by incorporating an additional matrix of constraints that considered the demand for each item at each price. This method is illustrated in Figure 2.
The method was applied to the nonlinear programming model. The profit gained by selling item i at its regular selling price at the time t is:
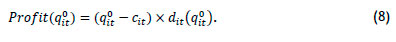
For every other permissible price, qkit, the profit obtained by selling item i at time t is:

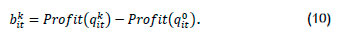
The unilateral deviation in profit obtained by applying a single promotion, bkit, is:
Since equations (8), (9), and (10) can be computed offline, they do not add to the complexity of the model. An integer linear programming formulation of the optimisation model is obtained by maximising the unilateral deviation in profit obtained by applying a single promotion.
In other words, the objective of the linear optimisation model is:

subject to the constraints
Each constraint of the linear formulation serves the same purpose as its nonlinear counterpart.
5. VERIFICATION OF THE MATHEMATICAL MODEL
In the previous section, an integer linear programming model is proposed that specifies the optimal mix and pricing of items a retailer should place on promotion at different periods. In this section, the model is verified by applying it to a true retail dataset. The model is considered correct if it results in a feasible and meaningful solution. In this section, a description of the dataset, the demand model, and the model's variables is given. This is followed by a discussion of the results from the verification run.
5.1. Data description
The model was applied to a store-level dataset. The dataset was extracted from the Dominick's Finer Foods database, which is maintained by the Kilts Center for Marketing at the University of Chicago's Booth School of Business. The dataset is included in the R foayesm-package [23].
The dataset recorded the sale of seven major canned tuna brands in a single retailer over 338 weeks. Also included was the weekly level of display, price, and wholesale price of each brand. However, the dataset did not contain rebate data. Thus the rebate variable was omitted from this run of the model. Data processing was done using the R programming language [24].
An attempt was made to optimise retail promotions for three products: Starkist (Product 1), Chicken of the Sea (Product 2), and Bumblebee (Product 3), over a four-week planning period. These values were chosen arbitrarily.
The following parameters were therefore defined:
5.2. Modelling of demand
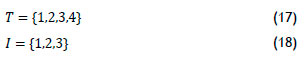
The data from the first year was modelled to reduce variation caused by time-based effects. Similarly, only data from Products 1, 2, and 3 was modelled to reduce variation caused by cross-item effects. The number of sales and the selling price of each item during the first year were combined into two arrays, sales and price, respectively. The data points that were modelled are plotted in Figure 3.
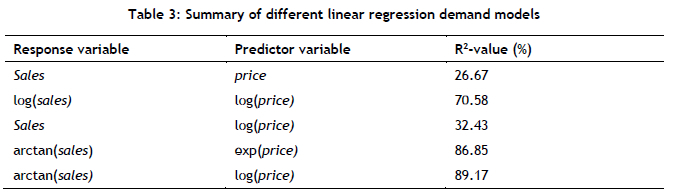
Figure 3 indicates no discernable relationship between item sales and item price. Different linear transformations were therefore applied to the data. Least-squares regression models were then fitted. The best fit among these was the one that resulted in the largest suitable R2-value, and it was chosen to represent dit. For the general case, however, a retailer could explore any statistical learning method that accurately models demand. A summary of each fit is shown in Table 3.
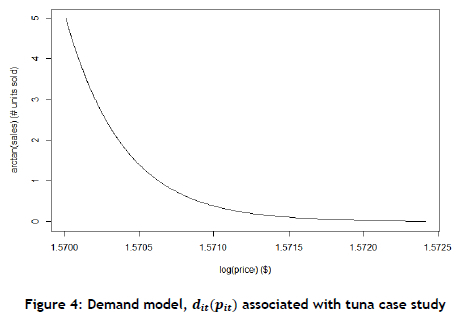
The arctan-log transformation resulted in the largest R2-value (98.17%). This was a relatively high R2-value, which implied that the model accurately predicted item sales as a function of the item price. The least-squares fit of this transformation is:

Equation (19) can be rewritten to obtain the demand model:

The demand model is illustrated in Figure 4.
5.3. Defining model variables
The wholesale price of each item during each week was extracted from the dataset. Each value was stored in the 3x4 variable cit. Similarly, the regular selling price of each item during each week was extracted from the dataset and stored in the 3x4 variable q0it.
For each iteration of i and t, the variable qkit was defined as a sequence from 0 to 1.78 in increments of 0.02. The values of qkit, which were higher than item i's regular price at time t, were replaced with null. This forced the model to select only prices below its regular selling price - i.e., promotional prices.
No limitations were placed on the maximum number of promotions that could take place - i.e., Lt = oo and Lrotal = oo. The remaining variables, Profit(q°it), Profit(qkit), and bkit, were finally calculated. The variable bkit, was used as input to the optimisation model.
5.4. Results from verification run
The problem was configured in IBM CPLEX. A feasible solution to the problem was obtained in 2.02 seconds. In each case, the model selected promotions. This indicated that the retailer might need to take special care when selecting Li and LTotal values to prevent over-promotion. The results from the verification run are summarised in Table 4.
The left side of Table 4 indicates the non-zero decision variables, while the right side indicates the corresponding price of each non-zero variable.
The verification run resulted in an objective value of $506,325.71. The theoretical profit obtained by selling each item at its regular selling price throughout the planning period was $24,863.35. If promotions were applied as the model suggests, the total theoretical profit would be $531,189.10 (refer to Equation (11)). The true profit that was obtained by selling each item at its regular selling price throughout the planning period was $145,328.80. This meant that the model theoretically increased the profit by 265.52%.
The true profit increase that might follow from applying the model was expected to be significantly lower than this number. The theoretical increase was misleading, because it assumed that the demand model was 100% accurate, which would likely never be the case. The demand model does not account for overpromotion, nor for the market share each brand owns, nor for vendor funding effects. To benchmark this solution effectively, the retail data before and after it had been implemented by a retailer would be required. This fell outside the scope of this study.
Regardless, a feasible and meaningful solution to the problem was obtained. The model was therefore considered correct.
6. VALIDATION OF MATHEMATICAL MODEL
In the previous section the proposed model was verified as correct. In this section, the effectiveness of the model is validated in respect of its computability and scalability. This is tested by systematically increasing the number of model variables.
This section has two subsections. In the first, a description of the simulated dataset used to validate the model is given; and in the second, a discussion of the results from the validation run is provided.
6.1. Description of the simulated dataset
A simulated dataset was used, as its parameters could be easily varied. The dataset was simulated using the R programming language [24]. The computation time and percentage increase in profit (relative to the total theoretical profit) were recorded during each run. The simulated dataset recorded the store data of a single product category over four weeks - i.e., T = {1,2,3,4}. Initially, product costs were generated randomly using a U(250,300) distribution. Vendors specified costs quarterly. The percentage change in a product's cost each quarter was generated randomly using a U(-15,15) distribution. The retailer had a regular price margin of 30%. There was a 10% chance that a vendor would provide a rebate if a product were sold at 15% or more below its regular price. The rebate values were between one and five per cent of an item's cost price. This percentage was generated randomly using a U(1,5)-distribution.
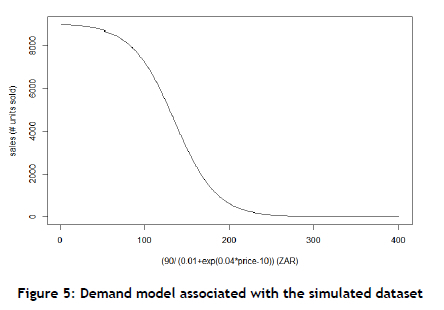
The demand for product i at time t if it is sold at the price pit is:

The demand model is shown in Figure 5. Note that it is s-shaped. This implies a threshold and saturation effect. Once again, no limitations were placed on the number of promotions that could take place.
The number of variables was increased by increasing the number of items included in the problem formulation. The choice between increasing the number of items and increasing the number of periods was arbitrary; both would increase the number of model variables. The same was true for decreasing the interval size of K. Varying the effect of each model parameter was therefore redundant.
6.2. Discussion of results
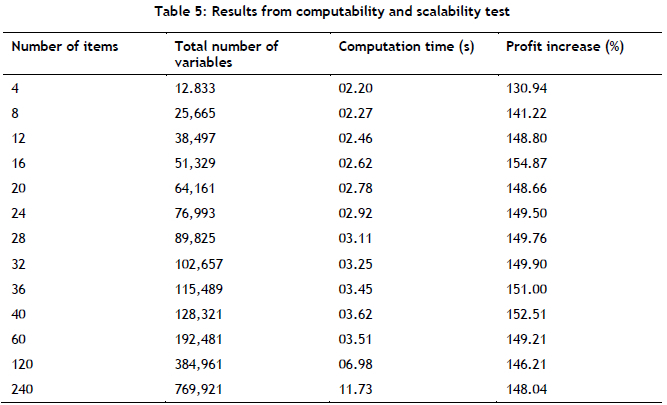
The results from the experiment are summarised in Table 5.
Note how the inclusion of each new item introduced 3,209 new variables to the model. This was because of the multidimensional nature of the variables. The total number of variables in the model is given by Equation (22).

This equation is important, as some solvers allow a limited number of variables and constraints. Retailers should thus consider this equation when selecting intervals of /, T, and K.
The results from the experiment are more telling when they are shown in graphic form. Figure 6 is a plot of computation time vs the number of items included in the problem formulation.
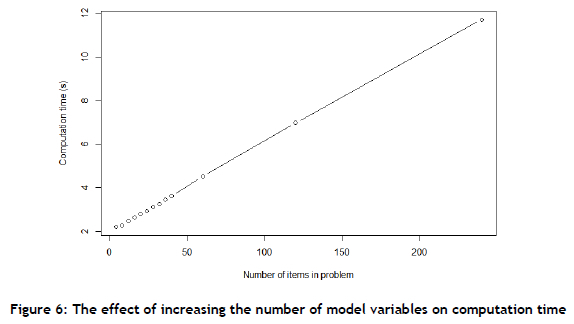
Remember that an increase in the number of items is analogous to an increase in the other model parameters. It can therefore be concluded that the model is highly scalable with respect to computation time.
Figure 7 is a plot of profit increase vs the number of items included in the problem formulation.
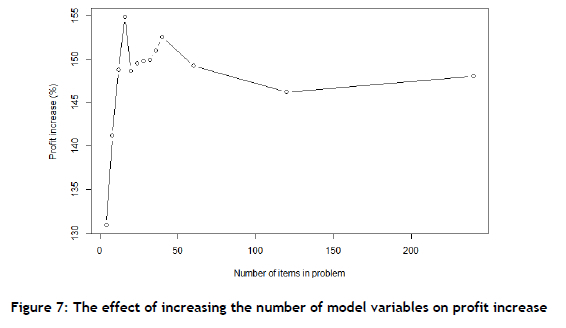
The percentage profit increase initially increases rapidly as the number of items increases. This increase peaks when 16 items (51,329 total variables) are included in the problem formulation. After this point, the percentage profit stabilises around approximately 148%, regardless of the addition of new variables. This shows that the model is highly scalable with respect to the percentage profit increase. The model can therefore be implemented in practice by retailers.
7. SUMMARY AND CONCLUSION
In this section, a summary of the project is given, future recommendations are made, and a conclusion is given.
7.1. Project summary
Retailers frequently underuse promotions by not selecting the optimal mix and pricing of vendor items to place on promotion. This is partly because retailers rely on informal heuristics to design their promotions. While there are studies that aim to optimise promotion planning, no study that includes optimisation features provides for vendor funding, which significantly influences the profitability of retail promotions. This study aimed to solve this problem.
A solution approach was formed through a literature study. A nonlinear mixed-integer programming model was developed that incorporated a demand model to output the optimal mix and pricing of vendor items that a retailer should place on promotion. A linear integer approximation of this model was formulated to make it easier to solve. The integer linear programming model was applied to a true retail dataset. The results were feasible and meaningful, and the model could therefore be considered correct. Finally, the model was validated and shown to be highly scalable.
7.2. Future recommendations
This study only considered demand as a function of price. Retail demand, however, depends on a host of variables. Modelling retail demand, therefore, becomes exceedingly complex.
There is much room to explore how the demand model could be developed. For example, its scope could be expanded to include cross-promotional and stockpiling effects.
It could also be made to account for the market share that each brand owns and the seasonal factors that affect product demand at different points in time.
The performance of the optimisation model could be significantly improved by improving the accuracy of the demand model. Finding ways to do so would thus be a challenging but crucial task for future researchers.
In addition, many vendor funding strategies exist. This study assumed a simplified rebate system. The model could be expanded to include multiple rebate systems to increase its effectiveness in optimiseing promotion planning.
Retailers might also consider promoting perishable items that are nearing their expiration dates, regardless of demand. This allows retailers to reduce the losses from spoiled inventory. Thus, the optimisation model could be expanded to distinguish between perishable and non-perishable goods.
Finally, in its current state the optimisation model requires specialised skills and software to be solved. However, few retailers possess the resources needed to apply this model. Thus, the possibility of incorporating this model into an enterprise resource planning system could be investigated.
7.3. Conclusion
The business world creates many opportunities for mathematical optimisation. The retail sector in particular is especially primed for such methods, thanks to the abundance of store data collected by point-of-sale systems. This study found that many retailers fail to exploit these circumstances and, in doing so, fail to grow their bottom lines. The hope, therefore, is that this study would emphasise the importance of applying industrial engineering practices in the retail sector.
REFERENCES
[1] A. G. Woodside & G. L. Waddle, "Sales effects of in-store advertising," Journal of Advertising Research, vol. 15, no. 3, pp. 29-33, 1975. [Online]. Available: https://nwulib.nwu.ac.za/login?url=https://search.ebscohost.com/login.aspx?direct=true&db=bth&AN=5228272&site=eds-live. [ Links ]
[2] R. G. Walters, "Assessing the impact of retail price promotions on product substitution, complementary purchase, and interstore sales displacement," Journal of Marketing, vol. 55, no. 2, pp. 17-28, 1991, doi: 10.1177/002224299105500203. [ Links ]
[3] D. Sunoo & L. Y. S. Lin, "Sales effects of promotion and advertising," Journal of Advertising Research, vol. 18, no. 5, pp. 37-40, 1978. [Online]. Available: https://nwulib.nwu.ac.za/login?url=https://search.ebscohost.com/login.aspx?direct=true&db=bth&AN=6630052&site=eds-live. [ Links ]
[4] P. M. Guadagni & J. D. C. Little, "A logit model of brand choice calibrated on scanner data," Marketing Science, vol. 27, no. 1, pp. 29-48, 2008, doi: 10.1287/mksc.1070.0331. [ Links ]
[5] R. C. Blattberg, R. Briesch, & E. J. Fox, "How promotions work," Marketing Science, vol. 14, no. 3_supplement, pp. G122-G132, 1995. [Online]. Available: https://EconPapers.repec.org/RePEc:inm:ormksc:v:14:y:1995:i:3_supplement:p:g122-g132. [ Links ]
[6] K. L. Ailawadi, B. A. Harlam, J. César, & D. Trounce, "Quantifying and improving promotion effectiveness at CVS," Marketing Science, vol. 26, no. 4, pp. 566-575, 2007, doi: 10.1287/mksc.1060.0245. [ Links ]
[7] R. N. Bolton, "The relationship between market characteristics and promotional price elasticities," Marketing Science, vol. 8, no. 2, pp. 153-169, 1989, doi: 10.1287/mksc.8.2.153. [ Links ]
[8] M. C. Cohen, J. J. Kalas, & G. Perakis, "Promotion optimization for multiple items in supermarkets," Management Science, vol. 67, no. 4, pp. 2340-2364, 2020, doi: 10.1287/mnsc.2020.3641. [ Links ]
[9] H. J. van Heerde, P. S. H. Leeflang, & D. R. Wittink, "Semiparametric analysis to estimate the deal effect curve," Journal of Marketing Research (JMR), vol. 38, no. 2, pp. 197-215, 2001, doi: 10.1509/jmkr.38.2.197.18842. [ Links ]
[10] G. J. Tellis & F. S. Zufryden, "Tackling the retailer decision maze: Which brands to discount, how much, when and why?" Marketing Science, vol. 14, no. 3, pp. 271-299, 1995, doi: http://mktsci.journal.informs.org/content/by/year. [ Links ]
[11] S. Ma & R. Fildes, "A retail store SKU promotions optimization model for category multi-period profit maximization," European Journal of Operational Research, vol. 260, no. 2, pp. 680-692, 2017, doi: 10.1016/j.ejor.2016.12.032. [ Links ]
[12] H. J. van Heerde, P. S. H. Leeflang, & D. R. Wittink, "How promotions work: SCAN*PRO-based evolutionary model building," Schmalenbach Business Review, vol. 54, no. 3, pp. 198-220, 2002, doi: https://doi.org/10.1007/BF03396653. [ Links ]
[13] R. C. Blattberg & K. J. Wisniewski, "Price-induced patterns of competition," Marketing Science, vol. 8, no. 4, pp. 291-309, 1989. [Online]. Available: https://nwulib.nwu.ac.za/login?url=https://search.ebscohost.com/login.aspx?direct=true&db=edsjsr&AN=edsjsr.183977&site=eds-live. [ Links ]
[14] E. K. P. Chong & S. H. Zak, An introduction to optimization (Wiley Series in Discrete Mathematics and Optimization). New Jersey: Wiley, 2013. [ Links ]
[15] A. K. Jain, R. Bhardwaj, A. Choubey, & H. Saxena, "Application of linear programming for profit maximization of the bank and the investor" (in English), International Journal of Engineering and Advanced Technology, vol. 8, no. 6, pp. 4166-4168, 2019, doi: 10.35940/ijeat.F9337.088619. [ Links ]
[16] N. Akpan & I.A. Iwok, "Application of linear programming for optimal use of raw materials in bakery," International Journal of Mathematics and Statistics Invention, vol. 4, no. 8, pp. 51-57, 2016. [ Links ]
[17] V. Lidia, "The net present value and the optimal solution of linear programming in investment decisions," Annals of the University of Oradea, Economic Science Series, vol. 29, no. 2, pp. 135145, 2020. [Online]. Available: https://nwulib.nwu.ac.za/login?url=https://search.ebscohost.com/login.aspx?direct=true&db=bth&AN=148177994&site=eds-live. [ Links ]
[18] E. Okoye, "Application of simplex method to accounting decision making," Journal of the Management Sciences, vol. 1, pp. 168-182, 1998. [ Links ]
[19] I. Griva, S. G. Nash, & A. Sofer, Linear and nonlinear optimization. Philadelphia, PA: Society for Industrial and Applied Mathematics (SIAM), 2009. [ Links ]
[20] A. C. Floudas, Nonlinear and mixed-integer optimization: Fundamentals and applications (Topics in Chemical Engineering). Oxford: Oxford University Press, 1995. [ Links ]
[21] M. Bellare & P. Rogaway, "The complexity of approximating a nonlinear program," Mathematical Programming, vol. 69, no. 1, pp. 429-441, 1995, doi: 10.1007/BF01585569. [ Links ]
[22] D. S. Hochbaum, "Complexity and algorithms for nonlinear optimization problems," Annals of Operations Research, vol. 153, no. 1, pp. 257-296, 2007, doi: 10.1007/s10479-007-0172-6. [ Links ]
[23] P. Rossi, bayesm: Bayesian Inference for Marketing/Micro-Econometrics. [R package]. 2019. Available: https://CRAN.R-project.org/package=bayesm. [ Links ]
[24] R: A language and environment for statistical computing. Vienna, Austria: R Foundation for Statistical Computing, 2020, Available: https://www.R-project.org/. [ Links ]
* Corresponding author: hhorden@gmail.com
ORCID® identifiers
H.E. Horden: 0000-0001-7115-0063
C. Bisset: 0000-0001-5296-5945

