


Services on Demand
Article
 English (pdf)
 Article in xml format
 Article references
Indicators

Related links
-
 Cited by Google
 -
 Similars in Google
Share

 Permalink
South African Journal of Industrial Engineering
On-line version ISSN 2224-7890
Print version ISSN 1012-277X
S. Afr. J. Ind. Eng. vol.33 n.3 Pretoria Nov. 2022
http://dx.doi.org/10.7166/33-3-2784
SPECIAL EDITION
Development of a holistic diesel management system to reduce wastage in open-cast gold mining
S.R. NgwakuI,*; J. PascoeI; W.A. PelserII; J.H. van LaarI
ICentre for Research and Continued Engineering Development, Northwest University, South Africa
IIDepartment of Industrial Engineering, Stellenbosch University, South Africa
ABSTRACT
Fuel prices in South Africa are variable and steadily rising. Diesel accounts for a large portion of operational expenditures in open-cast mining, placing pressure on fleet managers to address fuel theft and wastage. Raw data is often obtained in a variety of formats (handwritten or digital) in this environment. A need therefore exists to capture, interpret, and utilise raw diesel data to gain insights for decision-making. It is critical to develop a diesel management system that can monitor and track fuel usage to increase performance, lower operational and maintenance costs, and eliminate misappropriation. Mining companies could benefit from a comprehensive diesel management system that enabled them to control, report, and track usage. The 'data-information-knowledge-wisdom' hierarchy is used in this study to capture and utilise raw diesel data for wastage reduction, business intelligence insights, and data visualisation to assist with faster decision-making.
OPSOMMING
Brandstofpryse in Suid-Afrika is veranderlik en styg voortdurend. Diesel is verantwoordelik vir 'n groot deel van operasionele uitgawes in oopgroefmynbou, wat druk op vlootbestuurders plaas om brandstofdiefstal en vermorsing aan te spreek. Rou data word dikwels in 'n verskeidenheid formate (handgeskrewe of digitaal) in hierdie omgewing verkry. 'n Behoefte bestaan dus om rou dieseldata vas te lê, te interpreteer en te benut om insigte vir besluitneming te verkry. Dit is van kritieke belang om 'n dieselbestuurstelsel te ontwikkel wat brandstofverbruik kan monitor en dophou om werkverrigting te verhoog, bedryfs- en instandhoudingskoste te verlaag en wanbesteding uit te skakel. Mynmaatskappye kan baat vind by 'n omvattende dieselbestuurstelsel wat hulle in staat stel om gebruik te beheer, rapporteer en na te spoor. Die "data-inligting-kennis-wysheid"-hierargie word in hierdie studie gebruik om rou dieseldata vas te lê en te gebruik vir vermorsingsvermindering, sake-intelligensie-insigte en datavisualisering om uiteindelik te help met vinniger besluitneming.
1. INTRODUCTION
1.1. Current state of diesel in South Africa
Various major South African economic sectors such as transportation, agriculture, and mining rely on diesel as an energy source [1]. In open-cast mining, diesel accounts for around 46% of operational costs [2], and is used to power large vehicles in the mining industry, such as dump trucks, excavators, front end loaders, bulldozers, graders, and water trucks. These vehicles are mostly used to load and transport material [3]. The vehicles with the highest rate of diesel consumption are dump trucks and excavators [4], which contribute the most to operational costs.
According to data recorded by the South African Petroleum Industry Association (SAPIA), diesel prices increased by 40% between 2019 and June 2022. With the continued rise of fuel prices in South Africa and globally, diesel-dependent sectors are expected to be impacted greatly. This is in addition to the financial pressures already experienced by mining operations from declining commodity prices, increasing operational costs, and declining productivity [5].
One of the main challenges that South Africa faces is uncontrollable fuel and commodity prices. Primary producers, such as mining, are price takers that have to sell their commodities at prices that are set internationally [6]. In addition, international factors account for about 60% of South Africa's fuel prices [7]. Two controls that South African mining industries can put in place to manage the impact of diesel price volatility in their respective organisations are 1) the application of fuel incentives, and 2) the development of a holistic diesel management system.
The former was discussed in detail in previous research [8]. The main objective of this article, therefore, is to develop a holistic diesel management system to reduce wastage in open-cast gold mining and to improve business intelligence insights to assist with faster decision-making.
1.2. Role of data in decision-making
Many operational decisions are made each day throughout an organisation. These decisions are mostly based on employee experience, but might not be effective because of varying levels of experience and the current state of the production system [9]. Organisations operating in the contemporary business environment are moving towards using data to improve decision-making [10]. However, many industries use only a portion of the available data [11], which highlights the scope for a data-driven approach to managing commodities.
The 'data-information-knowledge-wisdom' (DIKW) hierarchy is a widely used approach for transforming data into useful knowledge [12]. According to the DIKW hierarchy, to understand the complete context of a problem, data needs to be translated into wisdom [13]. Although companies are collecting large volumes of data, they still cannot gain valuable insights from it without converting it into wisdom [14]. Business intelligence (BI) is a combination of processes, technologies, and products that can provide relevant information and knowledge that enables organisations to make better decisions [15].
Various tools can be used to analyse and evaluate data to make informed business decisions for strategic planning and business management. Commonly used data analysis tools include Excel, Power BI, and Tableau [16]. Power BI is the tool that was used in this study to interpret, analyse, and visualise diesel data for valuable insights.
1.3. Overview of diesel management systems
A holistic diesel management system is necessary for faster decision-making through the governance of diesel usage and cost. Many fleet management systems in freight transportation are based on remote information monitoring, such as Bluetree, Verizon Connect, and GPS Insight [17], [18]. Fuel management and monitoring allows the user to track the fuel status of a vehicle, which includes fuel levels, refill frequency, leak or theft monitoring, and analysing consumption behaviour [19]. Fleet managers are under pressure to address fuel theft and wastage as a way of reducing operational costs.
Fleet management systems (FMS), also known as vehicle tracking systems (VTS), are used for real-time decision-making in the fields of transportation, distribution, and logistics [20]. Many companies, both locally and globally, provide FMS, which are aimed at reducing risks and improving fleet operational efficiency while minimising costs [20], [21]. The FMS architecture includes three basic layers, shown in Figure 1 [20]:
These layers are the following:
1. The loT layer contains sensors on each vehicle for wireless communication on factors such as location.
2. The processing layer monitors the operating state of the vehicle (that is, it identifies maintenance needs).
3. The decision layer interfaces the FMS with the users (directors and managers).
The use of FMS has been a welcome trend in many countries, and is deemed ideal for decision-making. As a result, a large body of literature is available that discusses the use of FMS and how it can be applied for optimal fuel efficiency. Studies related to fuel management were evaluated in this study to identify and showcase a need for holistic diesel management in the mining industry. Those studies were evaluated on the basis of the following research questions:
■ Did the study consider diesel management in the mining industry?
■ Was FMS implemented for decision-making and diesel management, and if yes, which FMS layers were considered?
■ Did the study focus on holistic diesel usage?
■ Was the DIKW hierarchy considered for decision-making?
The studies summarised in Table 1 were limited to those published after 2010 to ensure relevance.
In the analysis of the studies in Table 1, it was found that significant strides had been made to ensure the efficient management of diesel in industries, but that only half of the studies focused on the mining industry. Other studies were based on the construction and logistics industries, while others were not industry-specific. The majority of the studies implemented all three layers of FMS; some developed models, time-and-motion studies, and simulations to understand the factors influencing diesel usage and to develop solutions to reduce diesel usage.
None of the studies focused on holistic diesel usage. All of them looked only at specific types of vehicles -namely heavy-duty vehicles such as trucks, generators, and excavators. Finally, none of the studies implemented the DIKW hierarchy to help to inform decisions.
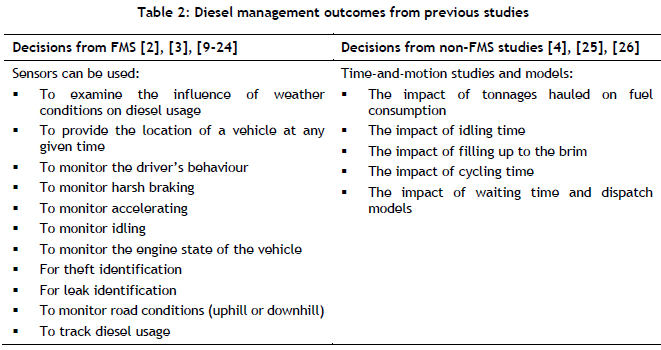
In addition to evaluating the use of FMS from the literature, the types of diesel improvement solution were investigated. The decisions made formed the basis of the solutions that the study sought to make, based on DIKW. Table 2 summarises the types of decisions made from the studies using FMS and also from studies that did not use FMS.
As shown in Table 2, FMS provides more actionable decisions and avoids theft and losses. However, FMS involves installing sensors on all vehicles for data collection, which might be expensive for companies with a large fleet. It can also be seen that most studies that implemented FMS were not based on mines. The non-FMS studies involved the development of models and scenarios for decision-making that might be complex to implement. Simulations and scenarios might not provide a realistic picture of the process, and the models also do not track diesel usage or identify diesel distribution.
Although FMS is one of the most efficient diesel management technologies available, it is expensive to implement. Chauhan [27] provided an overview of why mines do not implement FMS The main points from this article are listed below:
1. Existing systems require high financial and labour investments;
2. Not enough equipment to see a higher magnitude value;
3. Lack of change management to drive the required changes; and
4. Lack of incentives to prioritise implementation.
The literature indicates that systems are available for diesel management, but that these systems are either expensive or complex to implement. Diesel theft or wastages can occur at any point in the diesel usage process, and so it is important to analyse diesel usage in an operation holistically. Any form of data can be used to make decisions, whether it is obtained with a FMS, is captured manually, or is captured with the available software. In mines, some systems are automated while others are completely manual, which makes the use of FMS very difficult [28].
1.4. Need and objectives
In Sections 1.1 to 1.3 above, the need to improve diesel management in gold mines is highlighted. A holistic diesel management system could help fleet managers to monitor and track fuel usage and to diagnose issues that have occurred in the past to lower future operational costs. FMS is a tool that is used for decision-making in the transportation industry; however, it is not currently used in the mining industry owing to its high cost. The information gathered from these tools could help to improve overall decision-making.
This study investigated whether the DIKW hierarchy is sufficient to make insightful decisions for improved diesel management. The two main objectives, therefore, were 1) to use currently available operational tools to improve decision-making, and 2) to develop an affordable and usable diesel management system that the open-cast gold mining industry could employ by using the DIKW hierarchy.
2. METHODOLOGY
This methodology entailed a four-step process (referred to as 'the four pillars'), based on the DIKW hierarchy method [12], [13]. The four pillars are data, information, knowledge, and wisdom, and act as building blocks so that each step focuses on translating data into intelligence. The key objective of this methodology was to determine whether a simplified methodology, such as the DIKW hierarchy, could form the basis of holistic decision-making in mining operations without implementing FMS, which involves a high financial investment and complex tools. The four pillars with their respective phases are summarised in Figure 2.
The methodology began with the data pillar, when the data sources were investigated. The second pillar, information, entailed translating the data into useful information. The third pillar translated this information into useable knowledge. This was done by selecting key performance indicators (KPIs) and visualisations. The last part of this methodology was the wisdom pillar, which would assist with more effective decision-making. Each pillar is discussed in more detail below.
2.1. Data
This section focuses on evaluating the site operations and then the available data [13]. Phase 1 of this section was to evaluate the method used for data collection in the specific operation. Data collection methods vary from established systems, such as FMS and mobile applications, to handwritten sheets. The second phase of the data section was to establish what measurements were being taken and were available. This could be done by developing a site layout that showed the distribution of diesel in an operation from purchase to use. Once a layout had been completed, measurement points could be identified and the data traced back to the source of the measurement.
2.2. Information
Data alone does not provide any information about relationships, patterns, or structures [29]: the acquired data needs to be translated into useful information. This was accomplished by organising, structuring, and condensing the collected data.
This section answers the following questions [30].
■ Who,
■ What,
■ When, and
■ Where?
These questions can be adjusted to be specific to diesel management. The purpose of this section was to ensure that all avenues concerning diesel usage were accounted for and that the available data was used to its fullest extent. Table 3 summarises the questions that could be asked to convert diesel facts into attributes.
2.3. Knowledge
Once the information was available, this component of DIKW dealt with how the information from the data could be used [13]. This involved developing diesel usage profiles, management reports, and visual dashboards. The performance profiles could be distributed to all role players on a daily, weekly, or monthly basis, depending on the demand for the reports. These reports could be achieved by identifying KPIs, which could include, but would not be limited to:
■ Daily diesel balance tables
■ Litres per vehicle or machine
■ Highest diesel consumers
■ Daily diesel losses
■ Frequency of vehicle at diesel station
■ Operating hours profiles
■ Diesel intensity in litres per hour
■ Vehicles receiving more diesel than the respective tank capacity
All the knowledge that was obtained through pillars one to three could be used to produce insightful decisions.
2.4. Wisdom
The final step was to convert knowledge into wisdom [13]. The knowledge thus derived would provide the relevant role-players with sufficient wisdom to establish which actions needed to be prioritised, who needed to implement changes, and what needed to change. This step defined a procedure to follow, the development of action trackers, and the implementation periods.
The wisdom thus provided would entail the following:
■ Daily diesel balance tables could be used to ensure that every litre was accounted for.
■ The litres per vehicle would identify the highest consumers.
■ The frequency of diesel issued per vehicle would identify misuse, leakages, or theft.
■ Profiles of operating hours could indicate usage and breakdowns or malfunctioning odometers, and assist with maintenance schedules.
■ Diesel consumption in litres per hour could be used to identify inefficient vehicles.
■ Theft could be identified when vehicles received diesel that exceeded their tank capacities.
To test whether the data and information could in fact be translated into knowledge and wisdom, the DIKW hierarchy was applied to a practical application and evaluated, as described in the next section.
3. RESULTS: CASE STUDY
In this study, the methodology in Section 2 was applied to an open-cast gold mine for diesel management and effective decision-making. The case study mine is situated in the North-West Province of South Africa, and uses large volumes of diesel to carry out its primary activities. The results were divided into two domains: the data domain and the analysis domain. The data domain discussed the first pillar (data) of the DIKW hierarchy, and the second domain was a combination of the last three pillars (information, knowledge, and wisdom).
3.1. Data domain
In this study, the data component of the DIKW was divided into two sections: assessing the existing data collection methods, and assessing the measurements.
3.1.1. Assess data collection methods
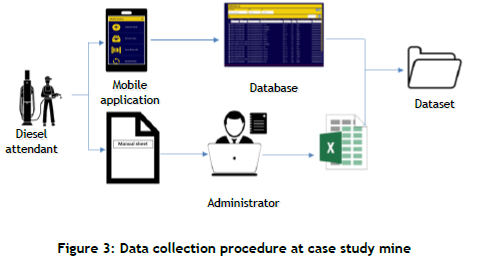
The mining operation selected as a case study does not have any sensors installed on its individual vehicles nor on its diesel storage facilities. The data is captured on a mobile application and saved on a centralised online database. The mobile application is not automatic, and relies on the diesel bay operator for accuracy and completeness. For backup purposes, all diesel transactions are also collected manually and handwritten by diesel operators. This is to ensure that all diesel volumes can be accounted for. Figure 3 illustrates the data collection process.
3.1.2. Assess measurements available
In order to evaluate the various data points in a network, it is important first to understand the basic diesel distribution layout of the case study. Figure 4 illustrates such a layout with various measurement points, from the point of diesel delivery to the point of use. The mobile device and the manual sheets are available at three points on the distribution route.
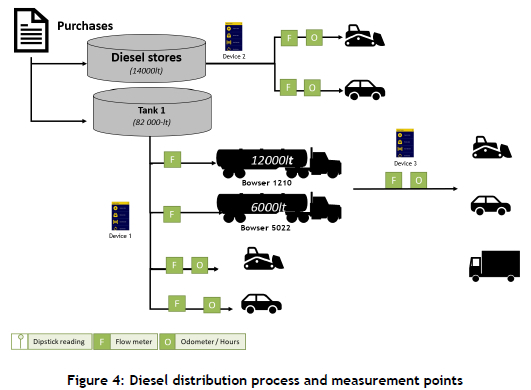
Figure 4 indicates that three devices are needed per shift:
■ Device 1 - measures diesel issued from the diesel stores tank;
■ Device 2 - measures diesel issued from Tank 1; and
■ Device 3 - measures diesel issued from the diesel bowsers inside the pit. Figure 4 also shows that three main data types are measured:
■ The quantity issued from the respective tanks;
■ The odometer reading from individual vehicles; and
■ The dipstick readings, to measure tank levels.
3.2. Analysis domain
As indicated by the second step in the DIKW hierarchy, the acquired data needed to be translated into useful information. The DIKW hierarchy provides four questions to convert the facts (data points) into the attributes of a system. The questions that were asked to convert the data into knowledge are detailed in Table 2. The same questions were used to translate the data into information.
For the third step, knowledge of how the operation was performing was obtained from the information by constructing data profiles or dashboards. The resulting reports could be distributed to relevant stakeholders, such as fleet managers. The fleet managers could then action what next steps should be taken, which fell under the 'wisdom' component of the DIKW hierarchy. For this case study, the Excel sheet data saved in the folder shown in Figure 3 was loaded on Power BI. (Operations that are not equipped with Power BI can use Excel to create performance profiles and reports. Power BI was chosen because it was readily available in the operation, and because it is an interactive tool that is easy to use.) Managers could observe the information detailed in Section 2.2.
A Power BI dashboard was created for management to review. Figure 5 below displays the charts indicating the total diesel usage. The chart answers the questions, who, what, where, and when. In the current view, the displayed information is for January 2021; the diesel is received from all the storage units; and the displayed data is for all vehicle types.
The quantity of diesel per vehicle type is illustrated in the circle diagram on the left, where most of the diesel is received by the heavy-duty vehicles (dump trucks and excavators). The diagram on the right illustrates the individual vehicles (according to their registration number) receiving the diesel. The second chart is not limited to excavators and dump trucks, but includes all vehicle types. However, the highest consumers are excavators and dump trucks.
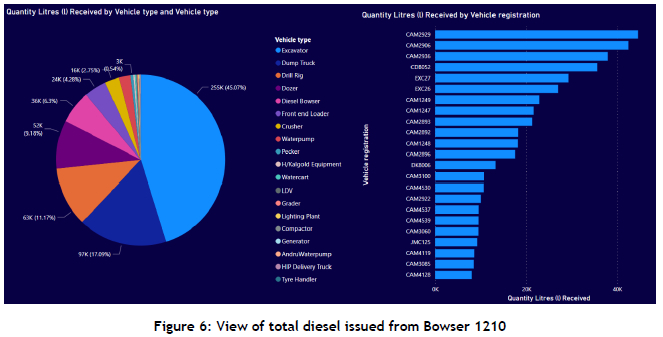
Figure 5 indicates the litres issued by all the tanks and bowsers; however, Figure 6 only indicates the diesel issued by Bowser 1210 and captured on the mobile device. The view can be broken down further into days to indicate daily performance. According to company policy, only vehicles and machines performing primary activities that are located within the pit should receive diesel from the diesel bowser; however, the view in Figure 6 indicates that light duty vehicles (LDVs) also received diesel from the bowser. This is the knowledge point that could help managers to gain the necessary wisdom to manage policies and controls.
The next view that was created was vehicle-specific. This would provide managers with valuable insights for each vehicle, and represented the 'wisdom' pillar of the methodology. Figure 7 indicates the refilling frequency of each machine. According to the operational policy or operational best practice of the case study, production vehicles such as dump trucks should fill up at most twice a day. In the first shift the vehicle needs to be filled to capacity. The second diesel fill-up is to top up the vehicle for the second shift. According to the frequency dashboard in Figure 7, there are vehicles that receive diesel more than twice a day (highlighted in orange and red).
Figure 7 clearly indicates the areas that would need to be investigated by the fleet manager to establish misuse of diesel, theft, wastage, or leakages in some of the vehicles. With this knowledge, managers would be able to identify vehicles with this abnormality and to investigate the reason for the high frequency. This is an actionable wisdom.
The final view is shown in Figure 8. The figure indicates the chart for vehicles that received diesel in excess of the respective vehicles' tank capacity. A vehicle cannot receive more than it can accommodate. This immediately indicates theft or wastage.
The vehicles shown in Figure 8 are mostly water pumps and generators. This supports the assertion that a diesel management system should be holistic, and not focus only on the largest diesel consumers. This insight would not be gained if the focus were only on dump trucks and excavators.
The profiles shown here are only a few examples of the wisdom that can be obtained from diesel data. Such profiles form the basis for insightful decision-making by fleet managers. A variety of actionable decisions can be made, such as holding vehicle operators and diesel bay controllers accountable. This highlights the need for a holistic diesel management system.
3.3. Validation
The study was validated by the fact that the wisdom to make actionable decisions was obtained from the available data. Decisions could be made without the implementation of FMS. Table 2 of this study indicated the decisions that were obtained by FMS; some of these decisions identified theft, misuse, and leakages, but these could also be established through this study. Frequent refuelling of a vehicle suggests leaks or theft; if it is not due to a leakage in the diesel tank, then it is likely theft. The quantity of diesel issued that exceeds the tank capacity immediately indicates suspicious diesel operator and driver behaviour, and justifies disciplinary action.
From the data obtained, the total amount of diesel that was issued in excess of the tank capacity of the vehicles from January 2021 to December 2021 amounted to 23 839 litres. With the diesel price at R25 per litre at the time of writing, this methodology could help to avoid a future loss of around R595 975 per annum. A significant amount of diesel could also be saved by identifying the vehicles that frequent the filling station. Understanding why vehicles receive diesel more than twice a day could identify whether the vehicles have leakages or theft is involved.
The installation of a fully-fledged diesel management system involves purchasing or leasing hardware devices in the form of sensors, and purchasing data acquisition software that collects engine status data and vehicles' locations as well as management interface software that the fleet manager could use to receive and interpret the data for the vehicles.
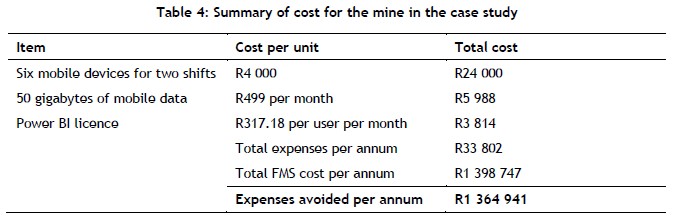
The cost of the FMS varies for each company, as shown by Rowe [31], who looked at fleet management costs across the biggest providers in the United States. He reported that the average cost of FMS was US$35 per vehicle per month. The mine in this case study had 210 vehicles, which meant that the operation would spend a total of R1 398 747 annually. This paper therefore suggests that mining operations make use of the systems available in their respective operations and move over to more advanced systems when funds are available. The methodology has also shown that the decision-making method 'DIKW' could be used by any operation to gain valuable operational insights and so reduce costs.
Table 4 summarises the cost involved with the current system of the mine in this case study.
As Table 4 shows, expenditure of almost R1.4 million could be avoided by using tools that are currently available in the mining operation. In addition to this, an additional expenditure of R595 975 per annum could be avoided by using the knowledge obtained from the data to gain actionable wisdom. More savings could be realised by evaluating the refilling frequency and ensuring that vehicles do not fill up twice a day unless it is absolutely necessary.
4. CONCLUSION
Data is available in the mining industry in a variety of formats. FMS have been implemented by many transport operations for diesel management and decision-making. This study indicated that all forms of data could be used for decision-making by applying the DIKW hierarchy. The study proved that improved decision-making and valuable insights could be obtained with the methodology developed in this study. The study is relevant to operations that have FMS hardware installed in their vehicles and to those that cannot afford FMS. With this approach, the key components of diesel management, such as consumption summaries and identifying theft and misuse, were identified and evaluated. This would lead to an improved understanding of how diesel is used throughout the operation, and identify areas for improvement.
The study analysed the refuelling frequency of vehicles, which helped to identify fuel theft or leakage. It is therefore recommended that future studies compare the running hours, kilometres, or route travelled for each vehicle and its refilling frequency, as this would help to account for additional refuels. In addition, the study focused on a diagnostic approach, not on a preventative one. It is thus recommended that future studies look into more proactive approaches, such as early warning signs to the control room when the same vehicle fills up for the third or fourth time in a day.
The two objectives of this study were met: available tools were used for informed decision-making at an affordable cost.
REFERENCES
[1] R. Nembahe & K. Ratchomo, "Overview of petrol and diesel market in South Africa between 2007 and 2016", Department of Energy, Pretoria, 2017 [Online]. Available: http://www.energy.gov.za/files/media/explained/Overview-of-Petrol-and-Diesel-Market-in-SA-between-2007-and-2016.pdf [accessed 14/02/2022]. [ Links ]
[2] E. da C. Rodovalho, H. Mota Lima, & G. de Tomi, "New approach for reduction of diesel consumption by comparing different mining haulage configurations", Journal of Environmental Management, vol. 172, pp. 177-185, February 2016, doi: 10.1016/j.jenvman.2016.02.048. [ Links ]
[3] W. Jonker & S.C. Carstens, "The impact of implementing a vehicle tracking system in a ferrochrome smelter supply chain : A case study", Journal of Contemporary Management, vol. 15, pp. 740-762, 2018. [ Links ]
[4] D.M. Bajany, L. Zhang, & X. Xia, "An optimization approach for shovel allocation to minimize fuel consumption in open-pit mines: Case of heterogeneous fleet of shovels", in 2019 International Federation of Automatic Control Conference, vol. 52, no. 14, pp. 207-212, 2019, doi: 10.1016/j.ifacol.2019.09.196. [ Links ]
[5] T. Makamba, "Evaluation of financial performance of South African gold, platinum, coal and iron ore mining companies for the period 2012-2016", M.Sc. dissertation, University of Witwatersrand, Johannesburg, 2018. [Online]. Available: http://wiredspace.wits.ac.za/handle/10539/26591 [accessed 25/05/2022]. [ Links ]
[6] National Treasury, "Discussion paper for public comment: Review of the diesel fuel tax table of contents", February, 2017. [Online]. Available: http://www.treasury.gov.za/comm_media/press/2017/20170215001%200review%20of%20the%20diesel%20fuel%20tax%20refund.pdf [accessed 22/01/22]. [ Links ]
[7] L. Rangasamy, "The impact of petrol price movements on South African inflation", Journal of Energy in Southern Africa, vol. 28, no. 1, pp. 120-132, 2017, doi: 10.17159/2413-3051/2017/v28i1a1597. [ Links ]
[8] S.R. Ngwaku, J. Pascoe, J.C. Vosloo, & J.H. van Laar, "Steps to improve logbook compliance for diesel rebates: A process-driven approach", South African Journal of Industrial Engineering, vol. 32, no. 3, pp. 122-134, 2021, doi: 10.7166/32-3-2624. [ Links ]
[9] A.A. Majeed, O.A. Nasher, & A.S. Al-Hegami, "A framework for total quality management of diesel generator fuel consumption using machine learning and Internet of Things (IoT)", International Journal of Computer Applications, vol. 176, no. 22, pp. 43-52, 2020, doi: 10.5120/ijca2020920234. [ Links ]
[10] A. Olubunmi & D. Amos, "Evaluation of diagnostic analysis and predictive analysis for decision making", in Transition from observation to Knowledge to Intelligence August 2019, [Online]. Available: https://www.researchgate.net/publication/335369231 [accessed 25/06/22]. [ Links ]
[11] L.A. Botes, W. Hamer, S. van Jaarsveld & M. Kleingeld, "FInding the four qualities of intelligent industrial reporting", South African Journal of Industrial Engineering, vol. 30, no.3, pp. 262-276, 2019, doi: http://dx.doi.org/10.7166/30-3-2235. [ Links ]
[12] J.G. Pretorius, M.J. Mathews, P. Maré, M. Kleingeld, & J. van Rensburg, "Implementing a DIKW model on a deep mine cooling system", International Journal of Mining Science and Technology, vol. 29, no. 2, pp. 319-326, 2019, doi: 10.1016/j.ijmst.2018.07.004. [ Links ]
[13] D. Nell, E.H. Mathews & P. Mare, "Industry 4.0 roll-out strategy for dynamic mine heat load management", South African Journal of Industrial Engineering, vol. 30, no. 3, pp. 106-114, 2019,doi: http://dx.doi.org/10.7166/30-3-2232. [ Links ]
[14] L.D. Makaleng, "A framework for implementing a scalable business intelligence system", M.Sc. Dissertation, Dept. of Computer and Electronic Engineering, North-West University, Potchefstroom, 2022. [ Links ]
[15] N. Corte-Real, P. Ruivo, & T. Oliveira, "The diffusion stages of business intelligence & analytics (BI&A): A systematic mapping study," Procedia Technology, vol. 16, no. 2014, pp. 172-179, 2014, doi: 10.1016/j.protcy.2014.10.080. [ Links ]
[16] J.M. Cainas, W.M. Tietz, & T. Miller-Nobles, "Kat insurance: dDta analytics cases for introductory accounting using Excel, Power BI, and/or Tableau," Journal of Emerging Technology in Accounting, vol. 18, no. 1, pp. 77-85, 2021, doi: 10.2308/JETA-2020-039. [ Links ]
[17] A. Mane, B. Djordjevic, & B. Ghosh, "A data-driven framework for incentivising fuel-efficient driving behaviour in heavy-duty vehicles", Transport Research Part D, vol. 95, no. April, 102845, 2021, doi: 10.1016/j.trd.2021.102845. [ Links ]
[18] J. Gong, J. Shang, L. Li, C. Zhang, J. He, & J. Ma, "A comparative study on fuel consumption prediction methods of heavy-duty diesel trucks considering 21 influencing factors", Energies, vol. 14, no. 23, 2021, doi: 10.3390/en14238106. [ Links ]
[19] F. Farzana, M.M. Hossain, M.M. Imtiaze, M.T. Hossain, A.S.M.M. Jameel, & S. Islam, "A realtime motion based fuel monitoring technique for vehicle tracking systems", in Emerging Technology in Computing, Communication and Electronics, February 2020, doi: 10.1109/ETCCE51779.2020.9350860. [ Links ]
[20] H. Bnouachir et al., "Intelligent fleet management system for open pit mine", International Journal of Advanced Computer Science and Applications, vol. 11, no. 5, pp. 327-332, 2020, doi: 10.14569/IJACSA.2020.0110543. [ Links ]
[21] H. Billhardt et al., "Dynamic coordination in fleet management systems: Toward smart cyber fleets", Intelligent Systems, IEEE, vol. 29, no. 3, pp. 70-76, 2014, doi: 10.1109/MIS.2014.41. [ Links ]
[22] M.S. Uddin & M.N. Khan, "Real-time water vehicle monitoring and tracking system for Bangladesh", in 1st International Conference on Advances in Science, Engineering and Robotics Technology (ICASERT) 2019, doi: 10.1109/ICASERT.2019.8934723. [ Links ]
[23] Dhanalakshmi & A. Ezil Sam Leni, "Instance vehicle monitoring and tracking with internet of things using Arduino", International Journal on Smart Sensing and Intelligent Systems, pp. 123-135, 2017, doi: 10.21307/ijssis-2017-240. [ Links ]
[24] R. Bose, S. Roy, S. Chakraborty, & I. Sarkar, "Development of a real-time fuel monitoring system for construction industry using Internet of Things", International Journal of Innovative Technology and Exploring Engineering , vol. 9, no. 3, pp. 2011-2017, 2020, doi: 10.35940/ijitee.c8568.019320. [ Links ]
[25] N.K. Dumakor-Dupey, V.A. Temeng, & K.J. Bansah, "Optimising shovel-truck fuel consumption using stochastic simulation", Ghana Mining Journal, vol.17, no. 2, pp. 39-49, 2017, doi: https://dx.doi.org/10.4314/gm.v17i2.6. [ Links ]
[26] O.G. Motlogelwa & R.C.A. Minnitt, "Optimization of diesel usage at Uitvlugt Mine", The Journal of The Southern African Institute of Mining and Metallurgy, vol. 113, no. 4, pp. 345-349, 2013. [ Links ]
[27] S.Chauhan, "Why do smaller mines not have a fleet management system (FMS)?", 2020, [Online]. Available: https://www.linkedin.com/pulse/why-do-smaller-mines-have-fleet-management-system-fms-sanket-chauhan/ [accessed 21/03/22]. [ Links ]
[28] H.M. Janse van Rensburg, A.G.S. Gous, J.C. Vosloo, & M. van Heerden, "Improving data management for environmental reporting in the gold mining industry", South African Journal of Industrial Engineering, vol. 30, no. 3, pp. 163-173, 2019, doi: 10.7166/30-3-2236. [ Links ]
[29] A. Cannas, L.O. Tedeschi, A.S. Atzori, & M.F. Lunesu, "How can nutrition models increase the production efficiency of sheep and goat operations?", Animal Frontiers, vol. 9, no. 2, pp. 33-44, 2019, doi: 10.1093/af/vfz005. [ Links ]
[30] The ITSM review, "The DIKW model for knowledge management", [Online]. Available: https://theitsmreview.com/2016/04/dikw-model-knowledge-management/[accessed 8/5/22]. [ Links ]
[31] A.Rowe, " What is fleetmanagement and how much does it cost?", 2022, [Online]. Available: https://tech.co/fleet-management/fleet-management-cost [accessed 7/6/22]. [ Links ]
* Corresponding author: refilwe.ngwaku@gmail.com
ORCID® identifiers
S.R. Ngwaku: 0000-0002-3226-6941
J. Pascoe: 0000-0001-7137-2678
W.A. Pelser: 0000-0002-8433-7844
J.H. van Laar: 0000-0003-0457-328X

