


Services on Demand
Article
 English (pdf)
 Article in xml format
 Article references
Indicators

Related links
-
 Cited by Google
 -
 Similars in Google
Share

 Permalink
South African Journal of Industrial Engineering
On-line version ISSN 2224-7890
Print version ISSN 1012-277X
S. Afr. J. Ind. Eng. vol.33 n.2 Pretoria Jul. 2022
http://dx.doi.org/10.7166/33-2-2710
CASE STUDIES
Improving service level performance by implementing Lean Six Sigma in SMEs of the gaming peripherals industry in Peru: a case study
F.J. Daza-Moran; A.S.D. Ramirez-Alva; J.C. Quiroz-Flores*; M.F. Collao-Diaz
Facultad de Ingeniería y Arquitectura, Universidad de Lima, Lima, Peru
ABSTRACT
Lean Six Sigma (LSS) is one of the essential and applicable techniques for any organisation in the 21st century, including small and medium-sized enterprises (SMEs), that wish to grow their competitive advantages. The LSS approach's insights offer an optimal vision for reducing technical gaps and assessing performance indicators. This case study aimed to improve service-level performance in a gaming peripherals SME by incorporating traditional engineering tools into the Define, Measure, Analyse, Improve, and Control (DMAIC) framework, validating its results through a two-month pilot plan, and analysing process improvement via statistical software. The study's findings revealed that SMEs could effectively control delays in order processing through statistical control planning regardless of financial capabilities.
OPSOMMING
"Lean Six Sigma" (LSS) is een van die noodsaaklike en toepaslike tegnieke vir enige organisasie van die 21ste eeu, insluitend klein en medium-grootte ondernemings (KMOs) op soek na die verryking van hul mededingende voordele. Die LSS benadering se insigte bied 'n optimale visie vir die vermindering van tegniese gapings en die beoordeling van prestasie-aanwysers. Hierdie gevallestudie het ten doel gehad om die diensvlakprestasie in 'n speelrandapparatuur KMO te verbeter deur tradisionele ingenieursinstrumente in die Definieer, Meet, Analiseer, Verbeter en Beheer ("DMAIC")-raamwerk in te sluit, die resultate daarvan te valideer deur middel van 'n twee maande lange loodsplan, en die proses verbetering te ontleed via statistiese sagteware. Die studie se bevindings dui daarop dat KMOs effektief vertragings kan beheer deur statistiese beheerbeplanning, ongeag van finansiele vermoens.
1 INTRODUCTION
Globally, revenue in the gaming peripherals industry is growing at an average annual rate of 3.3 per cent, resulting in a projected market volume of $5.65 billion by 2025 [1]. In the case of the Peruvian market, unlike other industries, the consumer electronics sector recorded an atypical growth of 5.93 per cent between March 2020 and March 2021 [2]. This year-on-year variation led to an optimistic scenario of projected demand, affecting the safety stock policy and the level of service offered. Thus there was an urgent need to apply an effective inventory policy to maximise service levels and minimise waste [3]. One of the best methodologies for reducing waste and operating costs is Lean Six Sigma (LSS). LSS is used for strategic decision-making to maximise value-added content and minimise variation in process characteristics, thereby improving customer satisfaction [4]. The LSS framework has been applied successfully in many industries, helping them to gain competitive advantage, as it diminishes process variability and increases productivity. In the case of logistics projects, this methodology can assess challenges in order fulfillment and mitigate the risk of stock-out.
This study presents an innovative approach to improving service-level performance by applying the LSS framework in the order fulfilment process at a consumer electronics warehouse. This work aims to identify and eliminate bottlenecks in warehouse operations and optimise the current replenishment process. The use of statistical-control analysis in inventory management and operational performance is a valid method to reduce shortage costs [5]. The innovative proposal of the case study is developed under the Define, Measure, Analyse, Improve, and Control (DMAic) methodology of LSS, and then validated through the implementation of a two-month pilot plan. The availability of scientific references on applying this model in the consumer electronics industry, both nationally and regionally, is limited. Therefore, the findings of this research will contribute to further investigations to improve SMEs' ability to cope with demand variability and operational efficiencies.
2 PROBLEM
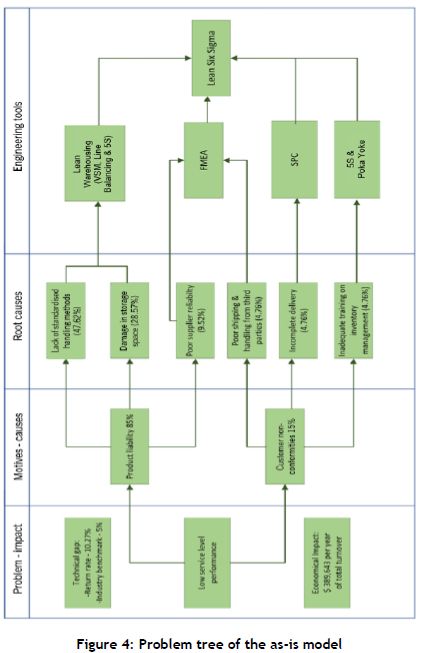
The case study was carried out in a consumer electronics SME located in Lima, Peru. Its products line consists of peripheral devices imported from Asian manufacturers, such as portable speakers, PC cases, ergonomic chairs, headsets, keyboards, power supplies, and cooling systems. Currently the company has a 9.0 per cent market share in the national gaming peripherals sector, in which it competes with international brands such as Logitech and Microsoft [6]. The main competitive advantage for a company in this sub-sector lies in its ability to provide innovatively and competitively priced products for consumers. One of the most significant issues for enterprises in this industry is the high risk of obsolescence owing to the fragility and short life cycle of inventories [7]. For this reason, the study opted to examine service-level performance indicators such as average monthly claims and return rates for malfunctioning or damaged products. This examination indicated that, in 2020 alone, 1130 products were returned to the company's RMA department, representing 10.27 per cent of the total turnover in economic losses.
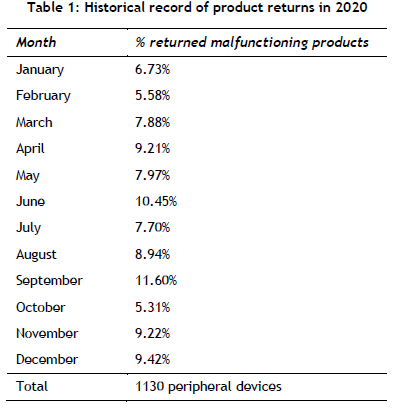
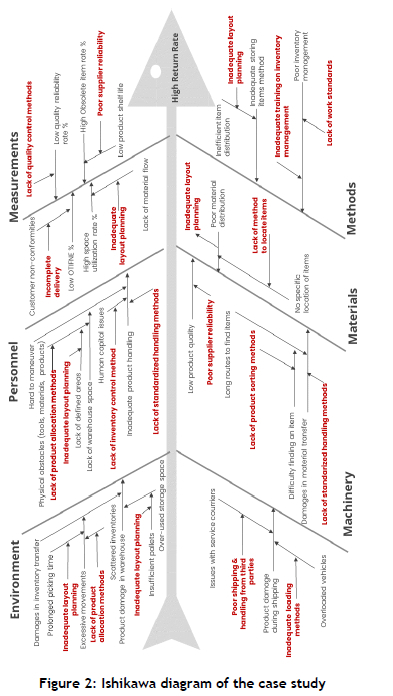
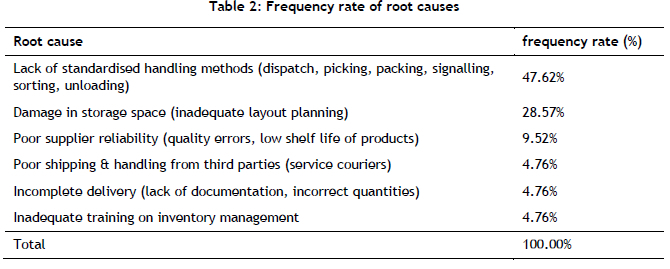
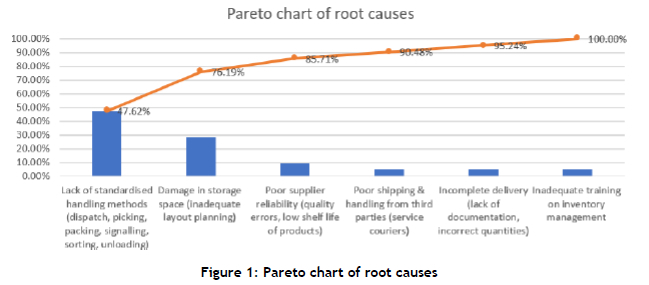
In order to identify the root causes of this technical gap, the study employed an Ishikawa diagram, as shown in Figure 2, and then quantified the grounds in a Pareto chart. Its results indicated that the rate of returns of malfunctioning products was primarily because of the lack of standardised handling methods and damage in storage spaces, as shown in Table 2.
3 BACKGROUND
The literature review in this study has been divided into two typologies: service-level performance analysis, and LSS implementation in case studies.
According to the literature review, the problems related to low service-level performance indicators may originate from deficiencies in several factors such as lead time, flexibility, responsiveness, and availability of finished products [8]. One case study emphasised that inefficient service-level performance occurs frequently in companies that tend to assign the same level of service to each of their inventories, thereby failing to distinguish between critical and non-critical products [9]. Not all products should have the same level of service, since this parameter is directly proportional to transportation costs [8]. Therefore, companies in this sector should note that product allocation is not just a crucial factor in achieving a good inventory management policy, but also a step towards optimising replenishment decision-making and reducing demand lead time [9]. The literature review also states that companies commonly fail to calculate service levels adequately, making it more difficult to determine the cost of unsatisfied demand [10]. For this reason, the study considered that the prime aim of warehouse managers should not just revolve around inventory cost reduction but also emphasise policies that can mitigate the risk of stock-out, specially for fast-moving items.
In order to reduce operational risks, the LSS framework can provide methods to quantify defective rates and elaborate controlling limits, thus reducing active variation, which is critical for both demand and inventory management [11]. Among the articles consulted, the potential of applying this technique to reduce waste and increase the level of order fulfilment was emphasised. Unlike the industrial sector, where lean tools optimise processes and reduce errors, the retail industry is committed to improving logistics services [4]. In the case of SMEs, most cannot adequately ensure quality and quantity in their product lines in comparison with large-scale competitors [12]. For example, high stock-out rates can produce variance in demand planning and deficiencies in replenishment frequency, but do not always mean that there is available space for stock or that low inventory warning reports are issued. In the LSS framework, DMAIC, models are developed and proposed according to the performance indicators that require improvement. A case study in supply chain management noted that Six Sigma deployment reduced inventory obsolescence leading to defect-free deliveries and service level improvements [13]. Thus implementing LSS in small-scale companies is a strategic measure to reduce waste and lead to cost-effective solutions.
4 INNOVATIVE PROPOSAL
In order to assess these risks and the other operational problems mentioned previously, the study conducts a problem-solving approach under the DMAIC methodology of LSS. The purpose of applying the DMAIC methodology is to provide a comprehensive approach to assess technical gaps and lead to operational benefits [14]. The proposed model also emphasises statistical process controls, risk assessment controls Failure Modes and Effect Analysis (FMEA), and lean warehousing techniques, which employ specific tools such as 5S, line balancing, and Poka Yoke. The investigation conducted a pilot plan over a two-month trial period to ensure an effective implementation process.
The DMAIC methodology consists of five phases in which system implementation is facilitated to comply with the objectives of each stage [15]. A flowchart was deployed to verify compliance in each implementation phase and to provide a clearer view of the integration of these tools into the DMAIC framework, as shown in Figure 5. The goals for each step are shown in the table below:
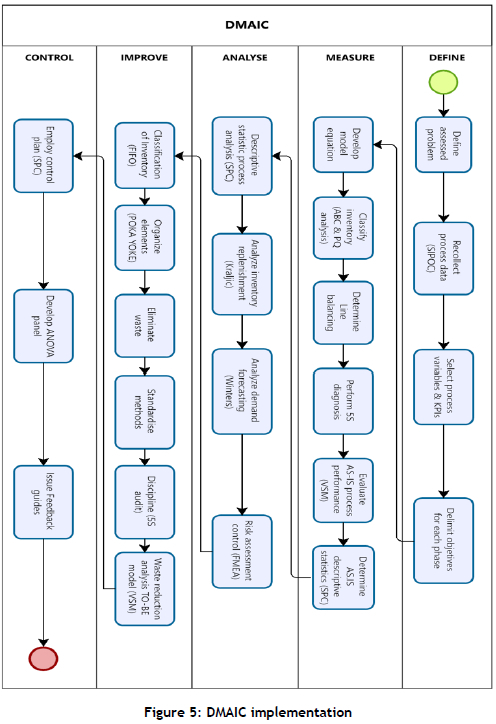
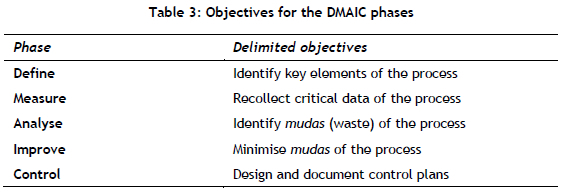
Phase A: Define:
This phase consists of defining the assessed problem, recollecting process data through a SIPOC diagram, selecting process variables, identifying key metrics, and delimiting objectives for the case study [15].
Phase B: Measure:
The measurement phase begins with developing the proposed model's linear equation. Before process variables are analysed, process performance is evaluated using lean warehousing tools such a Line Balancing, Poka Yoke, Value Stream Map (VSM), and 5S. Once this step is concluded, statistical process capabilities are examined through the use of Minitab software.
Phase C: Analyse:
This phase consists of analysing the statistical results of the as-is state, determining inventory replenishment through a Kraljic matrix, forecasting demand, and controlling risk assessment through the FMEA chart.
Phase D: Improve
The improvement phase consists of adapting the 5S methodology to provide a framework for this particular phase. It applies Poka Yoke techniques and FIFO inventory systems to fasten material flow and cleaning and auditing methods to minimise waste. Once the 5S framework has been implemented, a new VSM is designed to analyse wastage reduction.
Phase E: Control
A control plan is developed to set specification limits for process performance and atypical tendencies in the final phase. An ANOVA panel is then designed to show the process indicators, and finally a feedback plan is executed to evaluate the proposed model's adaptability with warehouse operators.
4.1 Lean warehousing methodology
4.1.1 Spaghetti plot and line balancing
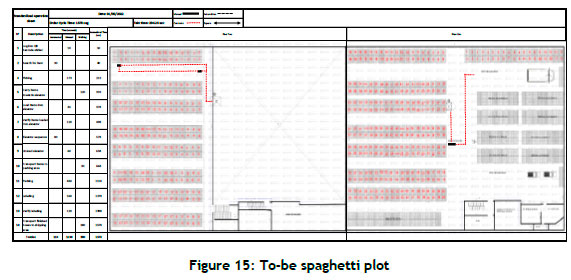
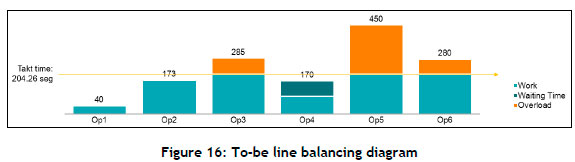
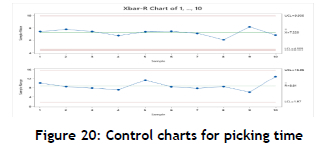
Once the case study's main problems have been identified in the Define phase, implementing a standardised process is critical for ensuring sustainable improvement in the warehouse by evaluating takt time (amount of time available for work/customer demand), sequence, and work in process. The projected sequence for the logistical process must abide by the number of assignments an operator can complete successfully within a timeframe established by the takt time. In that sense, the case study developed a spaghetti plot and a line balancing diagram to quantify the amount of time spent in each operation and to identify potential bottlenecks.
The As-is line balancing diagram demonstrates that the picking time for items exceeds the estimated takt time by more than three times its quantity. This operation alone reveals a prolonged work overload that requires the implementation of a standard routine to assess these issues.
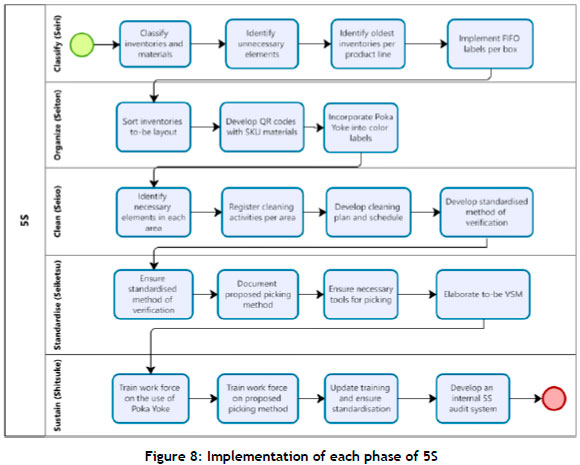
4.1.2 5S
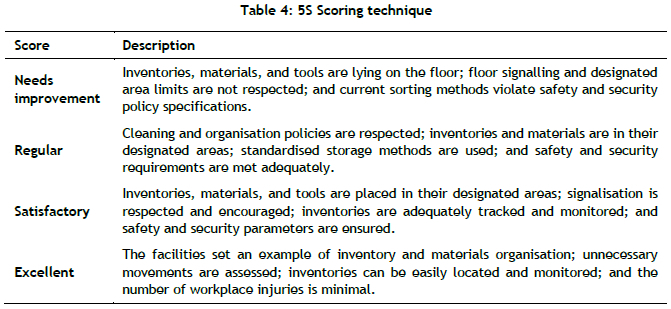
Implementing the 5S technique also provides a continuous improvement approach to enhance productivity and efficiency [19], which can be applied successfully in SMEs, minimising waste regardless of the economic limitations. The excess inventory and inadequate handling methods, as pointed out in Table 2, reveal an urgent need to reduce defects and promote storage organisation. The 5S diagnosis starts with the warehouse's initial auditing process using the Linkert scale [19], as shown in Table 4.
The 5S auditing process is applied in both the as-is state and the to-be state to quantify improvement solutions properly. This framework can provide a holistic approach to inventory management. The implementation process for each of the 5S stages is depicted in the figure below.
4.1.3 Poka Yoke
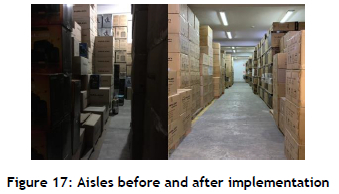
Minimising errors while completing picking operations is essential to reduce work overload and increase service-level performance. For that reason, the case study adopted a Poka Yoke approach by using QR sticker barcodes to quantify and locate items in each warehouse hallway. Since storing racks are not available in the warehouse, implementing a substantial change through a lean perspective can only be achieved by using digital tools that can turn a manual operation into an automated task.
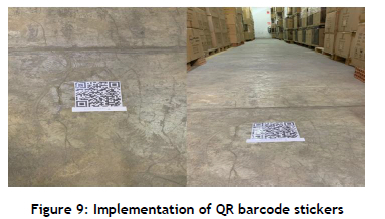
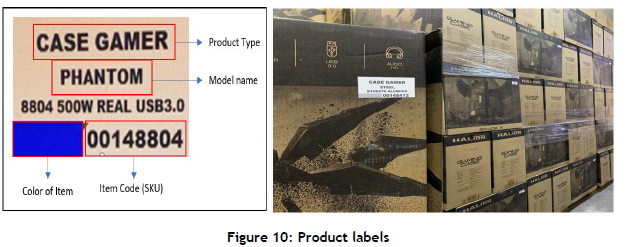
The case study also printed product labels to show relevant information about the product in each box, thus ensuring that operators would locate each product more easily, and reducing work overload in picking operations. The idea of applying Poka-Yoke is to minimise human error; in that sense, including labels containing the most relevant information was necessary to transform the warehouse operations.
The investigation also determined that, owing to the dark background of the cardboard boxes, the new labels should be easily identified and differentiated from other additional information shown on each box. A tag with a white background thus would enrich data visualisation and reduce the lack of visual order when locating products.
4.2 Statistical process control (SPC)
One of the main issues in implementing LSS is that improvement teams are unsure which specific indicator must be measured. Thus it is critical to define which key metrics will be evaluated; otherwise more waste would be added to the process through which waste is minimised. In the case study, the technical gap consisted of an elevated product return rate that directly impacted the service-level performance. Still, the principal root causes identified in Table 2 indicate that this was mainly the result of a lack of standardised handling methods. Thus statistical process control would be aimed at analysing this specific cause. The questions formulated to analyse this deficiency are given in the table below.
Once possible causes were identified, the study could determine its statistical model function [15]. The case study's statistical linear function is represented in the equation below:

Index:
i Storage areas on the first floor (i = 1,2,3,4,5)
j Storage areas on the second floor (j = 1,2,3,4,5)
k Product line (k = 1,2,3,...27)
Variables:
Yijk Represents the j-th replicate corresponding to the i-th level of the resulting dependent variable (critical KPI to improve: lead time for order preparation time)
Xik Represents the quantity of product K, in units, picked from storage area i
Xjk Represents the quantity of product K, in units, picked from storage area j
f(x) Represents the function in which potential inputs are transformed into the resulting outcome
EtJ Represents experimental error in data
The indicated variables were measured in the as-is and to-be states respectively.
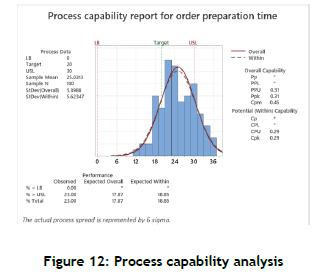
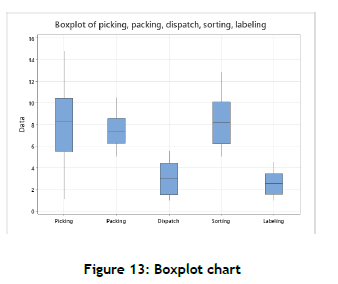
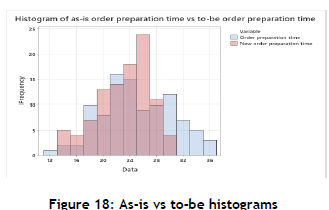
During the measurement phase, the process capability for order preparation time was examined, resulting in a Cpk performance of 0.29, indicating that the current process was inefficient and that the determined sigma level was 2.38, thus indicating an approximate yield rate of 80 per cent, removing the need for process improvement; and 23 per cent of order preparations surpassed the 30-minute upper specification limit time, as shown in Figure 11. Subsequently the study analysed each warehouse operation to determine which activity had a higher delay rate and which picking operations had a lower level of performance, as shown in Figure 12.
4.3 Risk assessment control (FMEA)
The process failure mode and its effects allowed us to detect potential system failures and to develop an action plan. The following diagram shows the deployment stages that took place:
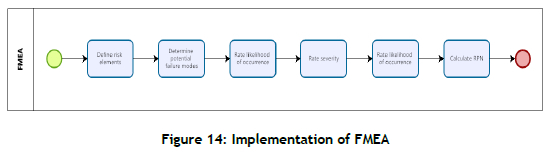
The first step was to define the process input's risk elements in order to identify the potential failure mode. Once this information had been gathered, three aspects - level of occurrence, severity, and detection level - were rated from 0 to 10, and the RPN was calculated [21]. Finally, mitigation actions were adopted to assess this issue. The chart below shows the five most critical risks emerging from the analysis:
5 VALIDATION
The case study implemented a two-month pilot plan to validate the results of using lean methodologies in the warehouse. The initial diagnosis revealed excessive time being spent during picking operations, which exceeded by three times the amount estimated for the process's takt time. Once QR barcode stickers had been implemented in each aisle, this task added an extra operation in which an operator with a smartphone was able to determine whether the desired product was located in that specific aisle, how many units were available, and which colour was in stock.
The pilot results showed a significant decrease in picking time, possibly as a result of the use of automated tools and inventory sorting through 5S auditing. Despite the reduction in picking time in the logistical process, packing time significantly exceeded takt time, mainly owing to a lack of staff. A re-organisation of the warehouse space contributed to reducing the average packing time.
6 ANALYSIS OF RESULTS
The indicators for each phase of the DMAIC methodology are listed in the table below:
The tools applied in the implementation process resulted in increased warehouse productivity and minimised the potential risks in the work areas. Once the work team had implemented these engineering solutions adequately, the case study evaluated the variance between both models through statistical process control, which could validate the investigation's findings and hypothesis. The statistical results are shown in the figures below:
7 CONCLUSIONS
The results of LSS implementation at a gaming peripherals SME showed satisfactory outcomes, and implemented a cost-effective solution for enterprises in this industry. The proposed model provides a way for statistical and engineering tools to be applied satisfactorily in small organisations with limited financial capabilities, and produces competitive advantages from their respective processes by following continuous improvement techniques through the DMAIC framework.
In the Define phase, vital elements of the process were identified, and then variables and metrics were selected for process improvement, such as service-level performance, thus providing clearer insight into exactly what the process was trying to measure and improve. The study collected critical process data again during the measurement phase, such as takt time, order cycle time, effort in the current layout, and compliance with 5S performance. Then process data from the VSM was measured through statistical process control to measure the current process capabilities and quantify the root cause prerogatives.
In the Analyse phase, the main objective was to identify wastage and mudas, which meant conducting a statistical process analysis through a C&E diagram and a non-normal data analysis to determine the behaviour of number distributions in warehouse operations. Subsequently, the study analysed product performance through a Kraljic matrix and current demand tendencies through Winter's method. Last, the study applied risk assessment control tools to mitigate the most significant risks in process operations, and then considered viable solutions in the Improvement phase.
The Improvement phase had the purpose of minimising wastage and mudas; so the case study applied a Poka Yoke-based solution, as shown in Figure 15, and this was applied in the sub-phases, using the 5S methodology. In the Classify sub-phase, QR barcodes were designed and produced for each aisle to monitor inputs and outputs. Product boxes would then be organised according to the amount of time in storage and labelled with FIFO stickers that are clearly shown in the Google Sites portal, thus minimising error rates during the picking operation. Subsequently, cleaning operations ensured organisation in working areas; the standardisation of these techniques is critical to the learning curve in inventory control management for any worker. This phase concluded with a final 5S internal audit and a new Value Stream Map (VSM) to identify the reduction of systemic bottlenecks.
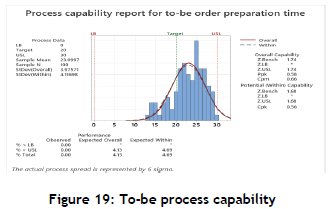
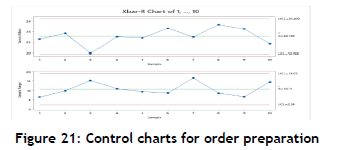
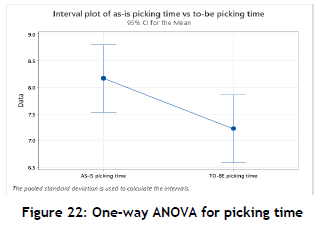
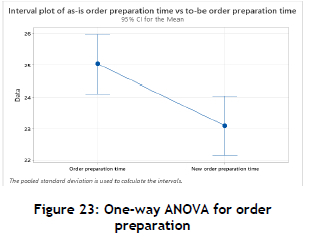
The control phase consisted of designing and documenting control plans to enable the company to monitor critical metric performance. The resulting statistics demonstrated an improvement in process capability, with a sigma level of 3.18, which indicates a yield rate of 94.39 per cent. The increased process capability reduced operating lead times, thus improving service-level performance by 10.69 per cent. The study carried out a one-way ANOVA analysis to prove the hypothesis and to compare the variance performance of both models, thus ensuring the effectiveness of the proposed model in the warehouse's operations. However, the use of space was an issue that the investigation could not assess appropriately, given the lack of warehouse racking systems, which would have allowed the better manipulation and identification of inventories and improved overall distribution. In such a system, the implementation of Kanban cards could be applied appropriately, ensuring that replenishment could be oriented towards a just-in-time model, thus enabling the company to project demand more accurately.
REFERENCES
[1] Sujay, L. 2021. Gaming peripherals market revenue worldwide 2017-2022. Retrieved from: https://www.statista.com/statistics/750680/worldwide-gaming-peripherals-market-revenue/#:-:text=Gaming/20peripherals/20market/20revenue/20worldwide/202017/2D2022&text=According/20to%20the%20findings%2C%20in,billion%20U.S.%20dollars%20in%202022. [ Links ]
[2] Instituto Nacional de Estadística e Informática. 2021. Informe técnico - Producción nacional [Technical Report - Domestic Production] (Report No. 05 - May 2021). Lima, Peru. Retrieved from: http://m.inei.gob.pe/media/MenuRecursivo/boletines/05-informe-tecnico-produccion-nacional-mar-2021.pdf [ Links ]
[3] Chinna Pamulety, T. & Madhusudanan Pillai, V. 2019. Statistical process control-based inventory policy. International Journal of Advanced Science and Technology, vol. 28, no. 19, pp. 129-133. Retrieved from: http://sersc.org/journals/index.php/IJAST/article/view/2502 [ Links ]
[4] Gutierrez-Gutierrez, L., De Leeuw, S. & Dubbers, R. 2016. Logistics services and Lean Six Sigma: A case study. International Journal of Lean Six Sigma, vol. 7, no. 3, pp. 324-342. doi:10.1108/ijlss-05-2015-0019 [ Links ]
[5] Paknejad, J., Nasri, F. & Affisco, J. 2018. A perishable EOQ model subject to distinct demands for conforming and non-conforming items. International Journal of Management Science and Engineering Management, vol. 14, no. 2, pp. 86-93. doi:10.1080/17509653.2018.1496490 [ Links ]
[6] Grados, F. & Velarde, V. 2021. El Crecimiento del segmento gamer crece rápidamente [The growth of the gamer segment is growing rapidly]. Canal Ti, 731, pp. 8-9. Retrieved from: https://issuu.com/mediacomm/docs/canal_ti_731 [ Links ]
[7] Syntetos, A., Kholidasari, I. & Naim, M. 2016. The effects of integrating management judgement into OUT levels: In or out of context? European Journal of Operational Research, vol. 249, no. 3, pp. 853-863. doi: 10.1016/j.ejor.2015.07.021 [ Links ]
[8] Onstein, A.T., Tavasszy, L.A. & Van Damme, D.A. 2018. Factors determining distribution structure decisions in logistics: A literature review and research agenda. Transport Reviews, vol. 39, no. 2, pp. 243-260. doi:10.1080/01441647.2018.1459929 [ Links ]
[9] Vicil, O. 2020. Optimizing stock levels for service-differentiated demand classes with inventory rationing and demand lead times. Flexible Services and Manufacturing Journal, vol. 33, no. 2, 381 -424. doi:10.1007/s10696-020-09378-4 [ Links ]
[10] Arnow, D. & Willems, S.P. 2017. Practice summary: Intel calculates the right service level for its products. Interfaces, vol. 47, no. 4, 362-365. doi:10.1287/inte.2017.0893 [ Links ]
[11] Stolze, H., Brusco, M. & Smith, J. 2021. Exploring the social mechanisms for variation reduction for direct store delivery (DSD) and vendor managed inventory performance: An integrated network governance and coordination theory perspective. International Journal of Production Economics, vol. 234, 108025. doi:10.1016/j.ijpe.2021.108025 [ Links ]
[12] Soundararajan, K. & Janardhan, J. 2019. Cost-reduction and quality improvement using DMAIC in the SMEs. International Journal of Productivity and Performance Management, vol. 68, no. 8, pp. 1528-1540. doi:10.1108/ij ppm-10-2018-0360 [ Links ]
[13] Madhani, P. 2016. Application of Six Sigma in supply chain management: Evaluation and measurement approach. The IUP Journal of Supply Chain Management, vol. 13, no. 3, pp. 34-53. Retrieved from: https://ssrn.com/abstract=2851301 [ Links ]
[14] Ben Ruben, R., Vinodh, S. & Asokan, P. 2017. Implementation of Lean Six Sigma framework with environmental considerations in an Indian automotive component manufacturing firm: A case study. Production Planning & Control, vol. 28, no. 15, pp. 1193-1211. DOI: 10.1080/09537287.2017.1357215 [ Links ]
[15] Cardiel, J., Baeza R. & Lizárraga, R. 2017. Development of a system dynamics model based on Six Sigma methodology. Ingeniería e Investigación, vol. 37, no. 1, pp. 80-90. doi:10.15446/ing.investig.v37n1.6 [ Links ]
[16] Rabanal M., Zamami S., Quiroze J. & Alvarez J. 2020. Systematic layout planning: A research on the third party logistics of a Peruvian company. In: Ahram T., Taiar R., Colson S. & Choplin A. (eds), Human Interaction and Emerging Technologies. IHIET 2019. Advances in intelligent systems and computing. vol. 1018. Cham: Springer. Nice, France. pp. 988-993. doi:10.1007/978-3-030-25629-6_153 [ Links ]
[17] Cano, P. & Paredes, N. 2018. Strategies and successful practices of innovation in the automotive industry: Science of technology and innovation. In Tolamatl J., Gallardo D., Varela J. & Méndez J. (eds), Redesign of warehouse layout: Key piece in the supply chain. ECORFAN-Mexico SC, Mexico City, Mexico pp. 114-130. [ Links ]
[18] Nagi, A. & Altarazi, S. 2017. Integration of value stream map and strategic layout planning into DMAIC approach to improve carpeting process. Journal of Industrial Engineering and Management, vol. 10, no. 1, pp. 74-97. doi:10.3926/jiem.2040 [ Links ]
[19] Sukdeo, N., Ramdass, K. & Petja, G. 2020. Application of 7S methodology: A systematic approach in a bucket manufacturing organisation. South African Journal of Industrial Engineering, vol. 31, no. 4, pp. 178-193. https://doi.org/10.7166/31-4-2283 [ Links ]
[20] Pekarcikova, M., Trebuna, P., Kliment, M. & Rosocha, L. 2020. Material flow optimization through e-kanban system simulation. International Journal of Simulation Modelling, vol. 19, no. 2, pp. 243254. doi:10.2507/IJSIMM19-2-513 [ Links ]
[21] Goffnett, S.P., Paquet, A.N., Strong, O.M. & McCarron, K.P. (2019). Replication of a Six Sigma black belt case study: GEP box's paper helicopter experiment in a drone logistics scenario. International Journal of Productivity and Quality Management, vol. 27, no. 1, pp. 36-43. https://doi.org/10.1504/IJPQM.2019.099628 [ Links ]
Submitted by authors 04 Feb 2022
Accepted for publication 11 Jul 2022
Available online 29 Jul 2022
ORCID® identifiers
F.J. Daza-Moran: 0000-0003-4119-1619
A.S.D. Ramirez-Alva: 0000-0002-2674-9250
J.C. Quiroz-Flores: 0000-0003-1858-4123
M.F. Collao-Diaz: 0000-0001-6874-4629
* Corresponding author: jcquiroz@ulima.edu.pe

