


Services on Demand
Article
 English (pdf)
 Article in xml format
 Article references
Indicators

Related links
-
 Cited by Google
 -
 Similars in Google
Share

 Permalink
South African Journal of Industrial Engineering
On-line version ISSN 2224-7890
Print version ISSN 1012-277X
S. Afr. J. Ind. Eng. vol.33 n.2 Pretoria Jul. 2022
http://dx.doi.org/10.7166/33-2-2571
GENERAL ARTICLES
Plant maintenance performance measurements shortfalls
S.D. KoloaneI, *; G.M. Kanakana-KatumbaII; R.W. MaladzhiIII
IThe author was enrolled for a Ph.D. degree in the Department of Mechanical and Industrial Engineering, University of South Africa, South Africa
IIDepartment of Mechanical and Industrial Engineering, University of South Africa, South Africa
IIIFaculty of Engineering and the Built Environment, Tshwane University of Technology, South Africa
ABSTRACT
Modern industry is faced with huge challenges in the 21st century. One the most pressing issues is poor plant performance, which erodes shareholders' return-on-investment. Despite enormous investment in production plants, high availability continues to be unattainable. The critical review research methodology adopted for this study was based on a literature review and guided by the plant life cycle framework. It was also informed by the notion that plant failures do not only originate in the operational phase. The results indicate that some plant items failed before operation could be initiated, and that performance indicators were inadequate and ineffective. Plant availability instruments did not report on the health of the standby plants, even though designers had seen the need to have redundancy ready at all times. All of the identified shortfalls will be tested in the system dynamics maintenance model that will be developed in the future.
OPSOMMING
Die moderne bedryf in die 21ste eeu ervaar groot uitdagings. Een van die dringendste kwessies is swak produksie-aanlegprestasies wat aandeelhouers se opbrengs op beleggings erodeer. Ten spyte van groot beleggings in produksie-aanlegte word hoe beskikbaarheid nie behaal nie. Die kritiese oorsig navorsings metodologie wat vir hierdie studie aangeneem is, is gebaseer op 'n literatuuroorsig en gelei deur die aanleg lewensiklus raamwerk. Dit is ook ingelig deur die idee dat aanlegfoute nie net in die operasionele fase ontstaan nie. Die resultate dui daarop dat sommige aanleg komponente misluk voor die werking van die aanleg begin en dat prestasie-aanwysers onvoldoende en ondoeltreffend was. Aanleg-beskikbaarheids instrumente rapporteer nie die status van bystandaanlegte nie, alhoewel die behoefte om ten alle tye bystand gereed te he deur ontwerpers gei'dentifiseer is. Al die gei'dentifiseerde tekorte sal getoets word in die stelseldinamika-instandhoudingsmodel wat in die toekoms ontwikkel sal word.
1 INTRODUCTION
All plants are developed to meet society's needs and safely to optimise shareholders' and stakeholders' return-on-investment. For this to be realised, plant operators have to ensure that their plant is operating within the regulatory, environmental, and safety constraints for the lowest cost. During its lifetime, this plant experiences failures despite the allocation of the best resources to maximise plant uptime [58]. This can be partially attributed to the second law of thermodynamics, that plant failure is inevitable as a result of this law [53]. During this time when the plant has failed, the operator cannot service their customers. This situation leads to business chaos, as customers' needs are not met. Today's customers have grown in number and complexity. In the 21st century, when competition is the order of the day, it is imperative for operators to have a dynamic strategy to minimise disruptions to their stakeholders and to maximise the return-on-investment for their investors [63]. A tool that is used to achieve this goal is an effective maintenance strategy. Paramount among managerial elements is control. In this area, the plant maintenance manager has to develop a key performance measurement system that will tell them that the plant is heading in the desired destination at the best and safest speed. This requires a dashboard with strategic key performance indicators.
There is, however, still an opportunity to enhance plant maintenance management, as various organisations continue to fail to act competitively and to exceed customers' expectations in this highly technology-driven and globalised village. In this study, a literature review is undertaken to identify the complex and dynamic levers that can be used to enhance a plant's availability.
2 OBJECTIVES
The objective of the proposed study was to identify the plant maintenance performance management shortfalls in the literature in order to enhance plant availability so that customers' expectations can be exceeded.
3 METHODOLOGY
Ibn Al-Haytham (Alhacen or Alhazen in Latin; c.965 - c.1040 CE), the father of modern optics, warned the truth seeker to be "...the enemy of all that he/she read and apply their mind to the core and margins of its content, attack it from every side. He/she should also suspect him/herself as he/she performs his/her critical examination of it, so that he/she may avoid falling into either prejudice or leniency" [49]. Leedy and Ormrod [48] postulated that any good inquirer is obliged to be eclectic or to be in position to tap a variety of the sources in the attempt to resolve a research problem.
In this inquiry, a critical review research methodology was adopted in order to identify the potential gaps between plant failures and availability through an extensive literature review, in accordance with Ibn Al-Haytham's research philosophy.
In executing this inductive approach, Ormrod [61] cautions the student of knowledge to avoid the pitfall of basing their conclusions on a sample that does not have the true characteristics of the main population. In order to comply with this research imperative, the researcher rejected the myopic view of focusing on the operational stage to search for the gaps that have failed to enhance plant management; instead, he adopted a rigorous and pragmatic [69] cradle-to-grave view with an inclination to be eclectic.
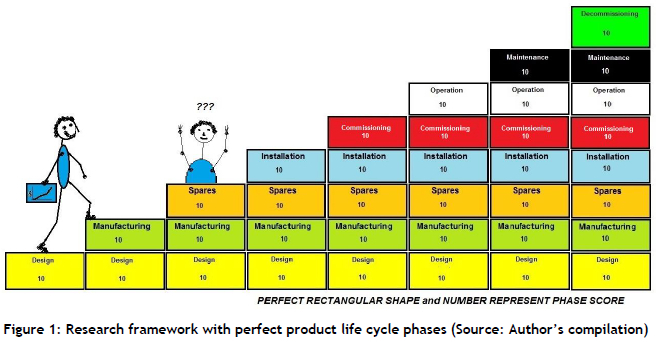
This philosophy was informed by the second law of thermodynamics, which is set in motion as soon as a product interacts with the environment or is activated. A research framework (see Figure 1) was developed on the basis of the product life cycle. A thorough literature review was conducted, phase by phase, in order to identify the cases in which failures had been reported in the literature, their root causes, which key performance indicators were used or not used, and their relationship with poor product performance during the operational phase. A hypothetical scorecard model was introduced for every phase and subjectively scored in order to study and illustrate the dynamic relationship between product life cycle changes and failures during the operation. The scorecard included some of the key performance indicators that were not identified in the literature but that were deemed to be missing.
4 PERFORMANCE MEASUREMENT SYSTEM FOUNDATION IN A PRODUCTION PLANT
Heraclitus of Ephesus, a Greek philosopher, once said: "The only constant in life is change itself" [53]. This is also applicable to the production system; variables are constantly subjected to positive and negative change over time. One of the most unwanted changes is the degradation of the plant's health, which results in failure. Table 1 shows the definitions of 'failure' offered by different scholars.
The common thread from these definitions is that plant failure cannot be confined to the operational phase alone: the reference point for failure is the design intent. In the sections that follow, this definition is applied in order to identify the gaps in plant performance measurement practice during the operational phase. The plant failure phenomenon demands that the plant maintenance manager intervene in order to recover the plant in the shortest time possible at the lowest cost. This recovery task requires resources; but one of the scarcest resources is the time required to conduct quality repairs. In the literature this is referred to as 'downtime' (unplanned or planned), while the period of production is commonly referred to as 'uptime'.
4.1 Life cycle of the production plant
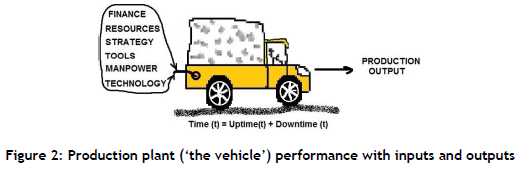
A production management system is composed of the inputs (resources, technology, strategy, finances, tools, and manpower) and a plant that transforms the inputs into the desired outputs (see Figure 2). The art of plant maintenance management has evolved since the first industrial revolution, and the changes now are intense, far-reaching, and globalised as the services that are customer-focused place tremendous pressure on plant management to provide quality service at all times [63]. The dynamics that are involved in transforming inputs into outputs formed part of this research.
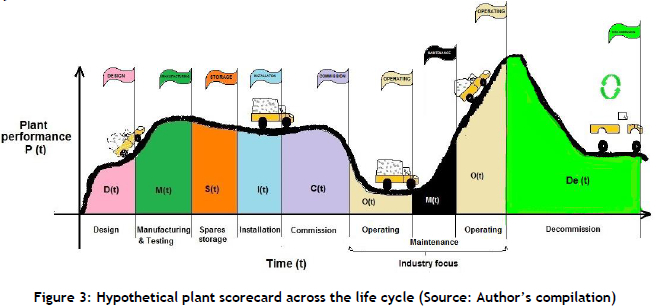
In order to maximise the returns, it is vital that the plant's health be in an excellent condition at all times so that customers' expectations can be exceeded. This is determined by a number of factors that interact with the plant from the cradle to the grave, so to speak. The performance measurement of a plant does not start and end during the operational and maintenance phases, as is assumed in the industry and described in the literature [3], [43]. Del Frate [14], [15] argues that plant or equipment failures that occur during the operational and maintenance phases could have been induced anywhere between the design and maintenance phases in the life cycle. This view was used to identify failures that had an impact on plant performance during the operational and maintenance phases. It was also used to identify key performance indicators that could be used to enhance the plant's availability and the maintenance's effectiveness. Figure 3 is the hypothetical plant performance, from design to decommissioning, across the product life cycle.
4.2 Plant key performance indicators (KPI)
Sir Isaac Newton once said, in a letter addressed to Robert Hooke in 1695: "If I have seen further it is by standing on the shoulders of giants" [10]. It is in this spirit that the maintenance manager must stand on a solid foundation if they are to overcome competitive forces through plant excellence.
Performance indicators are like the road signs or landmarks for the traveller on their journey. In the organisational setup, these signs convey more than what the traveller sees along the way. The purpose of the performance measurement is to gauge the effectiveness and efficiency of the production system by comparing it with the set targets on a continuous basis. The outcome is then constantly used by the driver (management) to adjust or revamp the system accordingly until the trajectory of success is achieved and is stable [80].
Performance indicators open up avenues for discussion, insight, organisational learning, strategic change, and overall improvement. Along with the strategies, performance indicators help the organisation to fulfil its mission of offering the highest quality services with good value to its stakeholders, maximising human resource potential, and ensuring the physical and fiscal integrity of the institution [30]. According to Behn [7], leaders can use the measurement to evaluate, control, budget, motivate, promote, celebrate, learn, and improve the organisation. This is a powerful behavioural tool, since it communicates what matters to the stakeholders. According to Porter [63], how an organisation competes in its chosen field has a bearing on the competitive strategies that it has to adopt. This involves determining the basis of the customer's or client's decision-making. Generally, their decisions are based on some combination of service, cost, time, and the quality of the experience.
The organisational indicators are always determined from the top down, using pointers and measures; what is important to the top management is to satisfy the needs of stakeholders or shareholders through the organisation's performance. According to Kumar [45], the first step is to define the goals at each level of the organisation. At an organisation level, the requirement is to determine how to manage maintenance in order to improve the overall performance (profits, market shares, competition, etc.). At the level of production, performance factors that have been identified through prior analysis are more important; these include improved availability, improved intervention costs, safety, environmental preservation, improvements in maintenance costs, value inventory, and control of contracted services. According to Gits [28], the dynamic relationship between the maintenance system, the production system, and the other functions needs to be clearly understood in order for the organisation to achieve its strategic objectives. Sheehan, Donohue, Shea, Cooper and De Cierie [69] found that leading indicators provided useful information for the organisation, as they were preventative. Leading indicators are forward-looking, as they show what is taking place, while lagging indicators are backward-looking, focusing on what has already happened [80].
In the next section, key performance indicators are developed for all phases of the product in the life cycle with the aim of demonstrating the effects of failures in the life cycle.
4.3 Plant times during the operational and maintenance phases
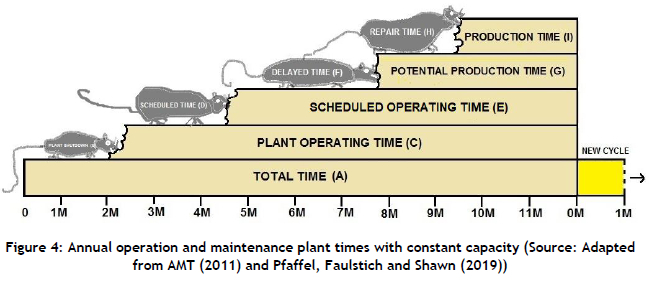
A Gregorian production calendar (Figure 4) has 12 months or 8760 hours (A) in a normal year. Unfortunately, the production manager is not able to keep the plant in operation for the full 12 months owing to the effects of the second law of thermodynamics, demands from the market, and statutory requirements based on the regulations of the Occupational Health and Safety Act, No. 85 of 1993, or on general regulations. The market demands can be determined by a number of factors; they could be driven chiefly by the business strategy that has been adopted by the organisation. As suggested by Porter [64], the strategy could be based on quality, service, cost, or time, or any combination of one or more. Statutory regulations affecting the plant could include public holidays, which require the workplace to be on shutdown, or other factors. All of the above could account for the plant being on shutdown (B).
The second category of the metrics refers to the scheduled (D) or planned maintenance times. This measure is based on statutory and non-statutory maintenance of the plant. The statutory requirements could be based on the Occupation Health and Safety Act, while the non-statutory requirements could be based on the original equipment manufacturers' (OEM) recommendations and on operational experience gained in maintaining a particular system.
The third category of metrics refers to delayed times (F). This measure is broad, as it could be caused by a variety of factors. A typical example might be that the plant operator has identified the plant defect during the night shift and loaded a request to the maintenance manager. The technician who is on standby has to travel (F1) from home to the industrial site, fetch their tool box (F2), obtain the necessary spares or special equipment (F3), and carry out the trouble-shooting (F4) before they can repair the defective plant item.
The last category of the metrics refers to the repair times (H). With this measure an organisation has the potential to minimise the time it takes to fix the plant defect by enhancing maintenance support and primary activities.
The performance measurement must allow the assessment of the indicator/s in comparison with the other equipment in a facility, measured on a similar basis throughout the industry [3] based on specific standards: the asset management standards (ISO 55000), maintenance key performance indicators [23], the reliability-centered maintenance (RCM) standard (SAE JA1012), international performance indicators for fossil-fired power plants [76], technical and commercial key indicators for power plants [78] and for the petroleum, petrochemical, and natural gas industries [38].
In a globalised world in which competition for the customer is a daily battle, a clear standard for plant performance is a must in order to benchmark one production plant against the best in the world [45] and to be able to communicate with stakeholders.
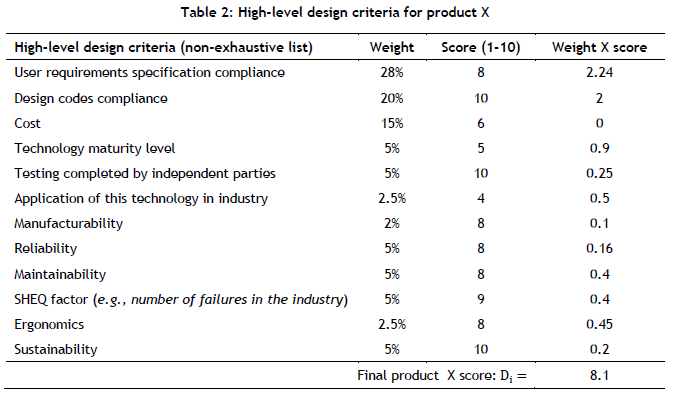
4.3.1 Design key performance indicator (DJ.
Garro, Brissaud and Blanco [27] define the design criteria as a "pragmatic entity that represents the product in its life cycle (manufacture, use, maintenance or destruction....)". This refers to the performance measure of the plant item at design stage. Based on the catastrophic Boeing 787 Dreamliner fire disaster in 2013, where designers had failed to do a thorough design, as reported by [37] and [9], the criteria that the design engineers used did not have the historical incidents measure; thus a lithium battery was used [58]. Databases such as the major accident reporting system [22] have been found to be good resources in searching for incidents related to products [33].
The weights and scores that have been used are hypothetical, as found in [21], [31], [83], and [58], for all criteria, as the model serves to illustrate the relationship between the quality of the work in a phase and in the succeeding phases. Table 3 below shows the typical design criteria applied to assess product X's performance at the design stage, as found in [70], [27], [19], [37], [9] and [58].
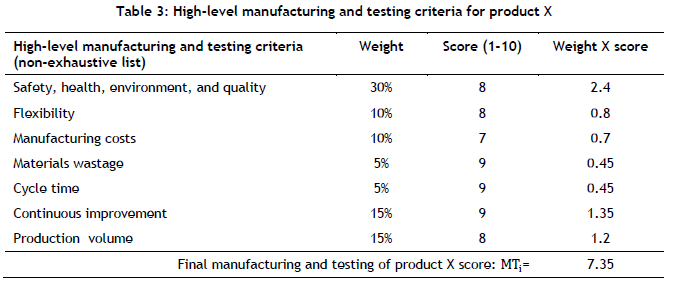
4.3.2 Manufacturing and testing key performance indicator (MTi)
According to Kalpakjian and Schmid [41] the word 'manufacturing' is derived from the Latin words manu factus, meaning "made by hand". They further define this as the making of products: manufactured items start with raw materials that are then subjected to a sequence of processes to make individual products with a certain value. In this section, a manufacturing and testing key performance indicator is developed in the context of the product life cycle. This refers to the performance of the plant item after the manufacturing stage, when plant item is ready to be used or stored.
An investigation by Netpu and Srichandr [56] revealed that the failure of helical gear in a power plant that had been in service for nine years was caused by the presence of oxide-carbide inclusions that were thought to have formed during the casting of the ingot that was used to make the gear blank, possibly because of inadequate degassing or the deoxidation of liquid steel prior to the ingot casting. The presence of the oxide was deemed to have been because of poor steel-making practice.
Bacharz, Raczkiewicz, Bacharz and Grzmil [5] study of precast loggia walls in Poland that had been erected after the Second World War found that they had manufacturing errors that were caused by a concrete cover that did not meet the standard requirements for thickness and tightness. Table 3 shows the typical manufacturing and testing criteria applied to assess product X's performance in this stage, as found by [74] and [34].
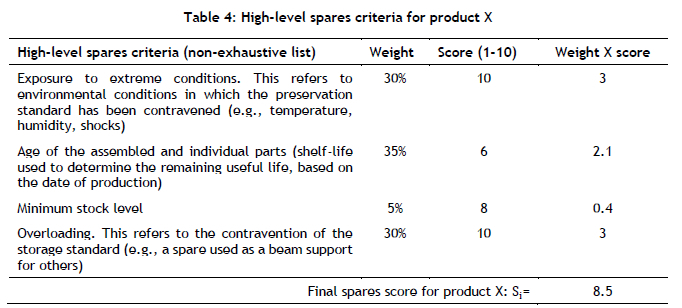
4.3.3 Spares storage and preservation key performance indicator (Si)
Spares storage and preservation plays a critical role in the successful implementation of a maintenance strategy. The spares are kept on-site to minimise plant recovery times in case of a plant breakdown. Unfortunately, the spares are made from materials that have definite lifetimes; after its expiry period or after exposure to extreme conditions, the material's performance deteriorates below acceptable limits for use in a plant.
According to Horrocks, Mansfield, Parker, Thomson and Atkinson's [33] study of the major accident reporting system (MARS), about 60 per cent of the major hazard loss from containment incidents are related to technical integrity and, of those, 50 per cent have ageing as a contributory factor. It was then concluded that plant ageing mechanisms played a significant role in major hazard accidents. This is also applicable to spares, as ageing starts after the manufacturing has been deemed to have been completed.
Van Volkenburg, Montgomery, Banjevic and Jardinee [77] developed a model that addressed the effects of military spare parts' shelf-life and their impact on future reliability. Their work also touched on the conditions that exacerbated the deterioration of parts, such as ultraviolet radiation rays, shocks, and variations in temperature, dust, and humidity. EPRI [24] cautioned plant managers to give special attention to the plant items that "fail while in storage". Assembled plant items have also been highlighted as a potential cause of failure in a storage facility; and EPRI recommendation was that sub-assemblies with the shortest shelf-life (e.g., elastomeric or plastic components) should be provided for in maintenance management [24]. Li and Lam [48] studied storage-induced effects on electronic equipment, grouped into three categories: a degradation mechanism that affects the reliability of the device; a degradation mechanism that affects the usability of the device; and environmental defects that initiate the degradation mechanisms under storage and subsequent life cycle stresses. Simulation studies revealed reductions in the remaining useful life of the components. Table 4 presents the typical spares criteria applied to assess product X's performance at the spares stage, as reported in [73], [33], [24], [74] and [48].
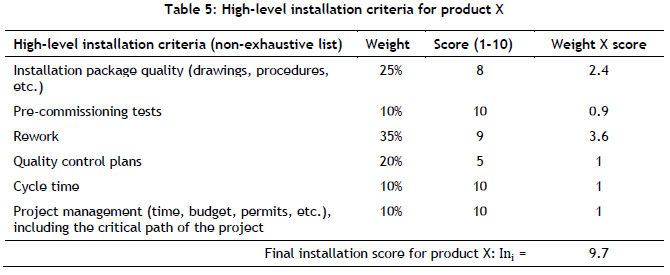
4.3.4 Installation key performance indicator (Ini).
This refers to the quality of a product's installation/assembly so that it is ready to be used for commissioning. This is based on the installation procedures designed by its OEM and the skill level of the installer.
Subramanian [72] investigated the failure of an elbow from side-cut piping (SS316L austenitic stainless steel) after three years of refinery gasoil service. Systematic investigations, including visual inspection coupled with laboratory studies, were carried out to determine the cause of the failure. A poor pre-commissioning inspection prior to the start of the side-cut piping (crude distillation column) operation was found to have to led to a defective elbow installation. Poor workmanship and inspection practices during the piping installation/ procurement stage, and ignoring in-service inspections, were important factors that contributed to the gasoil leakage. Golwalkar [29] issued a cautionary note to installers: that it is crucial that proper care be exercised during the installation of plant items such as site fabrication of large-diameter storage tanks, absorption towers with internal acid-resistant linings, joining of pipelines, and curing the internal lining while setting up a new process plant. Doing so would ensure that the plant would be able operate smoothly and safely.
Table 5 shows the typical spares criteria applied to assess product X's performance at the installation stage, as found in [1] and [29].
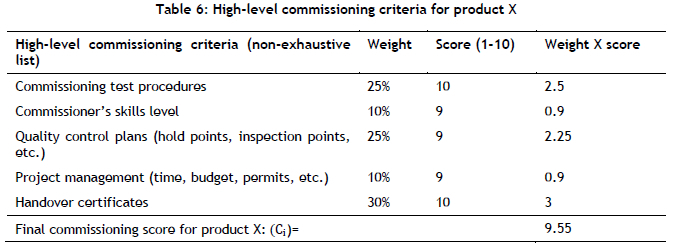
4.3.5 Commissioning key performance indicator (Ci)
The process of commissioning is begun when the pre-commissioning has been completed and defects have been identified and corrected to the extent judged necessary [52]. This process is substantiated by a handover certificate that confirms that all the necessary steps have been duly completed and that the plant operating manager can start production. This indicator refers to the success or failure of the commissioning stage.
Fu, Zhou, Wang and Shi [ 26] analysed an explosion at the Dangyang power plant in Hubei, China. In this accident, it was found that procurement had ordered a sub-standard flow meter and that the plant commissioning was done without any authorised procedure; and this had led to the team failing to identify the sub-standard flowmeter and a cracked welding joint. Nanney, Grinbaum, Littlefield, and Portos [55] investigated high-horsepower motors that had failed in the gas industry, and found that field installation, connections, and commissioning were not properly executed.
Table 6 lists the typical commissioning criteria applied to assess product X's performance at the commissioning stage in order to prevent the above-mentioned cases, as reported by [1] and [29].
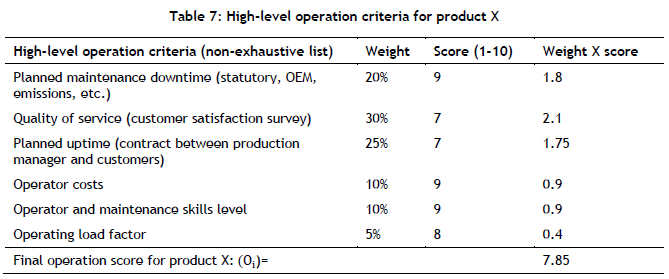
4.3.6 Operation key performance indicator (Oi)
This refers to the performance of the plant after the commissioning has been successfully completed and the plant had been handed over to the operating manager. During this period, the plant operator is running it according to the production manager's targets, based on service agreements in the light of market demands. In the course of this process, the defects that have sneaked from the design office into the commissioning office start to show their faces in the form of plant failures that require the plant to be shut down and defective items to be repaired. This failure has negative effects on the relationship between the production manager and the customers, as service is stopped during this period (downtime).
Two measures are used to evaluate the operation performance: plant uptime and quality. These key performance indicators help the production manager to translate plant uptime and quality into a revenue stream for the organisation.
Torres, Santos and Lins [75] investigated a biodiesel plant's pipeline in Brazil in order to establish why the plant had failed during its operation. After a thorough analysis it was found that production halts without proper acid phase drainage, an inefficient configuration of the neutralisation current insertion spool in the biodiesel stream, and a high concentration of the catalyst were the causes of the failures. Pramanick, Das, Das and Ghosh [65] also investigated the failure of the super-heater tubes of a 60 MW coal-fired power station. In this case, oxide deposits were found on the internal surfaces of the tubes as a result of poor demineralised water quality over a long period or of inadequate cleaning. The deposits had reduced heat transfer, leading to an increase in component temperature that led in turn to an overload under high hoop stress. Zuzek and Burja [84] investigated the operational failure of a coal conveyor pulley in a mine. The pulley had been in operation for 40 days and, after a thorough examination, it was found that a shaft had fractured. The shaft was made from 42CrMo4 steel and another material that was different from the parent material, and that had been welded to the outer radius of the shaft for unknown reasons.
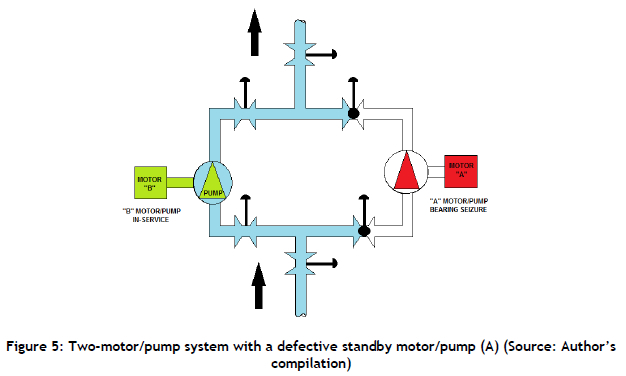
4.3.6.1 Effect of the operational failure of a standby plant on the plant availability measurement
In line with the principles of reliability-centered maintenance, an operational plant or system (A) will be built together with a standby plant (B), based on its criticality to the production plant. Traditional plant availability indicators do not report on the health of standby facilities; and this could compromise business continuity in the event of an operational failure (see Figure 5).
When this risk materialises, the plant availability statistics remains unchanged. The only feedback in the plant will be an alarm alerting the controller that a defective wheel has been replaced by a spare wheel and that the vehicle is back on production.
• Plant operating cycle (uptime and downtime) is the overall time period of the operation being assessed.
• Plant uptime is the total time the system was functioning during the operating cycle.
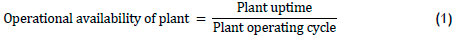
The drawback of this operational availability of the plant, as suggested by [76], [38], [42] and [78], is that it does not reveal the true health of the production plant, including that of the standby plant.
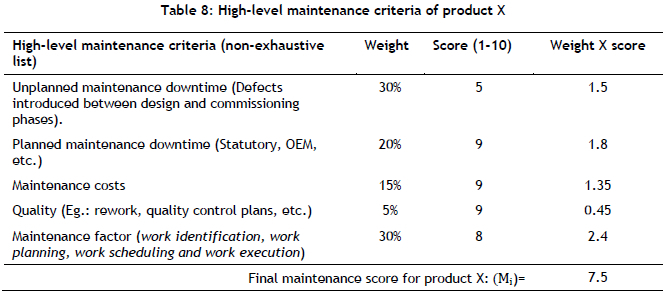
4.3.7 Maintenance key performance indicator (Mi)
This indicator refers to the status of the maintenance functions against their targets. It is divided into work identification, work planning, work scheduling, work execution [54], and maintenance costs. Work identification measures the planned and unplanned maintenance work, percentage improvement work, and work response rate; work planning measures the planning intensity, the quality of the planning, and planning responsiveness; work scheduling measures the scheduling intensity, the quality of the scheduling, and schedule realisation; work execution measures schedule compliance, the mean time taken to repair (MTTR), the manpower utilisation rate, the work order turnover, the work order backlog, the quality of the maintenance execution, and - last but not least - the maintenance costs, which measures the utilisation of the budget against the maintenance plans.
4.3.7.1 Effect of maintenance failures on a plant across its life cycle
Igba, Alemzadeh, Henningsen and Durugbo [35] conducted a study based on the historical failure data of the high-speed module of a Vestas 2 MW wind turbines gearbox in order to determine the effect of the preventive maintenance (PM) interval on the minimum maintenance costs and on reliability. They found that selecting the right interval for PM had a positive impact on the gearbox's reliability and on maintenance costs.
Ben, Mohamed and Muduli [7] investigated the effect of PM on machine reliability in Heineken's South Pacific Brewery beverage packaging plant in Papua New Guinea, which had a high number of breakdown events. Placing experienced operators at the key machines reduced the total breakdown time. Alsyouf [2] conducted a case study at a paper company in Hyltebruk in southern Sweden in order to demonstrate that an effective maintenance policy had a positive effect on productivity and profitability. Based on data collected between 1997 and 2007, the effect was successfully proven.
4.3.7.2 Effect of maintenance on a plant across its life cycle
Laakso and Pyy [46] and Pyy [66] studied faults that were caused by maintenance failures in a nuclear power plant called Olkiluoto BWR NPP between 1992 and 1994 by perusing more than 4400 maintenance reports and interviewing maintenance workers. Instrumentation and electrical components were identified as the most susceptible to human-induced faults, and plant modifications were identified as the source of multiple human-induced failures, among which omissions and incorrect commissioning were found to be the dominant types.
Jackson and Mailler [40] conducted research into the aims of PM. These included improving reliability, operational availability, and the life cycle costs of the system by reducing the risk of potentially expensive and inopportune failure. One of the areas that this research tackled was a long-standing inability to model the maintenance-induced failure. The application was based on the Australian Army's Landrover fleet, and the research assisted the maintenance managers to increase the PM service interval by 69 per cent, increasing reliability by 29 per cent by removing the PM-based failures.
Vora [79] investigated safety instrumented system (SIS) maintenance research in order to determine the effect of a run-to-failure strategy on these devices. The results indicated that unplanned failures, safety, and reliability had the potential to eat away at the company's profit and result in non-compliance with statutory regulations.
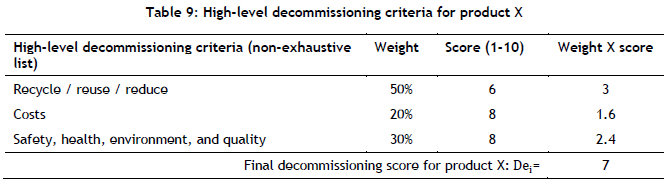
4.3.8 Decommissioning key performance indicator (Dei).
This indicator refers to the end-of-life for a plant after the operational and maintenance phases. Kalpakjian et al. [41] state that, in the United States of America alone, nine million passengers cars, 300 million tyres, 670 million compact fluorescent lamps, and five billion kilograms of plastics products are discarded each year.
Invernizzi et al. [36] researched the decommissioning of energy plants, and found the following: a lack of harmonised recycling and end-of-life waste regulation management, which continued to evolve and place more responsibility on operators and manufacturers to deal with the end-of-life of the products that they have produced. ChinaDaily [11] reported that the State Council had launched an extended producer responsibility (EPR) plan in order to protect resources and the environment better; and this was going to shift the accountability on to the products' designers to begin to include the end-of-life in their products' life cycle plans. The Republic of South Africa has put plans in place to enact EPR [13]; and the Scottish government has begun a North Sea Oil and Gas Rig Decommissioning and Re-use Opportunity Project to explore the value that the application of circular economy principles could bring to the economy and to the environment at large [67].
4.3.9 Product life cycle KPI findings
Figure 6 below summarises the literature review's findings, based on the hypothetical scorecard. The results of the review highlighted the importance of having long-term relationships with the OEMs of strategic plant equipment. It also shows that the maintenance manager can only control failures that have to do with the existing infrastructure; the other stages' weaknesses will need a complete redesign. Under the design phase, it was found that it is crucial for designers to study cases related to newly adopted technology through databases such as MARS. It was also found that spares managers did not have performance criteria for the spares failure or deviations from storage and perseveration policy, and that there was a need to develop an EPR indicator. One of the most crucial findings was that standby plants' health was not reflected in the traditional availability reporting system. Last, but not least, it was also identified that any failure in a plant's series process, from the design stage to the operational stage, had a bearing on the plant's performance.
Let us consider the life cycle of n phases in line with the theory of weighted scores:
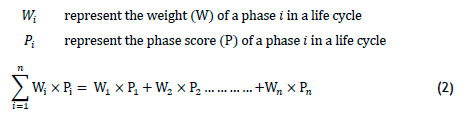
According to Hobbs [31], Maggino and Ruviglioni [50] and Odu [59], the weights (Wi) of the eight phases of a product's life cycle can be determined through a subjective procedure (point allocation, the ratio method, the Delphi method, etc.) or through an objective procedure (multi-correspondence analysis, principal component analysis, etc.). This is done by applying equation (2) in order to obtain the overall score for a product or plant's life cycle for the maintenance manager to manage the plant's availability optimally.
5 CONCLUSION AND FUTURE RESEARCH
In this article, a number of definitions of 'failure' were provided. The common thread among these was the inability to meet the design intent; and it was also found that product failure can occur anywhere between the design phase and the decommissioning phase.
Chief among the plant failures was the failure of spares because the parts had either reached the end of their shelf-life or they had experienced failure imposed by the unconducive environment. In future, maintenance managers must ensure that their planning processes are based on the true health of the components so that a situation of 'fighting fires' can be eliminated and plant availability be increased.
A framework that offers maintenance and operation managers a tool for managing their plant for a high level of availability has been developed. The purpose of the framework is to ensure that maintenance and production planning processes take into account what has happened to the plant item or plant from the design phase to the decommissioning phase. Examples of design, manufacturing, installation, commissioning, operation, maintenance, and decommissioning process failures have been provided, based on real cases obtained from the literature. Of note in these examples was the case of the electrical fire aboard the Boeing 787 Dreamliner in 2013, where it was found that lithium batteries had suffered from thermal runaway. This type of incident had been widely reported; but the Dreamliner's designers had failed to prevent the disaster by integrating this factor into their aircraft design.
This study found that countries have begun to apply EPR intensively - and yet organisational indicators continue to lag behind.
It was also found during the research that plant availability reporting does not include standby plants, despite this being vital for the security of supply for production managers.
The effects of the failures encountered in all phases of the product's life cycle should be applied in the system dynamics maintenance model in order to gain more insight into the plant availability dynamics that need to be developed in the future.
The hypothetical plant system or plant item scorecards framework should be subjected to subject-matter experts' evaluation in the future through the Delphi method or a survey; the criteria should be subjected to model misspecification tests; and historical plant items' quality warranty data should be used to validate the scores. The model should be used by maintenance practitioners to conduct technical feasibility studies when selecting plants or plant items in the future.
REFERENCES
[1] Almasi, A. 2014. Pre-commissioning, commissioning and start-up of industrial plants and machineries, Australian Journal of Mechanical Engineering, 12(2), pp. 257-263. [ Links ]
[2] Alsyouf, I. 2007. The role of maintenance in improving companies' productivity and profitability. International Journal of Production Economics, 105, pp. 70-78. [ Links ]
[3] AMT. 2011. Production equipment availability - A Measurement Guideline, AMT - The Association for Manufacturing Technology, 4th edition VA, United States of America. https://www.scribd.com/document/329641256/AMT-Standards2011. [ Links ]
[4] Becker, W.T. and Shipley, R.J. 2002. ASM handbook volume 11 - Failure analysis and prevention, Materials Park, OHIO: ASM International. https://www.asminternational.org/documents/10192/1849770/06072G_Frontmatter.pdf. [ Links ]
[5] Bacharz, K., Raczkiewicz, W., Bacharz, M. and Grzmil, W. 2019. Manufacturing Errors of Concrete Cover as a Reason of Reinforcement Corrosion in a Precast Element-Case Study, Coatings, 9(11): pp. 702. [ Links ]
[6] Behn, R.D. 2003. Why measure performance? Public Administration Review, 63(5), pp. 586-606. [ Links ]
[7] Ben, J., Mohamed, A. O., & Muduli, K. 2, International Journal of System Dynamics Applications (IJSDA), 10(3), pp. 50-66. [ Links ]
[8] Bollen, K.A., Biemer, P.P., Karr, A. F., Tueller, S. and Berzofsky, M.E. 2016. Are survey weights needed? A review of diagnostic tests in regression analysis, Annual Review of Statistics and Its Application, 3, pp. 375-92. DOI: 10.1146/annurev-statistics-011516-012958. [ Links ]
[9] Carrillo, A., Harville, L., Portilla, D. and O'Rourke, J.S. 2015. The Boeing company: The grounding of the 787 Dreamliner, Journal of Organisational Behaviour Education, 8, pp. 2-13. [ Links ]
[10] Chen, C. 2003. On the shoulders of giants, in: Chen, C. eds. Mapping scientific frontiers: The quest for knowledge visualization, London. https://doi.org/10.1007/978-1-4471-0051-5_5. [ Links ]
[11] ChinaDaily, 2017. China unveils extended producer responsibility plan [online], Available from: <https://www.chinadaily.com.cn/china/2017-01/03/content_27851701.html>. [Accessed 12 June 2021]. [ Links ]
[12] Cambridge Dictionary. 2021. Vehicle [online]. Available from: <https://dictionary.cambridge.org/dictionary/english/vehicle> [Accessed 13 June 2021]. [ Links ]
[13] DEFF. 2020. Department of Environment, Forestry and Fisheries (DEFF) on amendment of regulations and notices regarding extended producer responsibility in the waste sector [online]. Available from: <https://www.gov.za/speeches/environment-forestry-and-fisheries-amendment-regulations-and-notices-regarding-extended> [Accessed 13 June 2021]. [ Links ]
[14] Del Frate, L. 2011. Product failure: a life cycle approach, International Conference On Engineering Design - ICED11, Technical University of Denmark, Copenhagen, 15-18 August. [ Links ]
[15] Del Frate, L. 2014. Failure: Analysis of an engineering concept, PhD thesis, University of Technology, Delft. [ Links ]
[16] Del Frate, L. 2012. Preliminaries to a formal ontology of failure of engineering artifacts. In: M Donnelly & G Guizzardi (eds), Formal Ontology in Information Systems: Proceedings of the Seventh International Conference (FOIS 2012). Frontiers in Artificial Intelligence and Applications, vol. 239, IOS Press, Amsterdam, pp. 117-130. Seventh International Conference on Formal Ontology in Information Systems (FOIS 2012), Graz, Austria, 24/07/12. [ Links ]
[17] Del Frate, L. 2013. 'Failure of engineering artifacts: A life cycle approach'. Science and Engineering Ethics, 19(3), pp. 913-944. [ Links ]
[18] Del Frate, L., Zwart, S.D. and Kroes, P.A. 2011. 'Root cause as a U-turn'. Engineering Failure Analysis, 18(2), pp. 747-758. [ Links ]
[19] DLS, 2002. Denel Land System (DLS) procedure for the compiling of a design file - Doc ID 1000598, Pretoria, South Africa, Denel Land System. [ Links ]
[20] Invernizzi D.C., Locatelli, G., Velenturf, A., Love, P.E.D., Purnell, P. and Brookes, N.J. 2020. Developing policies for the end-of-life of energy infrastructure: Coming to terms with the challenges of decommissioning, Energy Policy, 144. [ Links ]
[21] Eckenrode, R.T. 1965. Weighting multiple criteria, Management Science, 12(3), pp. 180-192. http://dx.doi.org/10.1287/mnsc.12.3.180. [ Links ]
[22] eMARS. 2016. Major Accident Report System (MARS) [online]. Available from: <https://ec.europa.eu/jrc/en/scientific-tool/major-accident-reporting-system>. [Accessed on 19th June 2021]. [ Links ]
[23] EN 13306 (European Standard). 2010. Maintenance - Maintenance terminology, Brussels: European Committee for Standardization. [ Links ]
[24] EPRI. 2011. Plant engineering: Guidelines for establishing, maintaining, and extending the shelf life capability of limited life items, Revision 1 of NP-6408 (NCIG-13). 1022959. Palo Alto, CA. https://www.epri.com/research/products/1022959. [ Links ]
[25] Fashandi, A and Umberg, T. 2003. Equipment failure definition: a prerequisite for reliability test and validation, IEEE/CPMT/SEMI 28th International Electronics Manufacturing Technology Symposium, IEMT2003., pp. 357-358. Doi: 10.1109/IEMT.2003.1225929. [ Links ]
[26] Fu, G., Zhou, L., Wang, J. and Shi, S. 2018. Analysis of an explosion accident at Dangyang Power Plant in Hubei, China: Causes and lessons learned, Safety Science, 102, pp. 134-143. DOI: 10.1016/j.ssci.2017.10.010 [ Links ]
[27] Garro, O., Brissaud, D. and Blanco, E. 1998. Design criteria, IFAC Proceedings Volumes, 31 (15), pp. 743-748. https://doi.org/10.1016/S1474-6670(17)40641-0. [ Links ]
[28] Gits, C.W. 1994. Structural Maintenance Control Systems, International Journal of operation and production management, 14 (7): pp. 5-17. https://doi.org/10.1108/01443579410062121. [ Links ]
[29] Golwalkar, K. R. 2016. Production management of chemical industries, Basel, Switzerland: Springer International Publishing. https://doi.org/10.1007/978-3-319-28253-4. [ Links ]
[30] Hall, M.J. 2003. Strategic planning: An information paper, Unpublished manuscript. [ Links ]
[31] Hobbs, B. F. 1980. A comparison of weighting methods in power plant siting, Decision Science, 11, pp. 725-737. [ Links ]
[32] Hoffman, K. and Kunze, K. 1971. Linear algebra, 2nd ed., Englewood Cliffs NJ: Prentice-Hall. [ Links ]
[33] Horrocks, P., Mansfield, D., Parker, K., Thomson, J., Atkinson, T. and Worsley, J. 2011. Managing Ageing Plant [online]. Available from: <https://www.hse.gov.uk/research/rrpdf/rr823-summary-guide.pdf >. [Accessed 5th June 2021]. [ Links ]
[34] Hwang, G., Han, J.-H. and Chang. T.-W. 2020. An integrated key performance measurement for manufacturing operations management, Sustainability 12, 13:5260. https://doi.org/10.3390/su12135260. [ Links ]
[35] Igba, J., Alemzadeh, K., Henningsen, K. and Durugbo, C. 2015. Effect of preventive maintenance intervals on reliability and maintenance costs of wind turbine gearboxes, Wind Energy, 18 (11), pp. 2013-2024. [ Links ]
[36] Invernizzi D.C., Locatelli, G., Velenturf, A., Love, P.E.D., Purnell, P. and Brookes, N.J. 2020. Developing policies for the end-of-life of energy infrastructure: Coming to terms with the challenges of decommissioning, Energy Policy, 144. [ Links ]
[37] Irfan, U. 2014. How Lithium Ion Batteries Grounded the Dreamliner? [Online]. Available from: < https://www.scientificamerican.com/article/how-lithium-ion-batteries-grounded-the-dreamliner/>. [Accessed 3rd June 2021]. [ Links ]
[38] ISO/TR 12489. 2013. Petroleum, petrochemical and natural gas industries - Reliability modelling and calculation of safety systems, Geneva, Switzerland: International Organization for Standardization (ISO). https://www.iso.org/standard/51456.html. [ Links ]
[39] ISO14224. 2016. Petroleum and gas industries - Collection and exchange of reliability and maintenance data for equipment, Geneva, Switzerland: International Organization for Standardization (ISO). https://www.iso.org/obp/ui/es/#iso:std:iso:14224:en. [ Links ]
[40] Jackson, C.S. and Mailler, B. 2013. Post-servicing failure rates: optimizing preventive maintenance interval and quantifying maintenance induced failure in repairable systems. In 2013 Proceedings Annual Reliability and Maintainability Symposium (RAMS), Orlando, Florida, 28-31 January 2013, IEEE, pp. 1-7. [ Links ]
[41] Kalpakjian, S. and Schmid, S.R. 2009. Manufacturing engineering and technology, 6th Edition, New York Prentice Hall. [ Links ]
[42] Katukoori, V.K. 2015. Standardizing availability definition [online], Available from: <https://www.plant-maintenance.com/maintenance_articles_terminology.shtml >. [Accessed 3 July 2020]. [ Links ]
[43] Kimura, F., Matoba, Y., and Mitsui, K. 2007. Designing product reliability based on total product lifecycle modelling, CIRP Annals - Manufacturing Technology, 56 (1), pp. 163-166. DOI:10.1016/j.cirp.2007.05.039 [ Links ]
[44] Kumar, K., Kumar, S., Gupta, M. and Garg, H.C. 2016. Effect of addition of bottom ash on the rheological properties of fly ash slurry at varying temperature. In IOP Conference Series: Materials Science and Engineering, International Conference on Advances in Materials and Manufacturing Applications (IConAMMA-2016) 14-16 July 2016, Bangalore, India, IOP publishing, 149 (1): 012044. DOI:10.1088/1757-899X/149/1/012044. [ Links ]
[45] Kumar, U., Galar, D., Parida, A, Stenstrbm, C. and Berges, L. 2013. Maintenance performance metrics: A state-of-the-art review, Journal of Quality in Maintenance Engineering, 19(3), pp. 233-277. DOI:10.1108/JQME-05-2013-0029. [ Links ]
[46] Laakso, K., Pyy, P. and Reiman, L. 1998. Human errors related to maintenance and modifications, S T U K - Y T O - T R 1 3 9, Radiation and nuclear safety authority, Helsinki. https://www.julkari.fi/bitstream/handle/10024/123699/stuk-yto-tr139.pdf?sequence=1. [ Links ]
[47] Leedy, P.D. and Ormrod, J.E. 2015. Practical research: Planning and design, 11th ed. Essex: Pearson Education. [ Links ]
[48] Li, N.M., Das, D. and Pecht, M. 2017. Shelf life evaluation method for electronic and other components using a Physics-of-Failure (POF) approach: Proceedings of the 2017 Society for Machinery Failure Prevention Technology Conference, Virginia Beach, Virginia, USA, 16-18 May. Curran Associates. [ Links ]
[49] Light2015. 2015. Ibn al-Haytham's scientific method [online]. Light2015, 2015. Available from: <https://www.light2015.org/Home/ScienceStories/1000-Years-of-Arabic-Optics.html>. [Accessed 8 July 2021]. [ Links ]
[50] Maggino, F. and Ruviglioni, E. 2009. Obtaining weights: From objective to subjective approaches in view of more participative methods in the construction of composite indicators, Proceedings of new techniques and technologies for statistics, Eurostat, Brussels, Belgium, pp. 37-46. https://citeseerx.ist.psu.edu/viewdoc/download?doi=10.1.1.589.1143&rep=rep1&type=pdf. [ Links ]
[51] Maniatis, Y.N. 2003. The world in identity in Heraclitus, Phronimon, 4(1), pp. 70-84. [ Links ]
[52] Mannan, S. 2012. Lees' loss prevention in the process industries - Hazard Identification, Assessment and Control, 4th ed., Oxford: Butterworth-Heinemann. [ Links ]
[53] Moran, M.J., Shapiro, H.N, Boettner, D.D. and Bailey, M.B. 2018, Fundamentals of engineering thermodynamics, 9th ed., New York: John Wiley Press. [ Links ]
[54] Muchiri, P., Pintelon, L., Gelders, L. and Martin, H. 2010. Development of maintenance function performance measurement framework and indicators, International Journal of Production Economics,131(1), pp. 295-302. https://doi.org/10.1016Zj.ijpe.2010.04.039. [ Links ]
[55] Nanney, J., Grinbaum, I., Littlefield, M. and Portos, J. 2020. Premature failure of large horsepower motors: Created by improper field connections, during installation, and commissioning, IEEE Industry Applications Magazine, 26(6), pp. 48-55. [ Links ]
[56] Netpu, S. and Srichandr, P. 2013. Failure of a helical gear in a power plant, Engineering failure analysis, 32, pp. 81-90. https://doi.org/10.1016/j.engfailanal.2013.03.002. [ Links ]
[57] Nowlan, S and Heap, H. 1978. Reliability centered maintenance. U.S. Department of Commerce National Technical Information Service and United Air Lines Inc., San Francisco, CA: Dolby Access Press. [ Links ]
[58] O'Halloran, B. and van Bossuyt, D.L. 2020. How do systems fail? in: 2020 Annual Reliability and Maintainability Symposium (RAMS), Palm Springs, CA, USA, pp. 1-6. https://doi.org/10.1109/RAMS48030.2020.9153715. [ Links ]
[59] Odu, G.O. 2019. Weighting methods for multi-criteria decision making technique, Journal of Applied Science Environment Management, 23(8), pp. 1449-1457. DOI: 10.4314/jasem.v23i8.7 [ Links ]
[60] Ormrod, J.E. 2011. Common sense isn't always sensible: Reasoning and critical thinking, in: Our minds, our memories, New York: Pearson Education, pp. 151 -183. [ Links ]
[61] Pfaffel, S., Faulstich, S. and Shawn, S. 2019. Recommended key performance indicators for operational management of wind turbines, Journal of Physics Conference Series, 1356(1): 012040. DOI: 10.1088/1742-6596/1356/1/012040. [ Links ]
[62] Pfeffermann, D. 1996. The use of sampling weights for survey data analysis, Statistical methods in medical research. 5(3). 239-261. DOI: 10.1177/096228029600500303. [ Links ]
[63] Pintelon, A. and Parodi-Herz, L. 2008. Maintenance: An evolutionary perspective, in Complex system maintenance handbook, pp. 21-48, Springer: London. [ Links ]
[64] Porter, M.E. 1985. Competitive advantage, New York: Free Press. [ Links ]
[65] Pramanick, A.K., Das, G., Das, S.K. and Ghosh, M. 2017. Failure investigation of super heater tubes of coal fired power plant, Case Studies in Engineering Failure Analysis, 9, pp. 17-26. https://doi.org/10.1016/j.csefa.2017.06.001. [ Links ]
[66] P. Pyy. 2001. An analysis of maintenance failures at a nuclear power plant, Reliability Engineering & System Safety, 72(3), pp. 293-302. [ Links ]
[67] RSA. 2015. The Royal Society for Arts Manufacture and Commerce (RSA) great recovery & zero waste Scotland programme: North Sea oil and gas rig decommissioning & Re-use opportunity report Re-use opportunity report [online]. Available from: <https://www.thersa.org/globalassets/pdfs/reports/rsa-great-recovery---north-sea-oil-and-gas-report.pdf.> [Accessed 13 June 2021] [ Links ]
[68] Saunders, M., Lewis, P. and Thornhill. A. 2009. Research methods for business students, 5th ed. New York: Pearson Education Limited. [ Links ]
[69] Sheehan, C., Donohue, R., Shea, T., Cooper, B. and De Cieri, H. 2016. Leading and lagging indicators of occupational health and safety: The moderating role of safety leadership. Accident Analysis and Prevention, 92: pp. 130-138. [ Links ]
[70] Shigley, J.E. and Mischke, C.R. 1996. Standard handbook of machine design. 2nd edition. New York: McGraw-Hill. [ Links ]
[71] Stamatis, D.H. 2003. Failure mode and effect analysis: FMEA from theory to execution, 2nd ed. Milwaukee, Wisconsin: ASQ Quality Press. [ Links ]
[72] Subramanian, C. 2021. Leakage of gas oil from side cut piping in crude distillation unit of a petroleum refinery: An industrial case study, Journal of Pipeline Science and Engineering, 2(1). https://doi.org/10.1016/j.jpse.2021.05.001. [ Links ]
[73] Swearengen, J.C. and Lipkin, J. 1975. The effect of thermal excursions on the strength of aluminium alloys 6061 and 7075. Materials Science and Engineering. 19(1): pp. 105-113. https://doi.org/10.1016/0025-5416(75)90013-0. [ Links ]
[74] Thompson, M. K., Juel Jespersen, I. K., & Kjaergaard, T. 2018. Design for manufacturing and assembly key performance indicators to support high-speed product development. 28th CIRP Design Conference, 70, pp. 114-119. https://doi.org/10.1016/j.procir.2018.02.005. [ Links ]
[75] Torres, C.E.A.S., Santos, T.E. and Lins, V.F.C. 2020. Corrosion failures of austenitic and duplex stainless steels in a biodiesel plant, Revista Matéria, 25(2), pp. e-12620. [ Links ]
[76] UNIPEDE. 1991. Detailed descriptions of international performance indicators for fossil-fired power plants. Paris: UNIPEDE. [ Links ]
[77] van Volkenburg, C., Montgomery, N., Banjevic, D. and Jardine, A.K. 2014. The effect of deterioration on spare parts holding, Reliability and Maintainability Symposium, pp. 1-6. https://doi.org/10.1109/RAMS.2014.6798445. [ Links ]
[78] VGB. 2019. Technical and Commercial Key Indicators for Power Plants. 9th edition. VGB (VGB-S-002-03-2019-10-EN). Essen: VGB PowerTech e.V. https://www.vgb.org/shop/s002-03e-ebook.html?_store=en&_from_store=default [ Links ]
[79] Vora, K.G. 2020. Why a run-to-fail strategy is not good practice for SIS? In IOP Conference Series: Materials Science and Engineering, Volume 715, 3rd International Conference on Material Engineering and Advanced Manufacturing Technology 26-28 April 2019, Shanghai, China, 715(1 ):01205. IOP Publishing. [ Links ]
[80] Weber, A. and Thomas, R. 2005. Key Performance Indicators: Measuring and Managing the Maintenance Function, Ivara Corporation, Burlington, Ontario: Ivara Corporation. [ Links ]
[81] Wulpi, D. J. 1999, Understanding how components fail, 2nd ed. Materials Park, Ohio: ASM International. [ Links ]
[82] Yansaneh, I.S. 2003. Construction and use of sample weights. New York: United Nations Secretariat, Statistics Division. Report no ESA/STAT/AC.93/5. https://unstats.un.org/unsd/demographic/meetings/egm/sampling_1203/docs/no_5.pdf. [ Links ]
[83] Zardari, Z.B., Ahmed, N.H., Shirazi, K., and Yusop, S.M. 2015. Weighting methods and their effects on multi- criteria decision making model outcomes in water resources. New York: Springer International Publishing. [ Links ]
[84] Zuzek, B. and Burja, J. 2019. Failure of a coal transportation conveyor belt pulley. Engineering Failure Analysis, 106:104143. [ Links ]
Submitted by authors 11 Aug 2021
Accepted for publication 07 Jul 2022
Available online 29 Jul 2022
ORCID® identifiers
S.D. Koloane: 0000-0002-0043-4445
G.M. Kanakana-Katumba: 0000-0001-7475-2131
R.W Maladzhi: 0000-0003-3773-8538
* Corresponding author: 44186525@mylife.unisa.ac.za

