


Services on Demand
Article
 English (pdf)
 Article in xml format
 Article references
Indicators

Related links
-
 Cited by Google
 -
 Similars in Google
Share

 Permalink
South African Journal of Industrial Engineering
On-line version ISSN 2224-7890
Print version ISSN 1012-277X
S. Afr. J. Ind. Eng. vol.33 n.2 Pretoria Jul. 2022
http://dx.doi.org/10.7166/33-2-2641
GENERAL ARTICLES
Demonstrating how a high-growth framework could be used to assist a social enterprise to identify growth factors and improve sustainability
J.R. BoschI; C.N. NgongoniI; S. GrobbelaarI, II, *
IDepartment of Industrial Engineering, Stellenbosch University, South Africa
IIDSI-NRF Centre of Excellence in Scientometrics and Science, Technology and Innovation Policy (SciSTIP), Stellenbosch University, South Africa
ABSTRACT
Social enterprises are critical players in economic growth and service delivery. This article presents a tool that helps to identify the aspects that affect the sustainability of social enterprises. The tool is based on a framework that identifies high-growth factors and that uses the CRISP-DM (Cross-industry standard process for data mining) methodology and mutual information analysis to develop a practical tool to support social enterprises' viability and sustainability. The tool was applied to a case study to exemplify how practitioners and business owners could use it. In addition, this article shows how scholars could gain additional insights from data that had been previously analysed using a different methodology.
OPSOMMING
Maatskaplike ondernemings is kritieke rolspelers in ekonomiese groei en dienslewering. Hierdie artikel stel 'n instrument voor wat help om die aspekte te identifiseer wat die volhoubaarheid van maatskaplike ondernemings beïnvloed. Die instrument is gebaseer op 'n raamwerk wat hoë groei-faktore identifiseer en gebruik die "CRISP-DM" (Kruis-industrie standaard proses vir data ontginning) metodologie en wedersydse inligtingsanalise om 'n praktiese hulpmiddel te ontwikkel wat maatskaplike ondernemings se lewensvatbaarheid en volhoubaarheid ondersteun. Die instrument is toegepas op 'n gevallestudie om te toon hoe praktisyns en sake-eienaars dit kan benut. Boonop wys hierdie artikel ook hoe vakkundiges bykomende insigte kan verkry uit data wat voorheen deur 'n ander metodologie ontleed is.
1 INTRODUCTION
Poverty is a persistent problem, with over 734 million of the global population estimated to be living in extreme poverty [1]. According to the World Bank, these people live under US$2 a day daily in low-income countries, US$3.20 in lower-middle-income countries, and US$5.50 in upper-middle-income economies [1]. More than 40 per cent of these live in developing countries, mainly in sub-Saharan Africa, and can be referred to as the 'base of the pyramid' (BOP) [2]. Moreover, according to a progress report on the first Sustainable Development Goal, which tackles poverty, the COVID-19 pandemic and natural disasters are expected to have an overwhelming effect on global unemployment levels and so exacerbate poverty [3]. As a result, over 71 million additional people are expected to live under the poverty datum line [3]. These numbers are increasingly concerning.
Given the consensus that small, medium, and micro-sized enterprises (SMMEs) contribute to the growth of economies, growing SMMEs are good candidates for contributing to poverty alleviation in sub-Saharan Africa. SMMEs that focus on creating social value are critical even to improving service delivery. These enterprises contribute in two ways: first, they can create jobs that provide income to people in need, either directly or indirectly; and second, they can provide access to much-needed goods and services to BOP markets, which are often underserved. SMMEs are better positioned to co-create value easily with the BOP market [2]. Therefore, it would be a worthwhile effort to increase the potential for SMMEs to succeed in the fight against poverty.
In developing countries such as South Africa, SMMEs are responsible for 28 per cent of the jobs [4]. This, however, is lower than the international trend of around 60-70 per cent [4], which indicates that there might still be potential for SMMEs to contribute a greater share of job creation and elevate a significant proportion of the BOP to make ends meet. The BOP presents a riskier business environment, thus making it difficult for SMMEs to perform well. This was noted by Ver Loren van Themaat [5], who stated that the BOP presents a vast and largely untapped market with few or no competitors, thus acting as a massive uncontested market space with many nuances and unique attributes that make it initially more difficult to traverse with any measure of success. It is often difficult to do business in countries with large BOP markets, primarily because of macro-environmental factors that are difficult to quantify or measure. Thus there is a need to assist SMMEs, particularly those that serve the BOP, to succeed in such environments [6].
1.1 Study aim and objectives
This study arises from two main perspectives. First, it is essential to formulate frameworks and tools for SMMEs that are simple to understand and user-friendly for business owners. This pertains to the issues to do with using the framework for the sustainability of their businesses. Nevertheless, as with quite a substantial number of academic frameworks, the use of such tools in running SMMEs is rare. This is because business owners or SMME practitioners lack the time or expertise to comprehend and apply such frameworks in their contexts. Thus the premise of this paper was to show how practical tools can be generated from such frameworks and so make application possible. Therefore, frameworks - such as the high-growth framework that was developed to assist SMMEs serving the BOP - could be simplified to make them more accessible to SMMEs with insufficient capital or access to consultants [7], [8]. This would mean that owners and managers could use the framework without requiring outside assistance.
Second, this study re-analysed and re-used a comprehensive survey gathered from Van der Merwe's [7]-[9] data collection through data-mining techniques. The data was collected across 57 SMMEs that conduct business with the BOP market. Re-using data allows one to build on the work of others and to minimise duplication efforts while re-analysing the evidence and verifying the results [10]. Furthermore, it helps other scholars to leverage resources [11] and enhance their research visibility [12]. This is one of the core premises of this paper. It looks afresh at the high-growth framework and at the data that was collected during the formulation of the framework. The key question this article tries to address is: Can a high-growth-framework-based tool demonstrate how data analytics tools can be used to assist an SMME in identifying areas of required growth?
Thus the primary objective of this article is to use data analytics tools and to present the conceptual design and development of a tool to support BOP-serving SMME owners, managers, and practitioners to increase their enterprise's potential to grow faster and more sustainably. Of paramount importance is that the tool should be easily accessible so that enterprises with few disposable resources or little access to external assistance (e.g., consultants and incubators) can use it, and it should be so easy to use that minimal background knowledge is needed. This requirement is set for it to be accessible to the largest possible number of BOP-serving SMMEs. It was important to measure the relationship between the enterprises' perception of each growth factor covered in the high-growth framework and the success of the respective enterprises.
2 LITERATURE REVIEW
2.1 The high-growth framework
This study builds on work done by one of the authors to develop the high-growth framework (HGF), which was formulated by Michael van der Merwe during his doctoral studies to look at the BOP market [7]-[9]. This comprehensive framework was created with the aim of guiding SMMEs that operate in the BOP towards sustainable high growth. It was formulated from a systematic literature review that identified more than 25 factors from 46 studies that reflect on factors related to high growth. Studies at the time of developing the HGF tended to be focused on the roles of multi-national corporations, while very few studies considered the role of SMMEs and their role in and the development of business models for contextually specific enterprises [23].
A grounded theory approach, coupled with interviews and survey validation, was followed to identify six core focus areas (categories) that formed the basis of a practical framework to evaluate SMMEs at the BOP and to assist with the areas that needed improvement [7]-[9]. This of course draws on significant areas in the academic literature, and is discussed in more detail in the sections that follow.
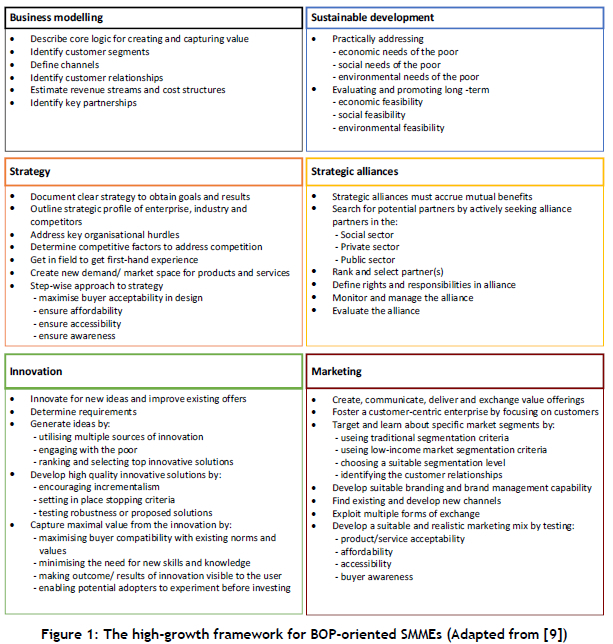
The framework comprises many sub-systems, each containing purposeful action-orientated activities related to one of the previously mentioned growth factors. The terminology of 'system' is also used because of Van der Merwe's soft systems methodological approach. Each sub-system can be seen as an individual input-process-output system, with each having multiple processes and, furthermore, with each process having steps in the form of even more sub-processes. Ultimately this creates a layered structure in the master system, which is the framework that contains all the sub-systems: business modelling; business strategy; innovation; marketing; strategic alliances; and sustainable development. An outline of the subsystems and their corresponding activities is shown in Figure 1.
2.1.1 Business modelling
This sub-system aims to develop a viable and all-encompassing business model for operating at the BOP that ensures consistency, synergy, and fluidity among its operations [7]. The business modelling sub-system is based on the famous business model canvas developed by Osterwalder and Pigneur [13], which acts as a blueprint on customer information, value offerings, partnerships, infrastructure, key activities, and financial structures are present. The business model canvas has been widely recognised as a reputable and all-encompassing view of an enterprise because of its logical groupings of an enterprise's key areas [7]. The sub-system uses information about the enterprise, the market, strategic alliance partners, and the leaders and employees of the SMME as input. The business model requires constant updating over time, especially while the company is in the start-up stage, when the enterprise is greatly in need of guidance and has not yet formed into a set structure. As the enterprise becomes more mature, the process must be continually updated to ensure that appropriate action is taken to conceptualise and implement the business model.
2.1.2 Sustainable development
The purpose of this sub-system is to ensure that the activities in the enterprise are sustainable by fostering developments that are in accordance with sustainable economic, social, and environmental principles. This sub-system needs constant attention to ensure that the outcome of the enterprise and its operations remains sustainable and is congruent with the requirements of sustainable development. The input of the sub-system is natural resources and the proposed developments of the enterprise and its alliance partners. In essence, this sub-system ensures that changes to the enterprise and its operations are financially, socially, and environmentally sustainable, thereby promoting its long-term business feasibility [14].
2.1.3 Business strategy
The framework uses the 'blue ocean' strategy paradigm in the BOP strategy as an activity system to find an uncontested market space, minimise costs, and maximise value at the BOP [15]. This sub-system aims to identify or create blue oceans of uncontested but underserved BOP market space. The input of the subsystem is market information about alliance partners, competitors, and customer segments, which will assist in creating new value offerings rather than competing with existing enterprises.
2.1.4 Strategic alliances
This area of attention aims to foster and develop safe and productive relationships and alliances with strategic partners. It addresses the key areas when forming strategic alliances. The input of the sub-system is information about the market, available resources, competencies, and the key capabilities of the focal enterprise and potential partnering companies.
2.1.5 Innovation
Innovation at the BOP is often incremental, with a focus on diffusion, local needs, demand, and customer suitability [16]. This sub-system's purpose is to ensure that the innovation process of the enterprise for the BOP is improved, whether it be through radical or continuous innovations [17]. The input of the sub-system is available resources, information about the market and competitors, and preliminary value offerings.
2.1.6 Marketing
The purpose of the marketing sub-system is to arrive at a viable value offering to which the BOP would be attracted. It does so by ensuring that the market is large enough and that the real needs of the BOP that are of value are addressed [18]. Only in this way will a value proposition be valuable to both the BOP and the enterprise. The input of the sub-system is information about the market and competitors as well as about infrastructure, alliance partners' marketing capabilities, and the potential value offering.
3 RESEARCH DESIGN AND METHOD
The study used the cross-industry standard process for data mining (CRISP-DM) as a methodology, and integrated mutual information (MI) analysis in the modelling stage. The dataset that was used was obtained from Van der Merwe's thesis, which also included a survey that was conducted to validate the high-growth framework for SMMEs. It contained 57 responses with 166 attributes per response. This survey data was gathered and captured according to the six growth-factor categories of the HGF, as mentioned earlier in this article. The survey responses had been collated and stored using Microsoft Excel in Tandem; then Orange - an open-source data visualisation and machine-learning application based on Python - was used to explore the dataset and to gain insight and understanding. The dataset was divided into three parts, as discussed in the CRISP-DM methodology section below.
3.1 CRISP-DM
CRISP-DM is a six-stage industry-proven way to guide data mining efforts. It comprehensively covers the life cycle of data-mining projects. It has been used as a methodology that includes descriptions of the typical phases of a data-mining project, including the tasks involved in each phase and explanations of the relationships between these tasks [19]. The stages are outlined in Figure 2.
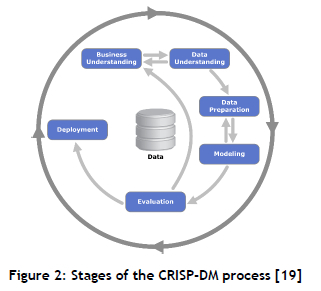
In this study it was used as a data-mining guide to the data that was acquired from the survey done by Van der Merwe as part of the validation of the HGF, which is explained per stage below, with more emphasis on the modelling stage that encompasses MI.
Business understanding: The study measured the relationship between enterprises' perception of each growth factor covered in the high-growth framework and the success of the respective enterprises. This was done by examining the owners' and managers' responses to a survey about their attitude towards the importance and urgency of each factor and its key requirements and the growth rate of their enterprise. It is important to note that the respondents were in a wide variety of industries, and that some industries were more represented than others.
Data understanding: The dataset was categorised and explored in three primary ways. The first part consisted of 11 questions and covered demographic and general information about the enterprise such as the classified industry, the number of employees, its size, age, and growth, as well as what role(s) the BOP plays in their enterprise. The second part measured the respondents' perceptions of the growth impact and managerial difficulty of their business practices, each associated with a growth factor covered in the framework, in the context of their enterprise. The third and largest dataset mainly measured the priority level and manner of implementation of each growth factor by using sets of action statements that were related to various business aspects of a single growth factor. These contributed the bulk of the 166 attributes of the dataset.
Data preparation: Most data entries were selected for analysis, with the exception of the two enterprises that were less than one year of age, and that would be excluded going forward, as they did not yet have a year-on-year growth figure, which is of paramount importance when comparing their answers with their growth. This left 55 entries in the dataset with 137 attributes; the overall quality of the dataset was very good, and so no data cleaning was necessary.
Modelling: The modelling was done using MI analysis, which will be explained in more depth in section 3.2.
Evaluation: A major issue with MI is that it becomes biased when some attributes have a larger number of unique values than others. This was not an issue in this use-case, however, as all the attributes had the same number of unique values. Notably, this technique does not differentiate between information gained from a positive correlation and that from a negative one. Therefore, each attribute was manually inspected to check whether it had a positive or negative correlation.
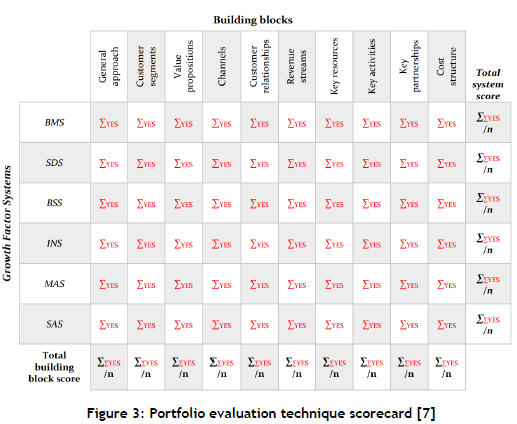
Deployment: A scorecard was populated as part of the analytics assessment section of the tool, and the scorecard questions were linked to the survey questions and stored in an Excel spreadsheet. The two sets of questions differed from each other in the sense that the survey questions aimed to understand the priority level and urgency of applying of business best practices related to the identified high growth factors, while the scorecard questions were general questions that assessed the strategic stance of enterprises with regard to the high growth factors. As such, the scorecard questions were linked with the business best practice(s) from the survey that best corresponded to each of them. The six growth factor categories are populated as shown in Figure 3, where the columns refer to the business model canvas building blocks.
Using this technique enables one to gain insights into which aspects are important in addressing how growth can be supported in SMMEs that serve the BOP. The next section outlines the change management tool that came out of the CRISP-DM process and the MI analysis.
3.2 Mutual information analysis
The modelling technique employed was mutual information (MI), which is a measure of the amount of information obtained from one random variable, given another variable [20]. In this study it was used to extract the information obtained about enterprise growth, or lack thereof, given the 'importance' and ' urgency' responses to each of the six growth factors. MI was used to develop weightings for business aspects related to the growth factors that were to be used in the tool. It should be noted that the response options related to the priority-level questions contained a combination of two binary aspects, importance and urgency (e.g., unimportant/urgent, important/urgent) that could be split potentially to gain more insight. In this context, as described in the survey, 'importance' was related to the perceived impact that the business aspect has on enterprise growth, and 'urgency' was related to the priority of time that is allocated to the business aspect.
MI is based on the concept of entropy in physics, in which the entropy between two variables is calculated as:

where I(Y|X) is the MI for variable Y and variable X, H(X) is the entropy for X, and H(Y|X) is the conditional entropy for Y given X. Thus the higher the MI, the better input X predicts outcome Y.
The entropy is calculated as:
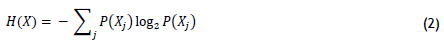
where P(Xj) is the probability that variable X takes the value j. Entropy will always be greater than or equal to 0. The lower the output, the lower the entropy; and the higher the output, the higher the entropy. In addition, the conditional entropy can be calculated as follows:
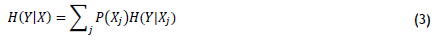
where H(Y|Xj) is the specific conditional entropy of variable Y, given that variable X takes the value j.
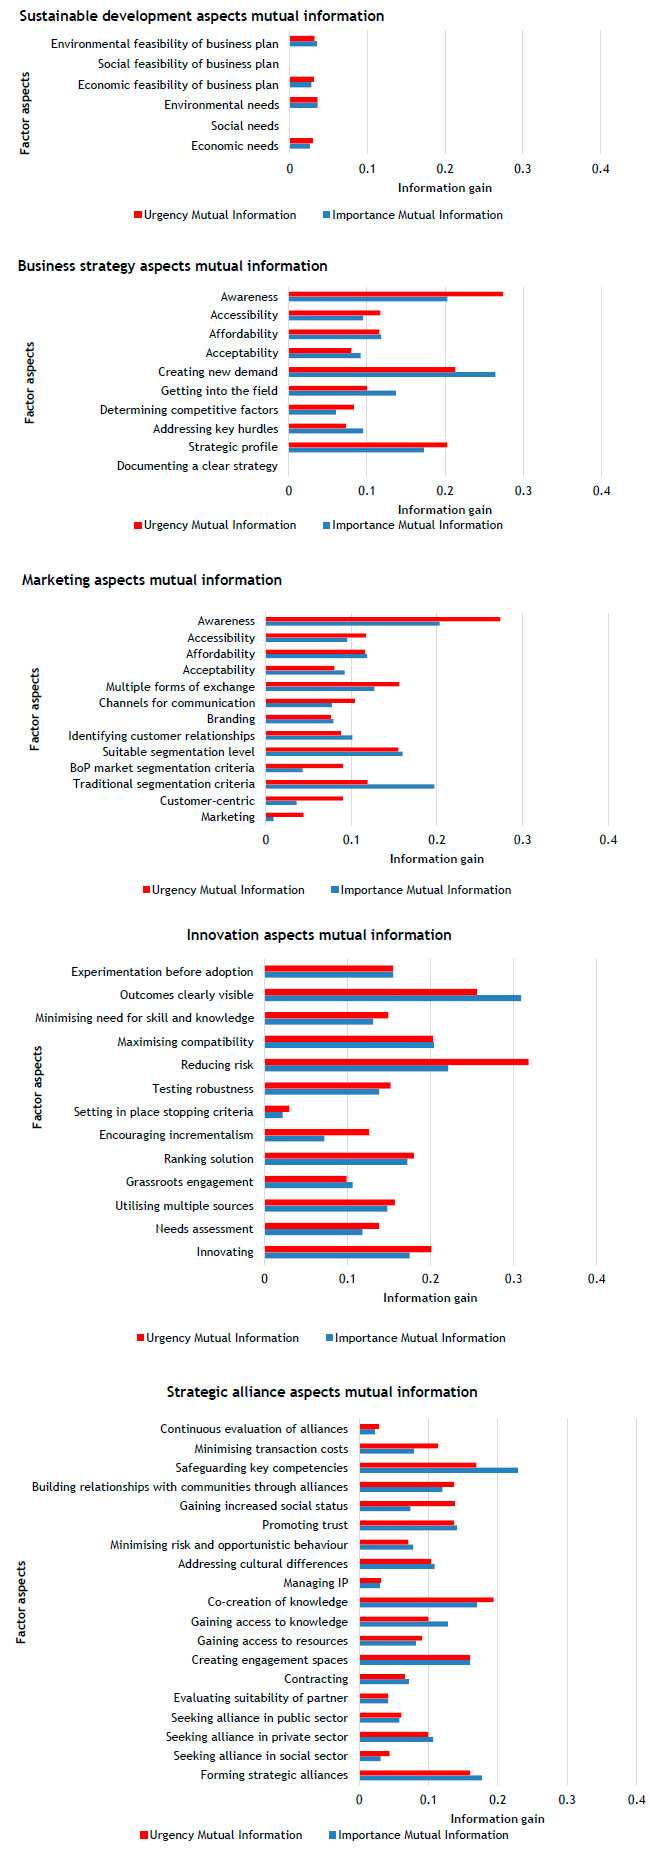
In this study the average MI of importance and of urgency was calculated for each business aspect, as well as the normalisation of the average against the highest unit. The entropy and relationship of each of the activities that were aligned with the six categories in the framework in respect of the importance of the activity and the urgency of actually allocating time to undertake the activity in order to have an impact on enterprise growth. Figure 4 shows the MI for business modelling: the key activities aligned with business modelling are outlined, and the importance and urgency of each of these activities - such as developing customer relationships and defining the channels that the SMME can use to reach customers - were averaged.
The algorithm was implemented in Python using the Pandas (for data manipulation) and NumPy (for mathematical functionality) packages, while the other five growth factors of sustainable development, business strategy, marketing, strategic alliances, and innovation are shown in the Appendix.
3.3 Enterprise engineering process
As a basis for the process that was used to develop the tool, we briefly present the enterprise engineering process (EEP) - a three-phased methodology that coordinates the strategic, operational, and organisational elements of an enterprise while progressing from the enterprise's 'as-is' state to its 'to-be-desired' state [21]. The process is applicable both to re-designs of existing enterprises and to greenfield designs when the enterprise does not yet exist. It is a culmination of best practices from various generic engineering design approaches that can be found in the literature [21].
The initiation phase is when management support needs to be obtained. This phase also identifies targets and defines entities in the enterprise that will be involved in the re-design process. In addition, the objectives, scope, and constraints are defined that will guide the rest of the process.
The second phase, the master planning, consists of three steps: as-is analysis, to-be concept design, and transition planning. The purpose of this phase is to identify and analyse problems and opportunities associated with the current state of the entities, and then to develop potential solutions to address or exploit them.
The third phase, deployment, involves the execution of the master plan by drawing up a detailed design and implementing it, after which the new norm is measured and optimised. An overview of the enterprise engineering process can be seen in Figure 5.
4 DEVELOPING A HIGH-GROWTH CHANGE MANAGEMENT TOOL: A CASE STUDY
The change management tool was formulated as the systemic process that the SMME owners and practitioners could follow. The steps were aligned to follow a five-step process that was clearly outlined and articulated for the SMMEs. The five-step process was based on the consolidation of the EEP (discussed in section 3.3 below) and the high-growth evaluation process that Van der Merwe included in the original framework. The incorporation of the EEP was to give a more holistic view of change management, over and above the high-growth evaluation process, in order to decrease the background knowledge and skillsets required to use the tool that consultants would otherwise have needed.
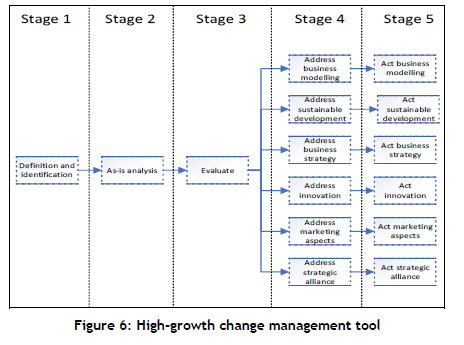
The MI analysis process helps to outline the evaluation as well as the essential aspects to analyse in the organisation. The proposed tool usage process is outlined in Figure 6 below and discussed in the subsequent sections. The stages in the tool are outlined as Stage 1, which is when the SMME identifies key stakeholders and the process to familiarise the users with concepts that are used in the HGF. Stage 2 entails the SMME doing an analysis of the current state of the enterprise, using the scorecards that are aligned with the HGF framework; the analysis then feeds into Stage 3 where the SMME is evaluated. After the evaluation, Stages 4 and 5 are when the different activities that need to be addressed in each category and under each action are undertaken under each of the respective stages.
This tool was tested in a case study of an SMME, referred to as 'Company X', a for-profit social enterprise with its headquarters near Cape Town that offers incubation, managing, and consulting to social enterprises and social innovation initiatives. The organisation does this through academic scholarship for social innovation; operating a knowledge hub for transdisciplinary governance and leadership; and setting up and managing living social labs in multiple communities around the eastern and southern coasts of South Africa. The company also has a platform that facilitates tailored learning journeys through sharing contextual knowledge and experiences for local and international groups. The SMME's founder evaluated the tool, and provided feedback on its limitations and on recommended improvements via email and telephone correspondence. The SMME's founder also agreed to follow partially the process employed in the tool; however, owing to time limitations, the founder could only answer the growth-factor-related questions in Stage 2 of the process; these will be expanded upon in the next section.
4.1 Stage 1: Definition and identification
The goal of this stage is to identify key stakeholders in the process to familiarise the users with the six growth aspects that are used in the HGF. In the case, the key stakeholders for one particular project that the SMME had worked on were identified and were listed with a description of their respective roles. The stakeholders were the project champion, the initiating sponsor, the steering committee, the implementation team, and the change management team. Note that SMMEs have a small number of employees, and so it might be necessary for a single person to fulfil multiple roles; or some roles might be redundant. For example, if an enterprise only has two employees, the role of change management team might not be necessary (as with other roles).
4.2 Stage 2: As-is analysis
To outline the current state of the SMME, the business model canvas was filled in by the SMME. The strategic intent architecture was also defined by outlining the vision, mission, values, objectives, strategies, and goals where the scorecard questions were answered. A standard business model canvas template was provided that the users filled in and documented in the format of an Excel file. The business model canvas was also extensively covered in the business modelling part of Stage 4; however, defining it here assisted the tool users when they answered the scorecard questions. The business owner answered the 170 questions about their enterprise, most of which came from the scorecard developed for the high-growth framework.
The questions were divided into the six growth factors, and were also linked with one or more of the nine building blocks of the business model canvas and with an additional category of a general approach. The original 359 questions listed in the high-growth framework were curated in this study and reduced to a more manageable number of questions. Any questions that required users of the tool to have a significant amount of background knowledge were removed. New questions were created when certain aspects of the high-growth factors were not sufficiently covered in the curated list of questions. The questions were then inspected to determine which business aspects of the growth factors they covered, and then weighted according to the normalised information gain determined in the CRISP-DM process. If a question was related to more than one business aspect, the average of those business aspects' weightings was taken. This was stored in the 'back-end' of the tool, which was hidden from the users.
In this case, the enterprise's conformance and alignment with the high-growth framework was tested from the scorecard. The summative scorecard may be seen in Figure 7. The summative scorecard analysis revealed that business strategy was the highest growth factor at 60 per cent, and the lowest growth factor was for marketing, at 27 per cent. The rest of the growth factors - business modelling, sustainable development, innovation, and strategic alliances - hovered between 40 per cent and 50 per cent. This showed that the SMME seemed to concentrate more on some aspects than on others, thus highlighting which areas needed attention.
As for the building blocks, they scored well for key resources, at 84 per cent, with revenue streams and cost structure being in the mid-60 per cent range. The lowest conforming building block was key activities, followed by channels.
4.3 Stage 3: Evaluate
The evaluation stage required the SMME to evaluate the generated scorecard and other associated information that was provided to identify which growth factors and building blocks to improve on and to determine the order in which to address them. Adherence to the high-growth framework on the scorecard was presented as a percentage for each growth factor and building block, with 100 per cent meaning total adherence and 0 per cent meaning no adherence. Furthermore, the percentages were conditionally formatted to display a colour gradient between green for the highest of the scores and red for the lowest. This was done to aid visually the decision-making process. The various scores for the business aspects that were important were depicted in a radar graph (Figure 8), which shows the extent of the imbalance of conformance. The same was done for the growth factors (also Figure 8), although an imbalance here is much less significant. The SMME could see that business modelling should be given the lowest priority for improvement, since it scored much better than the rest of the growth factors.
Next, each growth factor was individually assessed to determine the extent to which each related business aspect was in conformance with the HGF. First, the business modelling can be seen in Figure. There is a clear shortcoming in conformance with the HGF in defining the channels, identifying customer segments, and estimating the revenue streams and cost structure. This might seem contrary to what was shown in the summative scorecard, but it is important to consider that, in this case, the business aspects are directly related to the building blocks on the business model canvas and to how processes are mapped onto it; whereas the summative building blocks are used in a more abstract sense - meaning that they are used to indicate the structural areas of a business. The sustainable development aspects, seen in Figure, varied widely in conformance with the ideal set by the HGF. The economic feasibility and environmental needs of the BOP aspects were both in fairly good standing; however, because the economic needs of the BOP and the environmental feasibility were so much lower than the two mentioned above, this indicates that Company X had not reached a balance between what the BOP needed and the feasibility of the business plan to address those needs.
The business strategy aspects, seen in Figure 9, were all in moderate conformance with the HGF, excluding the accessibility and awareness business aspects. Company X should consider prioritising other growth factors above the business strategy. However, a re-evaluation of the abovementioned business aspects might be beneficial. Moreover, an inspection of the innovation aspects' radar graph in Figure 9 shows that the business aspects can be divided into two groups: one that is mostly in conformance with the HGF, and another that is only moderately in conformance with it. With the exception of setting up traditional segmentation criteria, the marketing business aspects were clearly not in conformance with the HGF. This growth factor should probably be addressed first, as Company X relies heavily on marketing to attract talent for its academic and professional sphere, talent and social entrepreneurs for its social business sphere, and inclusivity for the living social labs sphere.
The strategic alliances business aspects' conformance had a mixed outcome. Some notable outliers were minimising risk and opportunistic behaviour; gaining access to resources and seeking alliances in the public and social sectors were all in relatively good conformance with the HGF. Managing intellectual property and building relationships with communities through alliances were both in absolute divergence from the HGF. The rest are mostly in moderate conformance with the HGF. This growth factor sub-system should also receive high priority, as strategic alliances are fundamental to the goals and objectives of all spheres of the enterprise, as well as the overall goals of Company X.
Now that the enterprise had been evaluated and opportunities identified, the growth factors could be ranked to determine in which order they should be addressed in the following stage.
4.4 Stage 4: Address
During this stage, the SMME owner needed to address the growth factors in their enterprise, the selection and priority of which were determined in the previous stage. In this case study, the authors recommend that marketing be addressed first, followed shortly by strategic alliances. Thereafter, innovation, business modelling, and sustainable development should be addressed, in that order; and last should be business strategy.
4.5 Stage 5: Act
The final stage involved mobilising the change management teams to implement the findings, enterprise designs, and business processes that resulted from the previous stage. The teams were encouraged to implement pilot projects for larger implementations, because they could be used to smooth out the design and implementation problems before doing a full implementation.
Key performance indicators (KPIs) are a good tool to measure various aspects of business processes and functions. KPIs can act as feedback for improving and controlling the newly implemented designs and business processes. It is important, however, to start measuring the KPIs before implementation in order to have a better picture of the improvements brought on by the changes; and users are advised accordingly. KPIs are context- and enterprise-specific, and so the users will have to select and define KPIs independently that are specific and relevant to their enterprise.
5 DISCUSSION AND CONCLUSION
The primary objective of this article was, first, to use data analytics tools to re-analyse an existing and comprehensive survey dataset, to extract more data from it, and to present the conceptual design and development of a tool to support BOP-serving SMME owners, managers, and practitioners to increase their enterprises' potential to grow faster and more sustainably.
The tool was designed to be easily usable so that only the minimum background knowledge of the HGF would be required to use it. This was done, first, by using the information obtained in the data-mining process to fill in gaps where consultants (or extensive knowledge of the HGF) would have been needed; and second, using the enterprise engineering process, to guide the user to implement the tool.
Using the tool as a guide to which aspects need to be addressed is one starting point to ensuring the viability and sustainability of an SMME. Nevertheless, it is important to ensure that this is an inclusive process in the organisation, where training people who are impacted by the changes is an important component of implementation. This is to institutionalise the new architecture of the enterprise. Users are therefore encouraged to develop training material and training procedures to facilitate this institutionalisation.
This change management tool could be improved and developed further. Some opportunities for improvement are listed below; however, this list is not exhaustive.
Gather more responses to the survey on which the data mining was conducted. This would provide more accurate and credible results and weightings.
• Develop a user-friendly and practical interface for the tool that SMME owners and managers could use.
• Industry-specific tools could be created if there were sufficient responses per industry to do so.
• Explore other methods to attain weightings for the business aspects.
• Create a new set of questions for the tool that are simpler and shorter.
• Develop the tool on an alternative medium, such as an interactive website or desktop/mobile application.
• Develop a benchmark example application of the tool that users could use as reference.
Nevertheless, this does not negate how the tool could help to articulate and exemplify the ways in which practitioners could use data analytics tools to assist SMMEs.
REFERENCES
[1] C. Aguilar, R. Andres, A. Cojocaru, E.L.A. Howton, C. Lakner, M.C. Nguyen, M. Schoch, J. Yang and N. Yonzan World Bank, 2020, Poverty and shared prosperity 2020: Reversals of fortune. The World Bank Group. Available: https://policycomrnons.net/artifacts/1246008/poverty-and-shared-prosperity-2020/1801290/. [Accessed: 20 June 2022]. CID: 20.500.12592/89h550 [ Links ]
[2] C. K. Prahalad, 2021. Bottom of the pyramid as a source of breakthrough innovations, J. Prod. Innov. Manag., vol. 29, no. 1, pp. 6-12, doi: 10.1111/j.1540-5885.2011.00874.x. [ Links ]
[3] United Nations, 2021, Sustainable development goals report 2021. Available: https://unstats.un.org/sdgs/report/2021/. [Accessed: 20 June 2022]. [ Links ]
[4] SBI, 2018, The number of formal micro, small & medium businesses in South Africa. Available: https://www.smallbusinessinstitute.co.za/wp-content/uploads/2018/10/SBIbaselineAlert1final.pdf. [Accessed: 20 June 2022] [ Links ]
[5] T. ver Loren van Themaat, 2011, A business model development strategy to expand into the bottom of the pyramid population, MSc Thesis, Stellenbosch : Stellenbosch University. Available: https://scholar.sun.ac.za:443/handle/10019.1/6783. [Accessed: 01 August 2021]. [ Links ]
[6] J. M. Calton, P. H. Werhane, L. P. Hartman, and D. Bevan, 2013, Building partnerships to create social and economic value at the base of the global development pyramid, J. Bus. Ethics, vol. 117, no. 4, pp. 721-733, doi: 10.1007/s10551-013-1716-0. [ Links ]
[7] M. D. van der Merwe, 2017, The base of the pyramid: A growth framework for SMME action, PhD Thesis, Stellenbosch : Stellenbosch University. Available: https://scholar.sun.ac.za:443/handle/10019.1/102877 [Accessed: 31 July 2021]. [ Links ]
[8] M. D. van der Merwe, S. S. Grobbelaar, C. S. L. Schutte, and K. H. von Leipzig, 2018, Toward an enterprise growth framework for entering the base of the pyramid market: A systematic review, Int. J. Innov. Technol. Manag., vol. 15, no. 04, p. 1850035, doi: 10.1142/S0219877018500359. [ Links ]
[9] M. D. van der Merwe, S. S. Grobbelaar, I. A. Meyer, C. S. Schutte, and K. H. Von Leipzig, 2020, A framework of key growth factors for small enterprises operating at the base of the pyramid, Sustainability, vol. 12, no. 22, p. 9327. [ Links ]
[10] A. Soleimani, F. F. Nia, N. Naghshineh, and A. S. Nejad, 2021, Providing a framework for the reuse of research data based on the development dynamic framework of United Nations Development Program (UNDP), Libr. Hi Tech, 2021. doi: 10.1108/LHT-01-2021-0007. [ Links ]
[11] C. Thanos, 2017, Research data reusability: Conceptual foundations, barriers and enabling technologies, Publications, vol. 5, no. 1, p. 2. [ Links ]
[12] C. L. Palmer, N. M. Weber, and M. H. Cragin, 2011, The analytic potential of scientific data: Understanding re-use value, Proc. Am. Soc. Inf. Sci. Technol., vol. 48, no. 1, pp. 1-10. doi: 10.1002/meet.2011.14504801174. [ Links ]
[13] Y. Osterwalder, and A. Pigneur, 2010, Business model generation: A handbook for visionaries, game changers, and challengers. Chichester: John Wiley & Sons. [ Links ]
[14] C. Els, S. S. Grobbelaar, and D. Kennon, 2018, Redefining the role of SMEs in value creating ecosystems: Evidence from case studies, presented at the International Association for Management of Technology, IAMOT 2018 Conference Proceedings, 2018. [ Links ]
[15] W. C. Kim, 2005, Blue ocean strategy: From theory to practice, Calif. Manage. Rev. , vol. 47, no. 3, pp. 105-121. [ Links ]
[16] C. Foster and R. Heeks, 2013, Conceptualising inclusive innovation: Modifying systems of innovation frameworks to understand diffusion of new technology to low-income consumers, Eur. J. Dev. Res., vol. 25, no. 3, pp. 333-355, doi: 10.1057/ejdr.2013.7. [ Links ]
[17] C. M. Christensen, S. D. Anthony, and E. A. Roth, 2004, Seeing what's next: Using the theories of innovation to predict industry change, Harvard Business Press, pp.29-39. [ Links ]
[18] P. Kotler, and K. L. Keller, 2016 A framework for marketing management. Boston, MA: Pearson. [ Links ]
[19] R. Wirth and J. Hipp, 2000, CRISP-DM: Towards a standard process model for data mining, in Proceedings of the 4th International Conference on the Practical Applications of Knowledge Discovery and Data Mining, vol. 1. [ Links ]
[20] I. H. Witten, E. Frank, M. A. Hall, and C. J. Pal, 2017, Data transformations, in Data Mining, 4th ed., Elsevier, pp. 285-334. doi: 10.1016/b978-0-12-804291-5.00008-8. [ Links ]
[21] N. du Preez, H. Essman, L. Louw, C. Schutte, S. Marais, and W. Bam, 2015, Enterprise engineering toolset, 2015th ed. Stellenbosch: Stellenbosch University. [ Links ]
Submitted by authors 08 Oct 2021
Accepted for publication 04 Jul 2022
Available online 29 Jul 2022
ORCID® identifiers
J.R. Bosch: 0000-0002-5147-9993
C.N. Ngongoni: 0000-0001-8165-4169
S. Grobbelaar: 0000-0002-2793-9689
* Corresponding author: ssgrobbelaar@sun.ac.za
APPENDIX A


