


Services on Demand
Article
 English (pdf)
 Article in xml format
 Article references
Indicators

Related links
-
 Cited by Google
 -
 Similars in Google
Share

 Permalink
South African Journal of Industrial Engineering
On-line version ISSN 2224-7890
Print version ISSN 1012-277X
S. Afr. J. Ind. Eng. vol.33 n.1 Pretoria May. 2022
http://dx.doi.org/10.7166/31-1-2504
CASE STUDIES
Application of lean six sigma to a small enterprise in the Gauteng province: a case study
A.Y. MagodiI, II, *; I.A. DaniyanII; K. MpofuII
IDepartment of Industrial Engineering, University of South Africa, South Africa
IIDepartment of Industrial Engineering, Tshwane University of Technology, Pretoria, South Africa
ABSTRACT
The quest to improve customer satisfaction is one of the core aims of businesses in the competitive global market. This paper aims to apply the principles of Lean Six Sigma for continuous improvement in a small enterprise in the service industry in South Africa. A case study approach was used to carry out the investigation using the Lean Six Sigma 'define measure analyze improve and control' (DMAIC) approach. Data collection was done in a face-to-face interview and brainstorming session with the business owner and consultants. Observations and a time study were also used to collect additional data. The results showed a lack of knowledge and awareness of Lean Six Sigma among the business owner and the consultants. The commitment to and engagement of management in the project contributed positively to the implementation of the DMAIC approach. The process improvement changes were applied over a period of three months, after which the process performance was reviewed. The case study resulted in a 60.3% reduction in total non-value-added time and an increase in both the value-added time (53.85%) and the amount of uptime (10.74%). Furthermore, downtime was also reduced (47.7%). This study shows that the application of the Lean Six Sigma tool could solve the challenges of productivity and waste in a bookkeeping and tax consulting SME in the Gauteng province with a direct implication for operational efficiency and customers' satisfaction.
OPSOMMING
Die strewe om kliëntetevredenheid te verbeter is een van die kerndoelwitte van besighede in die mededingende globale mark. Hierdie artikel het ten doel om die beginsels van "Lean Six Sigma" toe te pas vir voortdurende verbetering in 'n klein onderneming in die dienste sektor in Suid-Afrika. 'n Gevallestudiebenadering is gebruik om die ondersoek te doen deur middel van "Lean Six Sigma" se DMAIC ('definieer meet, analiseer, verbeter en beheer) benadering. Data-insameling is gedoen in persoonlike onderhoude en dinkskrumsessie met die besigheidseienaar en konsultante. Waarnemings en 'n tydstudies is ook gebruik om bykomende data in te samel. Die resultate het 'n gebrek aan kennis en bewustheid van "Lean Six Sigma" onder die sake-eienaar en die konsultante getoon. Die verbintenis tot en betrokkenheid van bestuur by die projek het positief bygedra tot die implementering van die DMAIC-benadering. Die prosesverbeteringsveranderinge is oor 'n tydperk van drie maande toegepas, waarna die prestasie weer evalueer is. Die gevallestudie het gelei tot 'n vermindering van 60,3% in totale nie-waarde-toegevoegde tyd en 'n toename in beide die waardetoegevoegde tyd (53,85%) en die beskikbaarheid (10,74%). Verder is onbeskikbaarheid ook verminder (47,7%). Hierdie studie toon dat die toepassing van "Lean Six Sigma"- die uitdagings van produktiwiteit en vermorsing in 'n boekhou- en belastingkonsultasie-"SME" in die Gauteng provinsie kan oplos met 'n direkte verbetering vir bedryfsdoeltreffendheid en klante se tevredenheid.
1 INTRODUCTION
Six Sigma (SS) is a business strategy that is used to remove variations in processes, using statistical tools and methods [1]. SS is a data-driven quality management methodology that is aimed at improving processes, products, or services through the systematic identification and elimination of defects [2]. SS uses various approaches. For instance, 'define, measure, analyze, improve and control' (DMAIC) is a popular approach to SS application [3]. Others include 'define, measure, analyse, design, and verify' (DMADV); 'define, measure, analyse, design, optimise, and verify' (DMADOV); 'identify, characterise, optimise, and verify' (ICOV); 'identify, design, optimise, and validate' (IDOV); 'define, customer concept, design, and implement' (DCCdI); and 'define, measure, explore, develop, and implement' (DMEDI) [4].
For Shirey, Sullivan, Lines and Smithwick [5], 'DMAIC' is a proven quality improvement framework whose businesses to find a balance between the benefits roots lie in SS, but that is a suitable framework to follow in Lean Six Sigma (LSS) interventions. The SS DMAIC model was used for the continuous improvement of the case study firm's processes. The literature reflects the wide use of SS and the impact it has on businesses. According to Ertürka, Tuerdi and Wujiabudula [6], SS has the potential to improve the competitive advantage of an organisation; and a further conclusion from an empirical study was that the application of SS resulted in an increase in organisational performance. Gupta and Schultz [7] suggested that it is advisable for small of SS implementation and the training costs to make SS work. The Lean manufacturing principle is a systematic approach that is aimed at identifying and eliminating waste through continuous improvement by ensuring a consistent flow of products in line with the demand requirements [8].
The SS deals with the reduction of process variation, while the Lean management principles focus on waste reduction. The combination of SS and Lean management is referred to as 'Lean Six Sigma' (LSS). Although SS and Lean management principles focus on different things, their similarities are in the interests of the customer, Manville, Greatbanks, Krishnasamy and Parker [9]. The SS method is often combined with the Lean manufacturing approach to address the limitations of each approach. LSS can be successfully used to remove waste and defects and at the same time increase the speed of processes in a business [10]. This study demonstrates the application of the LSS tool in a bookkeeping and tax consulting business in Gauteng Province that falls into the category of small enterprises (SME). The aim of this study is to employ the LSS methodology for continuous improvement in an SME in the service industry in South Africa. The continuous process improvement includes the minimisation of waste, improved customer satisfaction, and operational efficiency in the firm. The study provides a practical guided approach to the implementation of the LSS approach for continuous improvement in an SME. The findings of this study could serve as a template for SMEs in their quest to achieve continuous improvement in their processes. The findings of this study could also assist SMEs to address issues relating to waste generation and poor operational efficiency that threaten their survival rate in South Africa.
The application of the LSS methodology to process improvement in a bookkeeping and consulting firm has not been sufficiently highlighted by the existing literature; thus this study contributes in both theory and practice to the field of industrial engineering. There is a need for SMEs to define, measure, analyse, and seek improvements and to exercise control of their processes to eliminate waste and improve their performance. The implementation of the LSS methodology as a continuous improvement tool could promote the competitiveness of SMEs.
2 LITERATURE REVIEW
Chakrabarty and Tan [11] argued that, regardless of the differences across services, there are common boundaries that provide an initial basis for service organisations to apply SS. MbizM [12] stated that many manufacturing and service-oriented organisations have experienced positive results from the use of SS. Aboelmaged [13] and Roriz, Nunes and Sousa [14] reported that several multi-national companies (MNCs) in the United States such as GE and Allied Signal have successfully implemented SS in response to managing the expectations of customers and the development of complex products. According to Shirey et al. [5], firms in several industries in North America, Europe, and Japan have followed the path of going lean, and have doubled their performance through the reduction of inventories, shorter output times, and decreased errors. The adoption of SS helps businesses to gain financial benefits and improve their productivity and customer satisfaction [1]. Several researchers identified a common benefit of an increase in the bottom line in companies that successfully implemented SS [6, 11, 15-16]. Some researchers have also agreed, on the basis of research findings, that SS has had a positive impact in the service industry [17-20]. Anthony [1] identified the potential benefits to be effective decision-making by management owing to the availability of data and facts, a reduction in misdirected problem-solving efforts and costs, a better understanding of the needs and expectations of customers, and efficient and reliable internal operations, leading to a greater market share and satisfied shareholders.
Some of the challenges of implementing Six Sigma in service include:
i) Data collection: The process of data collection and measuring, owing to the limitations of the manual data collection process [21-22].
ii) Difficulty in measuring the extent of customer satisfaction or dissatisfaction [15, 18].
iii) Resistance to change from staff members [21].
iv) The cost of setting up and implementing SS and providing resources being limitations in some cases [23].
Rajpurohit and Deshpande [24] reported the use of different tools for improved productivity in manufacturing sectors. Among the existing tools, the Lean tools were the most effective and efficient for improved productivity in any manufacturing sector. The application of Lean production principles and tools for improved quality in the production process has been reported [14].
The SS method is often combined with lean manufacturing, which then becomes LSS, to achieve operational excellence and a reduced generation of waste.
Shirey et al. [5] supported the application of LSS in healthcare services and argued that careful application and implementation can be used to reduce response time and so improve healthcare services. Go skills [25] identified the following organisational benefits of LSS: simplified business processes, reduced errors, effective decision-making, effective control action, prediction of performance, higher productivity, faster processes, better customer service, and higher customer satisfaction.
There are critical factors to be considered when applying LSS.
i) Management commitment: Top management commitment is a critical success factor for successful SS implementation [11, 25-27]. According to Manville et al. [9], it is important for top management to create opportunities for employees to initiate change, for example by providing training budgets. Top management commitment and linking LSS to business strategy were identified as top critical success factors.
ii) Training: Several scholars agree that employee training is critical to the successful implementation of SS. Continuous training is necessary to sustain improvements and to equip employees to develop a problem-solving approach to work [7, 28-31].
iii) Organisational culture: A new culture needs to be created to accept and make SS practice part of the business' processes [28, 30, 32-33].
Adeodu, Kanakana-Katumba and Maladzhi [34] used the LSS method for production process optimisation in a paper production firm in Nigeria. The study provided a practical guided approach for LSS implementation in solving the organisation's challenges relating to productivity and manufacturing. Chiarini [35] successfully implemented the LSS methodology for the risk management and cost reduction of cancer drugs in the health sector. Furterer and Elshennawy [36] also employed the LSS methodology in the health sector to reduce linen loss in an acute care hospital. In service firms, the use of LSS to address issues relating to quality, non-compliance, and customer satisfaction has been reported [30, 37-41].
LSS could be used in accounting and finance to address issues such as payment errors, invoicing errors, errors in inventory, inaccurate reporting of income, and inaccurate reporting of cash flow. Considerable financial gain is a major benefit of implementing SS in businesses.
Thus this study demonstrates the application of the LSS method to a bookkeeping and tax consulting SME in Gauteng Province. The organisation had 75 employees without any history of LSS training or implementation. There was evidence of waste generation and a decline in operational performance in the organisation; thus the application of LSS was potentially helpful in addressing these challenges. The rationale behind this study stems from the fact that South African SMEs are valuable as employers in the South African workforce [42]. Furthermore, SMEs offer training services and skill development opportunities for employees, and so play a vital role in the development of indigenous and human capacity. The SME sector employs 47% of South Africa's workforce, contributes more than 20% of the country's gross domestic product (GDP), and generates about 6% of corporate tax [43]. However, South African SMEs face a number of challenges, including their low survival rate: 80% of all small businesses fail within the first five years owing to sustainability-related issues of finance, management, competitive edge, and legal requirements [44]. The number of SMEs that are in business for less than three years gradually declined from 35% in 2008 to 26% in the first quarter of 2019 [45].
The findings in the literature show that positive results have been achieved following the application of LSS methodology in large-scale organisations. However, the application of the LSS methodology to SMEs has hardly been reported. In view of this, this paper demonstrates the practical steps for LSS implementation to bring about continuous improvement in SMEs.
3 METHODOLOGY
The LSS DMAIC approach was applied in this study. This study adopted a case study methodology with a bookkeeping and tax consulting SME in Gauteng Province. There was room for improvement in the firm because of its waste generation and inadequate operational efficiency. The choice of the case study methodology stemmed from the fact that it is flexible and allows both qualitative and quantitative analyses [34]. It is also more sensitive to organisations' plights and offers a suitable way to investigate the root causes of certain difficulties that organisations encounter [41, 46-50]. The case study approach permits direct observation and measurement, as well as data collection in the organisation being investigated [4951]. In this study, a real-time problem of customers' dissatisfaction was considered. The data collection focused on the firm's activities, such as company registration, data capturing, data verification, invoicing, enquiries, and consultation.
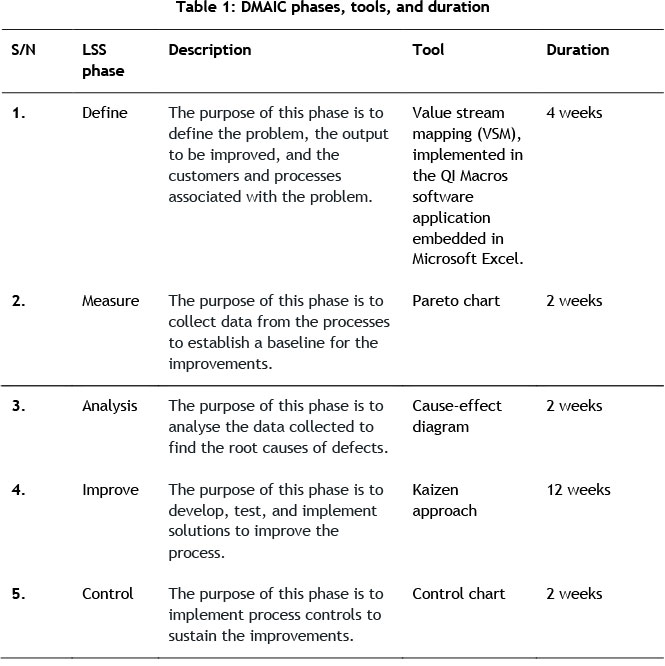
Lean tools such as value stream mapping (VSM), process cycle efficiency (PCE), Pareto charts, and Kaizen were employed to investigate the sources of waste in the organisation's processes. Previous studies have reported on the suitability of these tools to investigate and resolve sets of organisational challenges [38, 52]. The DMAIC approach of the Six Sigma methodology was used to enhance operational efficiency. DMAIC focuses on improving an existing process by incorporating five phases: define, measure, analyse, implement, and control. The LSS methodology was implemented with the aid of QI Macros software. The choice of the software stem from the fact that it is suitable for process mapping, and generation of charts to identify areas of improvement [53]. Table 1 presents the DMAIC phases, and the tools employed in this study.
3.1 Problem definition phase (Define)
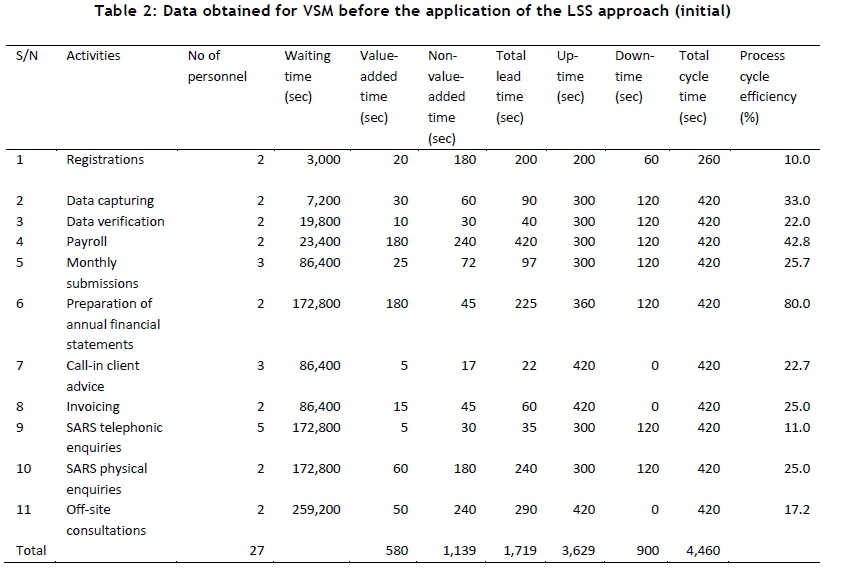
This is the problem identification and definition phase. In this case study, the problem to be solved entailed improving the process of bookkeeping and tax consultation to minimise delays and clients' waiting time. Value stream mapping (VSM) was used to provide an overview of the series of activities involved in the firm. VSM is a Lean tool that is suitable for the design and analysis information flow to enhance effective delivery to customers [54]. Furthermore, its application to reducing waste in an organisation's processes has been reported [34]. This is to provide insight into the areas where improvements are necessary. VSM was carried out using the QI Macros software application embedded in Microsoft Excel. QI Macros is a process control and continuous improvement application that enables the use of the LSS tools [55]. The VSM of the company's activities is listed in Table 2. The activities needed to be improved owing to significant waiting times. These activities would be measured again in the next phase for comparative analysis.
3.2 Measurement phase (Measure)
In the measurement phase, primary data were obtained from the consulting firm that provided the required information on the firm's activities. This was used to compute the lead time, the total cycle time, and the process cycle's efficiency (Table 2).
The lead time is the estimated time between the initiation and the completion of an activity, while the total cycle time is the time taken for the completion of an activity and sums up the uptime and the downtime.
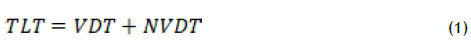
The total lead time, which sums up the value-added and the non-value-added times, is presented in Equation 1.
The total cycle time (TCT) is expressed as Equation 2.

TCT provides insight into the time required for the completion of activities and the lead time needed for customers' requests to be attended to. TCT is the sum of uptime (UT) and downtime (DT).
The process cycle time (PCE) is defined as the ratio of value-added time to the total time taken for an activity. This is expressed as Equation 3.
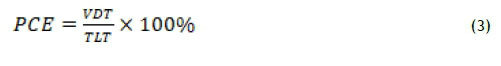
where:
PCE is the process cycle time (seconds), VDT is the value-added time (seconds), and TLT is the total lead time (seconds). PCE provides insight into some of the activities that add value to the operational processes, and into the non-value adding activities that constitute waste in the system.
This study assumed that there was no change in the organisation's management and employee structures, and that the organisation's assets and activities were constant throughout the processes of investigation. The Pareto chart was used to compare the initial PCE for the various activities, with the benchmark set at 90% (Figure 1).
The Pareto chart is a statistical tool that gives a visual indication of the activities that contribute significantly to outcomes [51-52]. The choice of the Pareto chart stemmed from the fact that it can translate the data obtained into bars that are arranged in descending order to determine the contribution of each of the activities to the overall outcome [51-52].
During the data collection process, the firm had set a PCE target of 90% for its various activities. This served as a benchmark for determining the activities with poor PCE, provided insight into the areas where continuous improvement was necessary, and quantified the percentage improvement required to achieve the benchmark. Table 2 below indicates the different processes and activities involved in the services rendered to clients. Clients are serviced differently according to their various requirements: some are once-off clients, others are retainer clients. Some clients are established with a lot of data to be captured and processed; others are new market entries with fewer administrative requirements. The firm renders services to both individuals and companies. Activities include registering new companies with the Companies and Intellectual Property Commission (CIPC); capturing clients' company information on the firm's systems; doing the calculations, compiling, and emailing pay slips to clients; doing monthly tax submissions; compiling clients' annual financial statements; attending to a range of customer queries; and conducting both on-site and off-site consultations.
3.3 Analysis phase (Analyse)
In this phase, the series of activities was analysed to identify the root cause of the problems that caused delays and low process cycle efficiency. The analysis phase involved interactions with the consultants, managers, and customers who were the key players. They expressed different views on the possible causes of delays, a summary of which is given in the cause-effect diagram in Figure 2. The diagram identifies six major causes of waste: material, environment, process, funding, people, and machine. The successful implementation of the PDCA tool in the improvement phase could solve the six challenges. This is in line with the findings of Adeodu et al. [34], who identified the potential sources of waste in an organisation as man, machine, method, and work organisation.
3.4 Improvement phase (Improve)
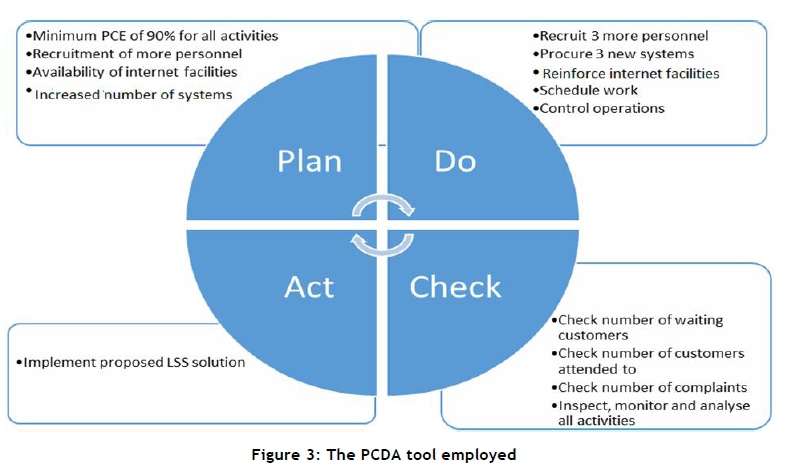
The improvement phase was carried out using the Kaizen approach - a continuous improvement tool that is designed to eliminate waste [34, 56]. In the context of this case study, any activity or time that does not add value to the service rendered is regarded as a waste. In particular, the Kaizen approach of 'plan, do, check, and act' (PDCA) was employed in this study (see Figure 3) to address the challenges identified in Figure 2. The first major source of waste generation was traced to material as a result of an interrupted supply chain. In the improvement phase, priority was given to availability and to reinforcing internet facilities to check interruptions in the supply chain. The issues relating to working environment (ergonomics issues) stemmed from the longer hours to which the personnel were subjected owing to interruptions and the limited number of systems. An increased number of systems and a stable internet facility would substantially address this issue in the improvement phase. The problem of poor monitoring and control identified in the analysis phase was traced to insufficient personnel (people). This could be solved by recruiting more personnel to oversee monitoring and control, work standardisation, process, and quality management systems implementation. This brought about an adjustment in the number of personnel allocated to each of the activities, with a resulting increase in process cycle efficiency (Table 3). Another challenge identified in the analysis phase was the issue of machines and poor work layout. In the improvement phase, the purchase of new systems that would be strategically positioned to ensure a flow of activities was necessary. It was envisaged that a proper implementation of the proposed PDCA tool could translate into improvements in the organisation's profitability, which was needed to address the funding-related issues identified in the analysis phase.
3.5 Control
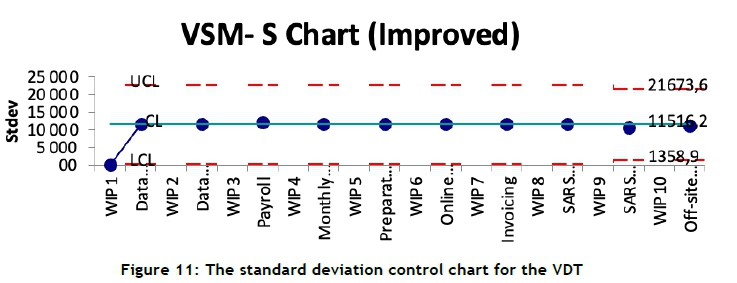
This phase employs control charts to keep process variations within the permissible limit. The control charts presented the projected average and the standard deviation of the total VDT; thus, with control charts, deviations from the ideal process could be easily noticed, traced, and rectified during the projected six-month period of investigation.
4 RESULTS AND DISCUSSION
Table 2 shows the initial VSM of activities for the consulting firm that was used as a case study. As can be seen in Table 2 - the data obtained for VSM before the application of the LSS approach (initial) - the total non-value-added time was estimated at 1,139 seconds, while the total value-added time was 580 seconds. Furthermore, the uptime was 3,639 seconds, the downtime was 900 seconds, and the total cycle time was 4,460 seconds. The total number of personnel engaged in the firm was 27. In addition, as shown in the Pareto chart (Figure 1), a majority of the activities fell below the minimum benchmark of 25% [57], thus indicating the need for continuous improvement.
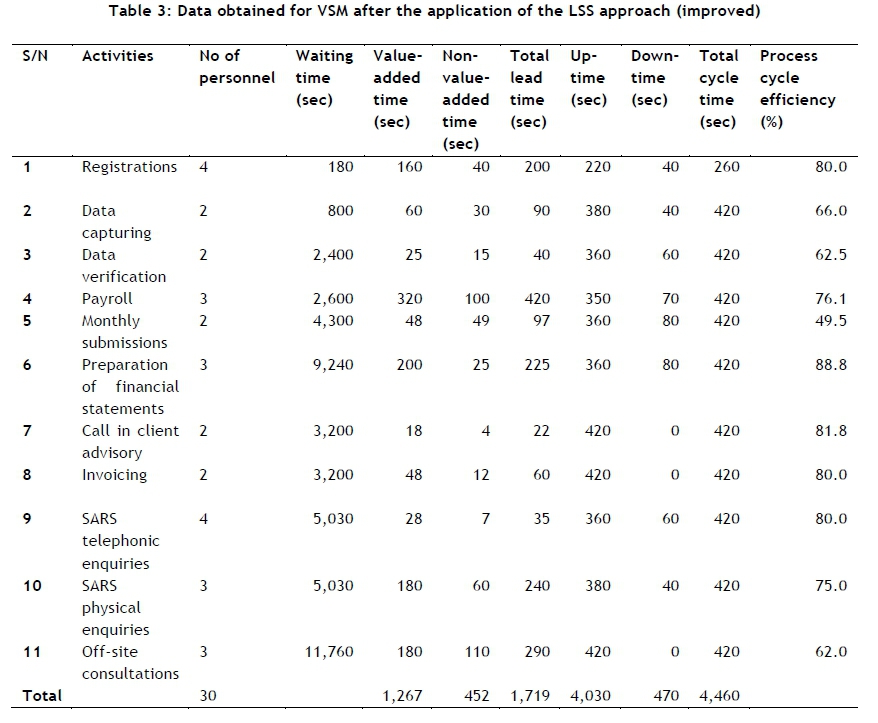
A considerable improvement in activities was achieved after applying the PDCA tool for process improvement, as can be seen in Table 3. The total non-value-added time showed a reduction from 1,139 seconds to 452 seconds, which accounted for a reduction of 60.3% in the total NVDT; while the total value-added time increase was from 580 seconds to 1,257 seconds - an increase of 53.85% in the VDT. Furthermore, the uptime increased from 3,639 seconds to 4,030 seconds, a 10.74% increase in the amount of uptime. The downtime reduced by 47.7%, from 900 seconds to 470 seconds. Following the identification of a shortage of human resources as one of the root causes of process delay, the staff complement was increased from 27 to 30 following the implementation of the PDCA approach. The number of computer systems was increased by three, along with the provision of extra internet facilities. The improvement in the VDT, uptime, and PCE, and the reduction in the NVDT and downtime could be partly traced to the increased staff strength.
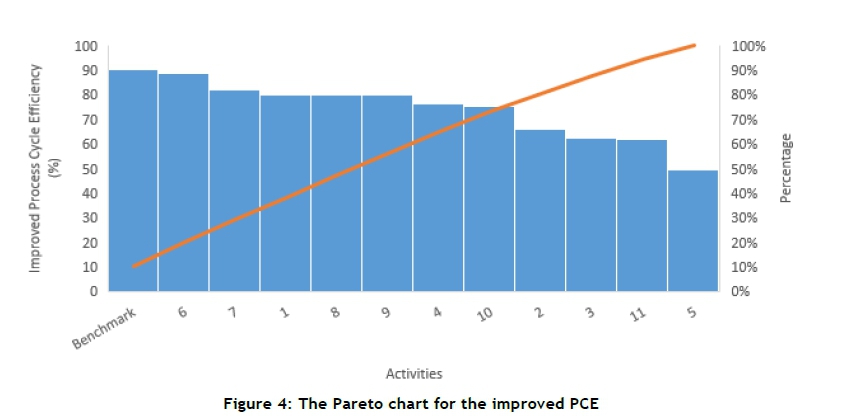
Figure 4 shows the Pareto chart for the improved PCE for the 11 activities (highlighted in Tables 2 and 3) in comparison with the benchmark of 90% set by the firm. It is clear that many of the activities were gradually progressing towards the benchmark, which indicated that there were continuous improvements in the firm's processes and activities.
Figures 5 to 9 compare the initial and improved VDT, NVDT, the up- and downtimes, and the PCE. The figures show significant increases in the values of the VDT and uptime, and significant reductions in the values of the NVDT, the downtime, and the improved PCE following the application of the LSS continuous improvement tools.
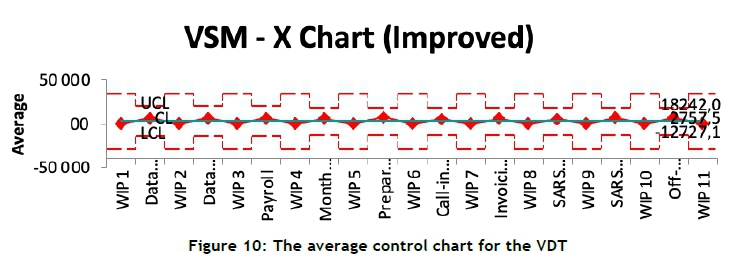
During the control phase, the control charts presented in Figures 10 and 11 for the average and the standard deviation of VDT respectively for a projected period were generated to observe and keep the variations in the VDT within the permissible limit.
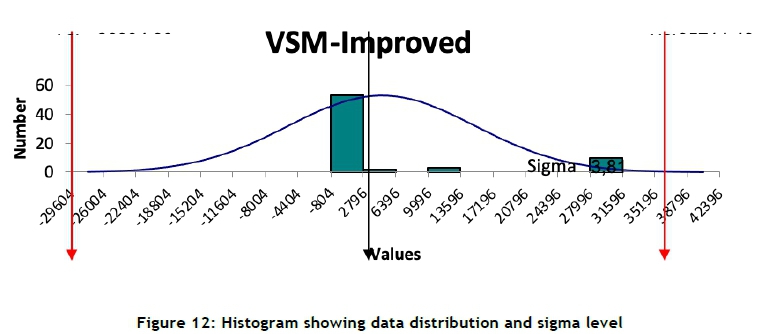
Figure 12 presents a visual representation of the frequency of the data for the improved process using a histogram. From the plot, the sigma level obtained was 3.81, compared with the initial sigma level of 2.80. The standard deviation and sigma level are indicators that provide insight into the present performance of the process. With this, the future performance of the process could be estimated from the previous data. The nature of the distribution of the plot was an indication of the degree of variation that would occur in the process over time. The sigma level of 3.81 obtained for the improved process implied that a significant improvement in the process had taken place, which translated to 6.7% defects in the system. A sigma level of less than 3 is usually not desirable [54]. The findings of this study on the suitability of the LSS approach for reduced waste and improved performance to enhance customer satisfaction agree with existing works on the implementation of LSS in various sectors such as health, manufacturing, education, and the banking sector [30, 36-39, 48, 58-64]. Takao et al. [16] also reported significant improvements with the use of the SS approach in the estimation of the value-added and non-value-added times, the total cycle and lead times, as well as the PCE, from the primary data obtained. In line with the findings of this study, the findings of those works also established the suitability of the LSS approach in achieving waste reduction and operational excellence in an organisation. Furthermore, the results of this study also agree with the position of some researchers that the LSS methodology can have a positive impact in the service industry [15-18].
The following lessons were learnt from this study.
First, waste can be generated by non-value-adding activities. The generated waste and the poor operational efficiency causing delays in the activities of the firm can be solved with the aid of the LSS methodology, which can provide an overview of the firm's processes with a view to improving productivity while eliminating waste. This agrees with the position of many authors on the suitability of the LSS methodology as a continuous improvement methodology for waste reduction and performance improvement [34-41]. Furthermore, the LSS application is not limited to manufacturing operations and the development of physical products. It can be extended to service-providing organisations, as in this case study, to eliminate waste and improve operational efficiency. It can also be extended to other firms to address issues such as payment errors, invoicing errors, errors in inventory, and inaccurate reports of income or cash flow. In addition, there is a need for organisations to define, measure, analyse, and seek improvements and to exercise control measures over the processes to eliminate waste and to improve performance. Thus, in order to gain a competitive advantage, there is a need for organisations to implement the LSS method as a continuous improvement approach. The improvement in process efficiency and the reductions in lead times and generated waste are necessary to maintain a good customer-client relationship [34].
5 CONCLUSION
The aim of this paper was to apply the principles of Lean Six Sigma to continuous improvement in an SME in the South African service industry. This was achieved through a case study approach and the use of the Lean Six Sigma 'define, measure, analyse, improve, and control' (DMAIC) approach. The continuous improvement through the application of the LSS to SMEs using a bookkeeping and tax consulting firm in Gauteng Province were demonstrated in this study. The results obtained indicated that the waste generated and the poor operational efficiency that caused delays in the activities of the firm could be solved with the aid of the LSS methodology. The Kaizen approach of the PDCA was employed and resulted in increasing the staff complement by three and the computer system by three. This resulted in a 60.3% reduction in the total NVDT, a 53.85% increase in the VDT, a 10.74% increase in the amount of uptime, and a 47.7% reduction in downtime.
This study has contributed to the body of knowledge in the field of LSS with a focus on South African SMEs. However, the study employed a single case study, which might not be sufficient to draw a general conclusion. The implementation of LSS in SMEs could produce a better alignment of organisational strategy to achieve continuous process improvements. However, the implementation of LSS as a continuous improvement tool in SMEs requires an upfront cost. Employees need to be trained to acquire the required expertise. For instance, there is a need for SMEs to have 'green belt' certification (personnel understand all Lean Six Sigma aspects, including competence in the DMAIC phases) and 'black belt' certification (as project leaders). Furthermore, LSS has dedicated tools and approaches that might be relatively inflexible about incorporating other tools. Future studies could consider the cost benefit of the proposed solution, and probe deeper into the reasons for the improvements in some activities compared with others.
6 REFERENCES
[1] Antony, J. 2006. Six sigma for service processes. Business Process Management Journal, 12:234-248. [ Links ]
[2] White, S.K. 2018. What is Six Sigma? Streamlining quality management. Available at: https://www.cio.com/article/3237692/six-sigma-quality-management-methodology.html. [Retrieved 22October 2020]. [ Links ]
[3] Omar, A. & Mustafa, Z. 2014. Implementation of six sigma in service industry. Journal of Quality Measurement and Analysis, 10:77-86. [ Links ]
[4] Zornes, T. & Hessing, T. n.d. Design for Six Sigma. Available at https://sixsigmastudyguide.com/design-for-six-sigma-dfss-dmadv/ [Retrieved 22 October 2020]. [ Links ]
[5] Shirey, W.T., Sullivan, K.T., Lines, B. & Smithwick, J. 2017. Application of Lean Six Sigma to improve service in healthcare facilities management: A case study. Journal of Facility Management and Research, 1:9-18. [ Links ]
[6] Ertürka, M., Tuerdi, M. & Wujiabudula, A. 2016. The effects of Six Sigma approach on business performance: A study of white goods (home appliances) sector in Turkey. Social and Behavioral Sciences, 229:444-452. [ Links ]
[7] Gupta, P. & Schultz. B. 2005. Six Sigma success in a small business. Quality Digest Magazine. Available at https://www.researchgate.net/publication/289527263_Six_Sigma_Success_in_a_Small_Business. [22 October 2020]. [ Links ]
[8] Das, S. & Patnaik, A. 2015. Production planning in the apparel industry. In Nayak, R. & Padhye, R. (eds), Garment manufacturing technology. Woodhead Publishing, pp. 81-108. [ Links ]
[9] Manville, G., Greatbanks, R., Krishnasamy, R. & Parker, D.W. 2012. Critical success factors for Lean Six Sigma programmes: A view from middle management. International Journal of Quality & Reliability Management, 29:7-20. [ Links ]
[10] Shuttleworth, C.C. 2015. Management support for the application of Lean Six Sigma methodology to improve customer satisfaction in a South African telecommunications company. Problems and Perspectives in Management, 13:205-214. [ Links ]
[11] Chakrabarty, A. & Tan, K.C. 2007. The current state of six sigma application in services. Journal of Service Theory and Practice, 17:194-208. [ Links ]
[12] MbizM. 2019. Companies that have successfully implemented lean six sigma. Available at: https://www.mbizm.com/companies-that-have-successfully-implemented-lean-six-sigma/ [Retrieved 17 September 2020]. [ Links ]
[13] Aboelmaged, M.G. 2010. Six Sigma quality: A structured review and implications for future research. International Journal of Quality & Reliability Management, 27:268-317. [ Links ]
[14] Roriz, C., Nunes, E. & Sousa, S. 2017. Application of Lean production principles and tools for quality improvement of production process in a carton company. Procedía Manufacturing 11:1069-1076. [ Links ]
[15] Hensley, R.L. & Dobie, K. 2005. Assessing readiness for six sigma in a service setting. Managing Service Quality, 15:82-101. [ Links ]
[16] Takao, M.R.V., Woldt, J. & Da Silva, I.B. 2017. Six Sigma methodology advantages for small- and medium-sized enterprises: A case study in the plumbing industry in the United States. Advances in Mechanical Engineering, 9:110. [ Links ]
[17] Nair, R. 2017. Six Sigma in service sector - A comprehensive review. Available at: https://www.greycampus.com/blog/quality-management/six-sigma-in-service-sector-a-comprehensive-review. [Retrieved 26 October 2020]. [ Links ]
[18] Nakhai, B. & Neves, J.S. 2009. The challenges of six sigma in improving service quality. International Journal of Quality & Reliability Management, 26:663-684. [ Links ]
[19] Peterka, P. 2013. Why Six Sigma will work in service environments. Available at: https://www.6sigma.us/six-sigma-articles/why-six-sigma-will-work-in-service-environments/ [Retrieved 26 October 2020]. [ Links ]
[20] Siddiqui, S., Ullah, F., Thaheem, M. & Gabriel, H.F. 2016. Six Sigma in construction: A review of critical success factors. International Journal of Lean Six Sigma, 7:171-186. [ Links ]
[21] Goh, T.N. 2002. A strategic assessment of six sigma. Quality Reliability Engineering International, 18:403-410. [ Links ]
[22] Gaur, J. 2009. The state of Six-Sigma in service processes: A literature review. The IUP Journal of Systems Management, 7:34-44. [ Links ]
[23] Benedetto, A.R. 2007. Adapting manufacturing-based six sigma methodology to the service environment of a radiology film library. Journal of Healthcare Management, 48:263-280. [ Links ]
[24] Rajpurohit, A. & Deshpande, V. 2019. Application of Lean tools in ceramic industry: A review. International Journal for Research in Applied Science & Engineering Technology, 7(14):2321-9653. [ Links ]
[25] Go Skills. n.d. What is Lean Six Sigma? Available at: https://www.goskills.com/Lean-Six-Sigma. [Retrieved 28 October 2020]. [ Links ]
[26] Rathilall, R. & Singh, S. 2008. A Lean Six Sigma framework to enhance the competitiveness in selected automotive component manufacturing organisations. South African Journal of Economic and Management Sciences, 21(2008), a1852. https://doi.org/10.4102/sajems.v21i1.1852. [ Links ]
[27] Psychogios, A.G., Atanasovski, J. and Tsironis, L.K. 2012. Lean Six Sigma in a service context: A multi-factor application approach in the telecommunications industry. International Journal of Quality & Reliability Management, 29:122-139. [ Links ]
[28] Kwak, Y.H. & Anbari, F.T. 2006. Benefits, obstacles and future of six sigma approach. Technovation, 26:708-715. [ Links ]
[29] Dale, B. 2000. Marginalization of quality: Is there a case to answer? The TQM Magazine, 12:266-274. [ Links ]
[30] Laureani, A. & Antony, J. 2012. Critical success factors for the effective implementation of Lean Sigma. International Journal of Lean Six Sigma, 3:274-283. [ Links ]
[31] Laosirihongthong, T., Rahman, S. & Saykhun, K. 2006. Critical success factors of six-sigma implementation: An analytic hierarchy process based study. International Journal of Innovation and Technology Management, 3:1-17. [ Links ]
[32] Erwin, J. 2000. It's not difficult to change company culture. Supervision, 61(2000):6-11. [ Links ]
[33] Coronado, A.R.B. & Antony, J. 2002. Critical success factors for the successful implementation of six sigma projects in organizations. The TQM Magazine, 14:92-99. [ Links ]
[34] Adeodu, A., Kanakana-Katumba, M.G. & Maladzhi, R. 2021. Implementation of Lean Six sigma for production process optimization in a paper production company. Journal of Industrial Engineering and Management, 14(3):73-89. [ Links ]
[35] Chiarini, A. 2012. Risk management and cost reduction of cancer drugs using Lean Six Sigma tools: Leadership in health services. Total Quality Management & Business Excellence, 25(4),318-330. [ Links ]
[36] Furterer, S. & Elshennawy, A.K. 2011. Implementation of TQM and Lean Six Sigma tools in local government: A framework and a case study. Total Quality Management & Business Excellence, 16(10):1179-1191. [ Links ]
[37] Bazrkar, A., Iranzadeh, S. & Farahmand, N.F. 2017. Total quality model for aligning organization strategy, improving performance, and improving customer satisfaction by using an approach based on combination of balanced scorecard and Lean Six Sigma. Cogent Business & Management, 4(1),1390818. [ Links ]
[38] Edgeman, R.L. 2010. Lean Six Sigma in service: Applications and case studies. Total Quality Management & Business Excellence, 21(10):1060-1061. [ Links ]
[39] Meza, D. & Jeong, K.Y. 2013. Measuring efficiency of Lean Six Sigma project implementation using data envelopment analysis at NASA. Journal of Industrial Engineering and Management, 6(2):401-422. [ Links ]
[40] Rakusa, S. 2016. Business process improvement using Lean Six Sigma: A example of improving the onboarding process. Master's dissertation, University of Ljubijani. [ Links ]
[41] Sanchez-Marquez, R., Guillem, J.M.A., Vicens-Salort, E. & Vivas, J.J. 2020. A systemic methodology for the reduction of complexity of the balanced scorecard in the manufacturing environment. Cogent Business & Management, 7(1),1720944. [ Links ]
[42] SEDA. 2016. The small, medium and micro-enterprise sector of South Africa. Available at: http://www.seda.org.za/Publications/Publications/The%20Small,%20Medium%20and% 20Micro%20Enterprise%20Sector%20of%20South%20Africa%20Commissioned%20by%20Seda.pdf, May 2020. [Retrieved 19 May 2020]. [ Links ]
[43] Liedtke, S. 2019. SME sector 'critical' to growing South Africa's economy - Pityana. Creamer Media Engineering News. Available at: http://m.engineeringnews.co.za/article/sme-sector-critical-to-growing-south-africas-economy-pityana-2019-04-11/rep_id:4433 [Retrieved 12 September 2019]. [ Links ]
[44] Bizbooks. 2008. I want my own business, consider this then. Available at: http://bizbooks.co.za/blog/?tag=south-africa-smme [Retrieved 19 August 2019]. [ Links ]
[45] SEDA. 2019. SMME Quarterly Update 1st Quarter 2019. Available at: http://www.seda.org.za/Publications/Publications/SMME%20Quarterly%202019-Q1.pdf [Retrieved 22 May 2020]. [ Links ]
[46] Krueger, D.C., Mellat, P.M. & Adams, S. 2014. Six Sigma implementation: A qualitative case study using grounded theory. Production Planning & Control, 25(10):873-889. [ Links ]
[47] Merriam, S.B. & Grenier, R.S. 2019. Qualitative research in practice: Examples for discussion and analysis. Hoboken, NJ: Jossey-Bass. [ Links ]
[48] Sunder M.V. & Mahalingam, S. 2018. An empirical investigation of implementing lean six sigma in higher education institutions. International Journal of Quality & Reliability Management, 35(10):2157-2180. [ Links ]
[49] Ingason, H.P. & Jónsdóttir, E.R. 2017. The house of competence of the quality manager. Cogent Business & Management, 4(1):1345050. [ Links ]
[50] Vinodh, S., Kumar, S.V. & Vimal, K.E.K. 2014. Implementing Lean Sigma in an Indian rotary switches manufacturing organization. Production Planning & Control, 25(4):288-302. [ Links ]
[51] Kumar, M. 2007. Critical success factors and hurdles to Six Sigma implementation: The case of a UK manufacturing SME. International Journal of Six Sigma and Competitive Advantage, 3:333-351. [ Links ]
[52] Antony, J., Antony, F., Kumar, M. & Byung, R.C. 2007. Six Sigma in service organizations: Benefits, challenges and difficulties, common myths, empirical observations and success factors. International Journal of Quality & Reliability Management, 24:294-311. [ Links ]
[53] Daniyan, I. A., Adeodu, A. O., Mpofu, K., Maladhzi, R, and M. G. Kana-kana Katumba, M. G. 2022. Application of lean Six Sigma methodology using DMAIC approach for the improvement of bogie assembly process in the railcar industry. Heliyon, 8 (e09043):1-14. [ Links ]
[54] Dash, R. 2020. A two stage grading approach for feature selection and classification of microarray data using Pareto based feature ranking techniques: A case study. Journal of King Saud University-Computer and Information Sciences, 32(2):232-247. [ Links ]
[55] QiMacros user guide. Available at: https://www.qimacros.com/pdf/QI-Macros-User-Guide.pdf. [Retrieved 1 September 2020]. [ Links ]
[56] Antoniolli, I., Guariente, P., Pereira, T., Ferreira, L.P. & Silva, F.J.G. 2017. Standardization and optimization of an automotive components production line. Procedía Manufacturing, 11:1120-1127. [ Links ]
[57] Ying, Z. 2011. Food safety and lean Six Sigma model. Master's dissertation, University of Central Missouri, USA. [ Links ]
[58] Shahada, T.M. & Alsyouf, I. 2012. Design and implementation of a Lean Six Sigma framework for process improvement: A case study. In: 2012 IEEE International Conference on Industrial Engineering and Engineering Management. IEEE, pp. 80-84. [ Links ]
[59] Ben Ruben, R., Vinodh, S. & Asokan P. 2017. Implementation of Lean Six Sigma framework with environmental considerations in an Indian automotive component manufacturing firm: A case study. Production Planning & Control, 28(15):1193-1211. [ Links ]
[60] Ahmed, S., Manaf, N.F. & Islam, R. 2018. Measuring Lean Six Sigma and quality performance for health care organization. International Journal of Quality and Service Science, 10(3):267-278. [ Links ]
[61] Albliwi, S.A., Antony, J. & Lim, S.A.H. 2015. A systematic review of Lean Six Sigma for the manufacturing industry. Business Process Management Journal, 21(3):665-691. [ Links ]
[62] Henderson, K.H. & Evans, J.R. 2000. Successful implementation of six sigma: Benchmarking General Electric Company. Benchmarking: An International Journal, 7(2000):260-281. [ Links ]
[63] AlManei, M., Salonitis, K. & Xu, Y. 2017. Lean implementation frameworks: The challenges for SMEs. Procedia CIRP, 63:750-755. [ Links ]
[64] Pearce, A., Pons, D. & Neitzert, T. 2018. Implementing lean: Outcomes from SME case studies. Operations Research Perspectives, 5:94-104. [ Links ]
Submitted by authors 11 Mar 2021
Accepted for publication 02 Feb 2022
Available online 06 May 2022
ORCID® identifiers
A.Y. Magodi 0000-0003-0820-9661
I .A. Daniyan 0000-0002-7238-9823
K.Mpofu 0000-0003-3429-7677
* Corresponding author yrambau@gmail.com

