


Serviços Personalizados
Artigo
 Inglês (pdf)
 Artigo em XML
 Referências do artigo
Indicadores

Links relacionados
-
 Citado por Google
 -
 Similares em Google
Compartilhar

 Permalink
South African Journal of Industrial Engineering
versão On-line ISSN 2224-7890
versão impressa ISSN 1012-277X
S. Afr. J. Ind. Eng. vol.33 no.1 Pretoria Mai. 2022
http://dx.doi.org/10.7166/33-1-2547
GENERAL ARTICLES
Selecting a public service delivery assessment tool for South Africa: an application of the AHP method
O. Ajayi*; M. De Vries
Department of Industrial & Systems Engineering, University of Pretoria, Pretoria, South Africa
ABSTRACT
Many service delivery performance assessment (SDPA) tools exist globally that address the need to measure actual performance against pre-defined standards and to take corrective action to improve service delivery. The purpose of this paper is to guide the selection of the most appropriate SDPA tool for South Africa. Given the overwhelming civic unrest linked to public service performance levels, a solution is needed urgently. This study therefore presents a scientific approach to the process of deciding on a shortlist of off-the-shelf solutions, based on the criteria of effectiveness, project, and technical, so that a decision on the most appropriate tool for South Africa can be made on the basis of the synthesised results and a sensitivity analysis. The analytic hierarchy process (AHP) is used, and the performance journey mapping (PJM) tool has been selected on the basis of criteria and sub-criteria that were also validated for their practicality.
OPSOMMING
Baie diensleweringsprestasie-evaluering (SDPA)-instrumente bestaan wêreldwyd wat die behoefte aanspreek om werklike prestasie teen voorafbepaalde standaarde te meet en om regstellende stappe te neem om dienslewering te verbeter. Die doel van hierdie artikel is om die keuse van die mees geskikte SDPA-instrument vir Suid-Afrika te lei. Gegewe die oorweldigende burgerlike onrus gekoppel aan staatsdiensprestasievlakke, is 'n oplossing dringend nodig. Hierdie studie bied dus 'n wetenskaplike benadering tot die proses om te besluit op 'n kortlys van kommersieel beskikbare oplossings, gebaseer op die kriteria van doeltreffendheid, projek en tegnies, sodat 'n besluit oor die mees geskikte hulpmiddel vir Suid-Afrika geneem kan word op grond van die gesintetiseerde resultate en 'n sensitiwiteitsanalise. Die analitiese hiërargieproses (AHP) word gebruik, en die prestasiereiskartering-instrument (PJM) is gekies op grond van kriteria en subkriteria wat ook vir hul praktiese toepassing bekragtig is.
1 INTRODUCTION
The public sector is the largest service provider, collectively and globally. With the explosion in the use of social media and increasing social activism, public sector customers (citizens) have become more aware of their rights, leading to heightened expectations of public service performance, accountability, and transparency. Given this new expectation, and citizens' frustration over poor public service delivery, governments all over the world are seeking ways to improve service delivery [1 -3]. A World Bank survey [4] of 39,000 households in 34 European and Central Asian countries reveals concerns over citizens' dissatisfaction with public service delivery, especially in Eastern Europe and Central Asia. Africa is no exception, as agitation for improved public service performance levels is much publicised [3, 5]. In South Africa, shortfalls in public service delivery are generally met with civic unrest, leading to significant economic losses and social discontent. To set the country on a solution pathway, the performance levels of service delivery must be measured with the aim of improving it. This calls for the application of appropriate diagnostic tool(s) to measure those performance levels [6]. Such tools must, however, satisfy validated sets of evaluation criteria to ensure that they are fit for purpose and deliver results. Although there is no shortage of diagnostic tools with evaluative criteria, what is lacking is a tool or set of tools that delivers verified results and that has been selected on the basis of a well-known and scientifically grounded approach. This study provides an opportunity for South Africa to be guided in selecting the most suitable public service delivery performance diagnostic tool, based on tested and proven approaches, and applying it with the rigour that such a matter of national importance deserves.
1.1 Problem validation
Public unrest arising from service delivery deficits is not unusual in many countries [3]. In South Africa, these social events and their consequential effects are often violent, and sometimes lead to police brutality and the loss of lives and valuable property. Many authors, communities of practice, and independent organisations in South Africa have suggested reasons (and sometimes solutions) for this conundrum; but the situation unfortunately continues unabated [5]. While Bratton [7] attributes the issue to a lack of accountability in government, Hunter [8] argues that service quality, not quantity, is responsible. For his part, Mdlongwa [9] outlines reasons such as a shortage of skills in government, capacity deficit, fraud, and maladministration, among others.
Given the reasons proposed for these public service arrears and shortfalls, we posit that they are significant and of national importance. To (re)develop just a few small townships in South Africa's Tshwane metro that were ravaged by public-service-related protests during 2014, the mayor indicated that it would require a minimum of R5.8 billion and take up to 25 years [10]. Similarly, Van Onselen [11] reported that the burning of public libraries during these incident of unrest would cost over R40 million in a review period of four years. The World Bank's [12] independent research on the accountability of South Africa's public service suggests that one of the major reasons for poor service delivery is an inadequate assessment (including monitoring and feedback) of the health of service delivery.
Given this finding, we argue that the application of a diagnostic tool to assess service delivery performance levels in South Africa is imperative. Since many tools exist for the same purpose, effort must be focused on selecting the best one for South Africa.
1.2 Research question and objectives
Based on the problems highlighted in the introductory parts of this study, the main research question is: Which service delivery performance assessment (SDPA) tool is most appropriate to aid in closing the public service delivery gaps in South Africa?
The study explores two objectives:
• Objective 1: Validate the practicality of the effectiveness, project, and technical criteria with the decision-makers.
• Objective 2: Involve key decision-makers in prioritising criteria from a list of validated criteria, selecting the most appropriate SDPA tool for South Africa.
As indicated by the research objectives, our contribution is not to offer a new theory. Rather, we demonstrate a scientific methodology, based on the analytic hierarchy process (AHP), to select an appropriate SDPA tool, thus contributing to a solution for a real-world problem.
2 LITERATURE REVIEW
This section explores the literature to discover existing service delivery performance assessment tools, and conducts a comparative analysis of popular multi-criteria decision-making methods to select the most suitable for the problem domain.
2.1 Existing service delivery performance assessment tools
There is no scarcity of service delivery performance assessment tools, since governments all over the world are keen to understand how well they deliver public services to their citizens. Table 1 (from a previously published work by the authors) outlines some of these tools and the sectors where they have been applied. The interested reader is referred to Ajayi and De Vries [13] for more detail about the initial selection process.
2.2 A review of multi-criteria decision-making methods
Multi-criteria decision-making (MCDM) is used to determine the performance of decision alternatives across several contradictory qualitative and/or quantitative criteria, resulting in a compromise solution [29, 30]. However, there are many techniques for MCDM, as revealed by Velasque and Hester [31 ] and Mardani et al. [32]. Figure 1 shows those identified by Mardani et al., with the AHP being the most frequently applied.
Given these numerous MCDM approaches, it is important to match a method to a problem class. This led to a comparative analysis of the most frequently used MCDM methods to determine which one was most suitable for this study.
2.2.1 MCDMs: Comparative analysis
Velasque and Hester [31] compare nine MCDM methods, based on their areas of application and a suitable problem class. For performance problem types, public policy and decision-making, and political strategy, their choice is the AHP. Their position is echoed and strengthened by Kraujaliene [33] in his comparative
analysis of MCDM methods to evaluate the efficiency of technology transfer, which also fits into our problem domain. On the practical application of the AHP to similar problem areas such as those in this study, Prusak et al. [34] built a model to assess public services in Poland using the same method, while others have applied it to the selection of tools, software, models, and products [35-43], as intended in this study.
No theoretical novelty is claimed in this study, but rather a build-up to one with a significance and impact that is of national importance. While critiques [44, 45] of the AHP caution its users about the risk of inconsistent scoring and rankings, Velasque and Hester [31] and Gavade [46] note that inconsistencies can be managed, given that the AHP can handle multiple decision-makers and capture the way people actually think. For his part, Whitaker [47] believes that the AHP will always produce the expected results if the priorities are correctly structured, since the procedures are coherent and logical. Other criticisms of the AHP have been addressed by Forman [48].
2.2.2AHP: Traditional AHP, fuzzy AHP and the ANP
Whereas the traditional AHP requires crisp knowledge and assumes experts' judgements to be exact, the fuzzy AHP (FAHP) is a synthetic extension, developed to handle fuzzy comparison matrices, with considerations for the fuzziness of the decision-makers. The analytic network process (ANP), on the other hand, is a direct extension of the AHP, such that elements are grouped into clusters of related factors/networks rather than hierarchical levels. Whereas the AHP is a model with a linear hierarchical relationship, the ANP enables complex interrelationships among decision levels and attributes [49-51].
2.2.3AHP: Motivation for choice
Given the problem domain and the attributes discussed in section 1.1, and a review of the literature [32], the AHP method was chosen for the following reasons:
1. Successful practical application to similar problem areas.
2. Simplicity (explanation of concept to local municipal officers is easy).
3. Controlled consistency.
4. Plausible result (decision-makers in agreement with emerging priorities).
5. Calculation is possible with an MS Excel spreadsheet.
These are in contrast to the ANP, in which the concept is difficult to explain to local municipal officials, the verification of results is impossible because of interrelationships, specialised software is required for the calculations, and the software is too complex to be used as a normal day-to-day tool for practical decision-making [52]. Mukherjee [53] reviews and analyses three different FAHP models, and concludes that the FAHP spoils rather than improves the outcomes because of the complexity and fuzziness that the method brings into the decision-making process.
3 RESEARCH METHODOLOGY
Through the application of the AHP technique and of qualitative research instruments, this study provides an opportunity for South Africa to be guided in selecting the most suitable public service delivery performance diagnostic tool. Data was collected to validate pre-evaluated criteria, while key municipal decision-makers were recruited for the pairwise comparison using the AHP approach.
3.1 The AHP method
Organising objectives, alternatives, and criteria into a multi-level hierarchical structure, the AHP was developed by Saaty [54-56], and enjoys popular application as a decision support system [57]. Such a system is almost inevitable, as the process of decision-making in real life often requires assessing multiple alternatives in relation to various criteria and sub-criteria [58, 59]. Saaty [60] notes that the AHP is a special case of the analytic network process (ANP). Whereas the ANP establishes a control criterion, using probabilities and likelihood in relative forms, the AHP applies a hierarchy of decision-making criteria that follows a linear top-down structure with no feedback from the lower to higher levels [60].
3.1.1 The AHP: Theoretical background
Saaty and Vargas [61] define four axioms as conditions for using the AHP:
1. The decision-maker can conduct a pairwise comparison, aij, of two alternatives, i and j.
2. One alternative is not infinitely better than another relative to a criterion: aij ≠∞
3. The model can be built into a hierarchy.
4. The goal, criteria, sub-criteria, and alternatives fit into the hierarchy.
Considering m evaluation criteria and n options to be assessed, the pairwise comparison matrix A is an m x m real matrix. The matrix can be defined as:
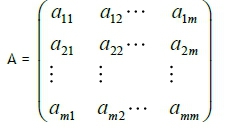
According to Saaty [54], for each entry in the criterion comparison matrix:
• ajk of matrix A is the weight of the jth criterion relative to the kth criterion
• jth criterion is more important than the kth criterion if ajk> 1
• jth criterion is less important than the kth criterion if ajk< 1
• jth criterion is equally important to kth criterion if ajk= 1
The normalised pairwise comparison matrix is averaged by m to derive the criteria weight vector, where:
3.1.2 The AHP: Step-by-step
The AHP can be explained by the following seven main steps [62, 63]:
• Step 1: Identify the overall objective - i.e., What is the main problem? What is to be achieved?
• Step 2: Identify criteria (and sub-criteria) that must be met to achieve the desired objective, following a participatory approach in which as many relevant participants as possible are co-opted.
• Step 3: Identify alternatives, also consolidating Steps 1 to 3 into a hierarchy framework in which the lowest level presents the alternatives.
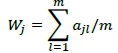
• Step 4: Derive priorities for all criteria, local priorities (preferences) for the alternatives, and overall priorities (synthesis) for the model. Data are obtained from decision-makers, using the comparative ratings in Table 2. For this step, data collection is required to inform pairwise comparisons. For this study, the expertise and experience of multiple decision-makers who met the recruitment criteria outlined in section 3.3 were relied upon to inform the pairwise comparison process.
• Step 5: Ensure the consistency of judgements by calculating the consistency index and the consistency ratio CR for the criteria and alternatives matrices. The CR of a consistent decision-maker should be 0.1 or less [54]. When multiple decision-makers are involved, a geometric consensus index (GCI) should be used to evaluate the consistency of the decision-making.
• Step 6: Perform sensitivity analysis -, i.e., determine how changes in the weights of the criteria affect the overall outcome.
• Step 7: Make the final decision, using the synthesised results and sensitivity analysis to inform the final decision.
3.1.3 Identifying and validating appropriate criteria
Selecting valid criteria (Step 2 in section 3.1.2) is no simple task. In the context of our study, there are many performance evaluation criteria for service delivery diagnostic tools in the literature. Through a focus group review session, relevant criteria (such as comprehensibility, comparability, and diagnostic ability) were subjected to a relevance analysis (published in 2018 by the authors) with the aim of understanding whether they would be relevant in the South African context. In addition, each criterion was now defined (taking the South African context and vernacular into consideration), interpreted, and validated. These could be classified as effectiveness criteria.
We believe that two additional categories of criteria are needed: project criteria (cost, time, warranties) and technical criteria (technology, availability, scalability, fault tolerance, maturity, modularity, and recoverability). Following the advice from Wei et al. [41], all criteria need to be validated for practicality before pairwise comparative analysis can begin. Saaty [60] provides an additional question to assess the validity of the criteria that we incorporate in our study: Can I compare the elements on a lower level using some or all of the elements on the next higher level as criteria or attributes of the lower level elements?
3.2 Data collection
In the literature, different forms of interview have been identified: structured [64], semi-structured [65], unstructured [65], and focus group discussions [66, 67]. This study adopts a mix of structured and semi-structured approaches. Aligned with Dilshad's [67] advice, interviewees had to be appropriate decision-makers for the study context, be experienced in the construct and subject of interest, and be willing to share their thoughts.
Data collection was done in accordance with the two research objectives: (1) validating decision criteria for practicality; and (2) prioritising the criteria to select the most appropriate SDPA tool for South Africa. Regarding the second objective, we designed input forms with the aim of ensuring consistency across the interviews. Table 6 shows the scoring template, while Tables 7 and 8 present the calculated outcomes. Each decision-maker was interviewed to complete the matrix on a scale of 1 to 9, selecting which of the pair was more important - e.g., the criterion of independence scored against reliability, customisability, and ease of use - and stating which was more important relative to independence. This was done for all the criteria and all the decision-makers.
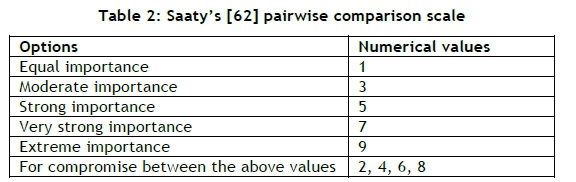
3.3 Selected participants
In South Africa, municipal (local) government is the bedrock of service delivery and the first contact of government with the citizens. It is also the sphere of government that can react most speedily to local challenges, being close to the grassroots. As a constitutional democracy, South Africa has a three-tiered system of government (national, provincial, and local) that operates in an interrelated, interdependent way [68]. Of these three tiers of government, the South African Constitution [69] entrusts the role of providing basic services (such as access to water services, sanitation services and waste removals, and electricity) to the municipalities. According to the Institute for Democracy in South Africa (IDASA) [70], basic services are necessities of life, closely linked to quality of life, physical well-being, and human dignity, the absence or shortage of which would hinder social and economic evolution. According to Reddy [71], this is the sphere/level of government with the designated mandate to provide primary health services, education, housing, electricity, water, sanitation, and an environment that is safe and secure for all local residents.
The objectives of this study, as stated in section 1.2, are therefore achieved by mostly using authorities from the municipal government. Since the participants in this study also needed to participate in the pair-wise comparison process, we selected them based on the following criteria:
1. Is the person a senior manager in the municipality? Rationale: Only senior management team members participate in budgeting, execution, and the evaluation of service delivery performance.
2. Has s/he been in a senior management position for five years or more, in one or more municipalities? Rationale: We reckon that a minimum of five years' experience at senior management level is necessary to have sufficient knowledge of service delivery concerns.
3. Is his/her role relevant to service delivery or service delivery monitoring, evaluation, research, and learning (MERL)? Rationale: Service delivery is the focus of our study.
Table 3 summarises the number of decision-makers from multiple municipalities who participated in the study.
4 RESULTS AND DISCUSSION OF FINDINGS
Applying the methodology described above, this section presents the results and outcomes of the criteria validation and pairwise comparisons.
4.1 Participant involvement and tool short-listing strategy
Multiple sessions were held with the participants to:
1. Review the validated criteria for their practicality.
2. Conduct pairwise comparisons of the criteria and alternatives in respect of criteria.
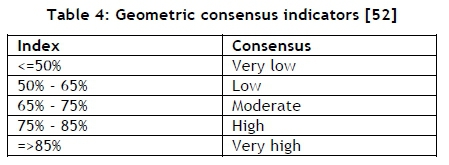
The Business Performance Management Singapore (BPMSG) tool of Goepel [52], a Microsoft Excel-based AHP software application, allows a maximum of 20 decision-makers to calculate aggregated results for all of them, using the geometric mean of all decision matrices. The tool calculates a consistency ratio (CR) for each decision-maker to evaluate the consistency with which the decision-maker has prioritised criteria. In addition, and with the possibility of differing rankings from decision-makers, the tool calculates a geometric consensus index (GCI), which indicates the disparity or otherwise of decision-makers' rankings. The GCI ranges from 0% (no consensus between decision-makers) to 100% (full consensus between decision-makers). The GCI values calculated for this study were interpreted in accordance with Table 4.
Theoretically, the GCI of the BPMSG tool is calculated using the row geometric mean method of Thomashevskii [72]. The CRs are calculated (CR = CI/RI) for each decision-maker, with the calculated principal eigenvalue based on one of the eigenvectors calculated from the row geometric mean method from each decision-maker or from the eigenvector method in the aggregated results. The RI is a randomlike index in which judgements have been randomly entered, tabled in Saaty [73] per number-of-comparison criteria.
For this study, it was not practically possible to procure all the tools outlined in Table 1, train the decisionmakers (top government officials) in all the tools, and allow them to be used for a lengthy period to gather enough data to evaluate them. A further filter was therefore required to limit the tools to only those that have been rigorously evaluated, with documented evidence of that evaluation from the literature. The filter is summarised as follows:
1. Has the tool been tested in real life?
Rationale: We assume that tools that have been used by practitioners will have been refined, increasing their usability.
2. Has it been evaluated for clear key performance metrics?
Rationale: Ambiguous performance metrics will have a negative effect on the reliability of the measurement outcome.
3. Is the evaluation outcome documented?
Rationale: Transparent documentation of the evaluation outcome is key to comparative analysis.
4. Are independent persons (not only the tools developers) involved in the evaluation?
Rationale: This is necessary to ensure the integrity, impartiality, and independence of the evaluation outcome.
Table 5 indicates that five tools were short-listed for pairwise comparisons.
4.2 Results of pairwise comparisons
Based on the AHP-based methodology presented in section 3.1, this section applies the AHP to the prequalified tools, based on the pre-validated criteria.
4.2.1Initial criteria for selecting COTS (commercial off-the-shelf) candidates
As indicated in section 3.1.3, we had already identified and validated some effectiveness criteria for service delivery performance assessment (SDPA) tools for the South African context via a focus group discussion. We added two further categories that would be relevant when existing off-the-shelf tools needed to be compared. Thus we believe that three categories of criteria need to be considered:
1. Effectiveness criteria
2. Project criteria
3. Technical criteria
4.2.2Results for validated criteria for practicality
This section addresses Objective 1 of the study, as stipulated in section 1.2:
Validate the practicality of the criteria with the decision-makers.
A questionnaire containing all the pre-validated criteria and their definitions was used to obtain decision-makers' judgement on their practicality. Below is a summary of the aggregated responses from 10 participating decision-makers:
1. Have all criteria been identified?: 100% indicated 'Yes'.
2. Should any effectiveness, project, or technical criteria be excluded?: 100% indicated 'No'.
3. Indicate the degree to which each criterion is expressed in practical terms: Aggregated, all criteria that scored 60% and above were included in the AHP structure (Figure 2) for pairwise comparisons. Consensus was reached with the decision-makers to include criteria with above-average scores. Interestingly, two of the criteria were excluded owing to practical evaluation constraints relating to their functionality and diagnostic abilities. Since the tools presented in Table 5 have been developed with the main purpose of diagnosing/assessing performance deficits, we assume that the SDPA tools incorporate the minimum set of functional features and diagnostic abilities. Yet a requirement elicitation process is needed to ensure that the selected tool also complies with the required functional features and diagnostic abilities.
4.2.3 Results for short-listed tools
This section addresses Objective 2 of the study, as stipulated in section 1.2:
Involve key decision-makers in prioritising criteria from a list of effectiveness, project, and technical criteria, selecting the most appropriate SDPA tool for South Africa.
The decision-makers were taken through the AHP structure in Figure 2, and their scorings were obtained. Figure 3 and Tables 6 to 8 show the results of the pairwise comparisons for the criteria.
The consolidated results are as follows:
• Decision-makers: 10
• Criteria: 9
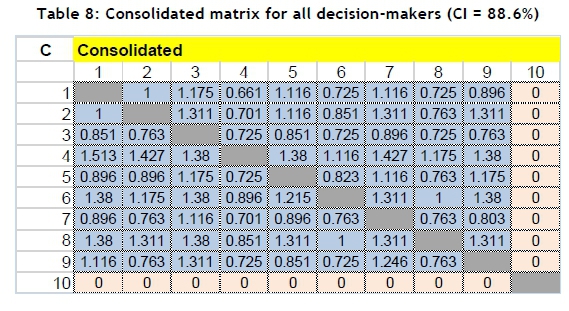
• Consensus index: 88.6% (very high agreement between decision-makers - see Table 4)
• Priorities are: Ease of use (14.3%), availability (13%), cost (12.9%), etc.
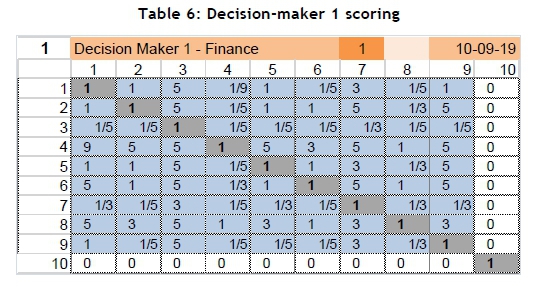
An example of the problem set up for one of the decision-makers is shown in Tables 6 and 7, while Table 8 shows the consolidated matrix for all the decision-makers. Table 7 also includes one of the decision-makers' comments - i.e., her interpretation of the criterion.
Table 6 outlines the scoring of decision-maker 1. All the participants were scored with the method described in section 3.2. The legend for the scores and their values is shown in Table 2 as a guide for decision-makers to score between 1 (equal importance) and 9 (extreme importance).
The corresponding priorities of decision-maker 1 are shown in Table 7, with a consistency ratio of 9%. Where the consistency exceeded 10%, the top three inconsistent pair-wise comparisons on the input sheets were highlighted to allow the participants to adjust their judgements. The judgement resulting in a lower inconsistency was proposed, and adjustments were made to improve the consistency.
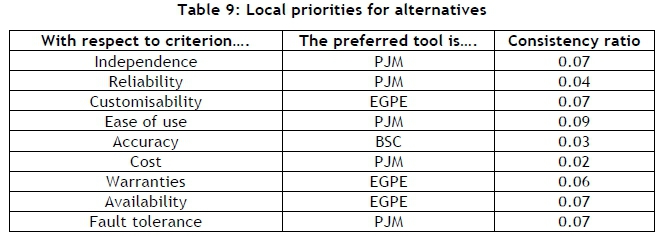
As indicated in section 4.1, Table 8 shows the consolidated matrix for all the decision-makers. These were the final priorities, whose calculation was based on the eigenvector method. Although the priority criteria were determined, it was now important to derive the relative priorities (preferences) of the alternatives (SDPA tools) with respect to each criterion. In other words: What are the priorities of the alternatives concerning independence, reliability, customisation, ease of use, accuracy, cost, warranty, availability, and fault tolerance respectively? Table 9 summarises the outcome.
Once local priorities had been calculated, the overall priority could be calculated, referred to as 'model synthesis' and shown below:
• PJM: (0.101*0.613) + (0.112*0.359) + (0.088*0.337) + (0.143*0.534) + (0.103*0.193) + (0.129*0.289) + (0.093*0.341) + (0.130*0.297) + (0.101*0.403) = 0.375
• EGPE: (0.101*0.165) + (0.112*0.28) + (0.088*0.407) + (0.143*0.225) + (0.103*0.193) + (0.129*0.265) + (0.093*0.361) + (0.130*0.404) + (0.101*0.203) = 0.276
• ESTP: (0.101*0.088) + (0.112*0.209) + (0.088*0.111) + (0.143*0.101) + (0.103*0.193) + (0.129*0.265) + (0.093*0.192) + (0.130*0.145) + (0.101*0.100) = 0.156
• BSC: (0.101*0.066) + (0.112*0.068) + (0.088*0.083) + (0.143*0.079) + (0.103*0.255) + (0.129*0.114) + (0.093*0.082) + (0.130*0.060) + (0.101*0.22) = 0.112
• CSD: (0.101*0.068) + (0.112*0.084) + (0.088*0.062) + (0.143*0.061) + (0.103*0.165) + (0.129*0.067) + (0.093*0.07) + (0.130*0.094) + (0.101*0.074) = 0.081
In summary, Table 10 shows all the alternatives ordered by their overall priority or preference.
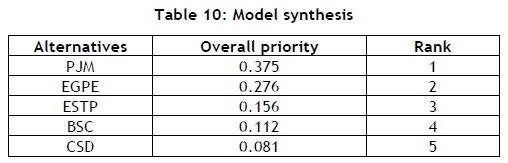
Since the PJM tool scored the highest (37.5%), given the importance (or weight) of each criterion, the PJM tool was preferred over the others.
4.2.4 Sensitivity analysis
The overall priorities calculated in section 4.2.3 (and shown in Table 10) were heavily influenced by the weights given to each criterion by the decision-makers. To see how the final results would be impacted if the weights of the criteria were different, it was essential to conduct a what-if analysis, generally referred to as ' sensitivity analysis' (SA).
The SA helps decision-makers to assess the quality of their decisions and to understand which criteria have the most impact on the original result [74-76]. Several scenarios can be tested by altering the weights of the criteria and observing how they affect the overall priorities of the other SDPA tools.
According to Yadav and Sharma [77] and Kousalya and Supraja [78], SA enhances the final decision-making process, eliminates alternatives, and gives information about the robustness of a decision. For this study, we considered several scenarios, including varying the weights and local priorities, to see what the ranking and overall priority would look like for each scenario.
The outcome for one of the tested scenarios is presented in Table 11, answering the question: What would the ranking look like if all the criteria had equal weights? With equally weighted criteria, the changes in overall priority were marginal; thus the ranking order of the original calculations was retained.
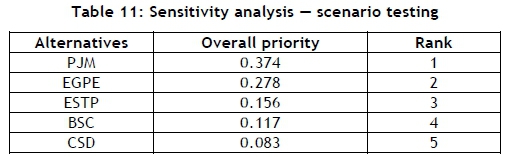
4.2.5 Results for selecting a COTS SDPA tool
The sensitivity analysis indicated that the PJM tool was still the most preferred (see Tables 10 and 11). It was closely followed by the EGPE tool in both the local and the global priority rankings. The PJM visualises all performance metrics for a specific service while integrating three critical dimensions in the context of the performance assessment of services: (1) the service process, (2) the dimensions of the balanced scorecard, and (3) the service implementers in an organisation - that is, staff members, supervisors, line managers, etc. who are involved in the service delivery process [17]. For our research, key to the review and pairwise comparison process was the documented result of the evaluation of the PJM, which, when it was reviewed alone, indicated that it performed well on metrics such as comprehensibility, objectiveness, conflict avoidance, balance, and improvement.
4.3 Discussion
This study set out to decide on the best SDPA tool for South Africa on the basis of three criteria - effectiveness, project, and technical - using the AHP approach. The PJM was selected with a GCI of 88.6 per cent indicating a very high level of agreement between the decision-makers. This is very significant, as the 10 decision-makers were drawn from four different municipalities with diverse service delivery challenges. Since the evaluation criteria were contextualised for South Africa, the PJM offers an initial solution to service delivery performance assessment.
5 CONCLUSION AND RECOMMENDATION
South Africa has high levels of public unrest and protest [5, 79]. While an overwhelming majority of these protests are aimed at government [80], they often derive from public service delivery deficits in housing, water and sanitation, electricity, health, and education [81], and lead to the destruction of property, police brutality, and sometimes the loss of lives. The South African Presidency attributed the reason for these public service delivery gaps to the failures of municipalities - the arm of government constitutionally designated to provide them [82]. However, Makanyeza [83] and the World Bank Group [12] believe that the development of a proper public SDPA tool would contribute significantly to a solution.
To answer our main research question: using an AHP-based methodology - an Austrian SDPA tool that has been widely applied in measuring services performance measurement in many locations [17] - was selected as the most appropriate tool. Using qualitative data as input, this study demonstrated how an AHP-based methodology facilitated decision-making to solve a real-world problem. That outcome is significant, as it could prevent the loss of lives and property and of billions of Rands annually, and restore citizens' confidence in governance.
Since this study assumed that the PJM tool incorporates a minimum set of functional features and diagnostic abilities, additional work is required to defend this assumption. We suggest that a requirements elicitation process is needed at a real-world municipality to confirm that our assumption was valid. Although the PJM tool was selected using a scientific methodology, it is recommended that the study be extended to compare the commercial off-the-shelf tool, PJM (i.e., by buying the tool) with other implementation pathways, such as developing a new tool from scratch (i.e., by making the tool) or amending an existing one (i.e., by adapting the tool).
6 REFERENCES
[1] Fiszbein, A., Ringold, D., and Rogers, H., Making services work: Indicators, assessments, and benchmarking of the quality of public service delivery, The World Bank: Policy research working paper no. 5690, 2011. [ Links ]
[2] Schultz, D., Public administration review. Civil Service Reform, 62(5): pp. 634-637, 2002. [ Links ]
[3] Olusola, O.O., Boosting internally generated revenue of local governments in Ogun State, Nigeria: A study of selected local governments in Ogun State, European Journal of Humanities and Social Sciences, 8(1): pp. 336-348, 2011. [ Links ]
[4] Diagne, M.F., Ringold, D., and Zaidi, S., Governance and public service delivery in Europe and Central Asia: Unofficial payments, utilization and satisfaction, The World Bank: Policy Research Working Paper no. 5994, 2012. [ Links ]
[5] Tirivangasi, H.M., and Mugambiwa, S.S, Citizenship crisis or xenophobia? A critical analysis of service delivery protest in South Africa, in: SAAPAM 5th Annual Conference Proceedings, pp. 41-48, 2016. [ Links ]
[6] Amin, S., Das, J., and Goldstein, M., Are you being served? New tools for measuring service delivery, World Bank Group: Open Knowledge Repository no. 42482, 2008. [ Links ]
[7] Bratton, M., Citizen perceptions of local government responsiveness in sub-Saharan Africa, World Development, 40(3): pp. 516-527, 2012. [ Links ]
[8] Hunter, Q., ANC squirms over voter discontent, 2015. Available at: https://mg.co.za/article/2015-07-30-anc-squirms-over-voter-discontent/ [Accessed 20 September 2019]. [ Links ]
[9] Mdlongwa, E.T., Local government at the heart of poor service delivery. Rhodes Journalism Review, 2014(34): pp. 39, 2014. [ Links ]
[10] Mudzuli, K., Billions needed to fix protest-hit townships, 2014. Available at: https://www.iol.co.za/news/billions-needed-to-fix-protest-hit-townships-1643434 [Accessed 15 August 2019]. [ Links ]
[11] Van Onselen, G., Book burnings in South Africa, 2013. Available at: https://www.politicsweb.co.za/news-and-analysis/book-burnings-in-south-africa. [Accessed 15 August 2019]. [ Links ]
[12] The World Bank Group, Accountability in public services in South Africa, Washington DC: World Bank, 2011. [ Links ]
[13] Ajayi, O.B. and De Vries, M., Diagnostic assessment of service delivery health in South Africa: A systematic literature review, South African Journal of Industrial Engineering, 30(1): pp. 24-36, 2019. [ Links ]
[14] Uy, J., Lizarondo, L., and Atlas, A., ASPIRE for quality: A new evidence-based tool to evaluate clinical service performance, BMC Research Notes, 9: , 2016. [ Links ]
[15] Brettenny, W., and Sharp, G., Efficiency evaluation of urban and rural municipal water service authorities in South Africa: A data envelopment analysis approach, Water SA,2(1): pp. 11-19, 2016. [ Links ]
[16] Department of Planning, Monitoring and Evaluation., Frontline service delivery monitoring assessment framework, 2015. Available at: https://www.dpme.gov.za/keyfocusareas/flsdSite/Frontline%20Serv ice%20Delivery/FSDM%20Assesment%20Framework.pdf. [Accessed 15 August 2019] [ Links ]
[17] Höber, A., Pergler, E., Weitlaner, D., and Grahsl, H., Performance journey mapping: A service performance assessment framework, The Total Quality Management Journal, 27(2): pp. 231-246, 2015. [ Links ]
[18] Yu, W., and Ma, L., External government performance evaluation in China: Evaluating the evaluations, Public Performance & Management Review, 39: pp. 144-171, 2016. [ Links ]
[19] O'Neill, K., Takane, M., Sheffel, A., Abou-Zahr, C., and Boerma, T., Monitoring service delivery for universal health coverage: The service availability and readiness assessment, Bulletin, World Health Organisation., 91: pp. 923-931, 2013. [ Links ]
[20] Edward, A., Kumar, B., Kakar, F., Salehi, A.S, Burnham, G. and Peters, D.H, Configuring balanced scorecards for measuring health system performance: Evidence from 5 years' evaluation in Afghanistan, PLoS Medicine, 8(7): e1001066, 2011. [ Links ]
[21] Steven, H. , Service delivery index, Economic Empowerment Rating Agency, South Africa, 2009. Available at: http://www.empowerdex.com/Portals/5/docs/Press%20releases/citydex_report.pdf[Accessed 15 August 2019] [ Links ]
[22] Wallace, J.H., Seyed, M.R.I., and Shou, B., A diagnostic tree for improving production line performance, Production and Operations Management, 16(1): pp. 77-92, 2007. [ Links ]
[23] Williams, C.S., Improving service quality in the new public sector, in: The Routledge companion to nonprofit marketing, 2007, pp. 389-402. [ Links ]
[24] SERVICOM, The service compact with all Nigerians, 2006. [ Links ]
[25] Siamak, T., and Xuehong, S., Inference techniques for diagnosis based on set operations, American Institute of Aeronautics and Astronautics, 1(1): pp. 1-8, 2004. [ Links ]
[26] Reinikka, R., and Svensson, J., Assessing frontline service delivery, Washington DC: World Bank Development Research Group, 2002. [ Links ]
[27] Fogarty, G., Catts, R., and Frolin, C., Identifying shortcomings in the measurement of service quality, Journal of Outcome Measurement, 4(1): pp. 425-447, 2000. [ Links ]
[28] Parasuraman, A., Zeithaml, V.A., and Berry, L.L., SERVQUAL: A multiple-item scale for measuring consumer perceptions of service quality, Journal of Retailing, 64(1): pp. 12-40, 1988. [ Links ]
[29] Triantaphyllou, E., Shu, S., Sanchez, S.N., and Ray, T., Multi-criteria decision making: An operations research approach, in: Encyclopedia of electrical and electronics engineering (J.G. Webster, ed.), John Wiley & Sons, New York, 15: pp. 175-186, 1998. [ Links ]
[30] Scott, L., Participatory multi-criteria decision analysis: A new tool for integrated development planning, Development Southern Africa, 22(5): pp. 695-716, 2005. [ Links ]
[31] Velasque, M., and Hester, H.T, An analysis of multi-criteria decision making methods, International Journal of Operations Research, 10(2): pp. 56-66, 2013. [ Links ]
[32] Mardani, A., Jusoh, A., Nor, K.M., Khalifah, Z., Zakwan, N., and Valipour, A., Multiple criteria decision-making techniques and their applications - A review of the literature from 2000 to 2014, Economic Research, 28(1): pp. 516-571, 2015. [ Links ]
[33] Kraujaliene, L., Comparative analysis of multi-criteria decision-making methods evaluating the efficiency of technology transfer, Business, Management and Education, 17(2019): pp. 72-93, 2019. [ Links ]
[34] Prusak, A., Strojny, J., Stefanow, P., and Machaj, K., The AHP-based assessment of public services with respect to different groups of customers of Polish local government. Chinese Business Review, 14(11): pp. 547-560, 2015. [ Links ]
[35] Hell, M., Krneta, M., and Krneta, P., Application of AHP method for the selection of business plan software, Croatian Operational Research Review (CRORR), 4(1): pp 223-234, 2013. [ Links ]
[36] Bataineh, O., Hjeelah, D., and Arabiat, S., Multi-criteria decision making using AHP to select the best CAD software, in: Advances in Intelligent Systems and Computing, pp. 106-115, 2018. [ Links ]
[37] Dorado, R., Gómez-Moreno, A., Torres-Jimenez, E., and López-Alba, E., An AHP application to select software for engineering education, Computer Applications in Engineering Education, 22(2): pp. 200-208, 2014. [ Links ]
[38] Pekin, A., Ozkan, G., Eski, O., Karaarslan, U., Ertek, G., and Kilic, K, Application of the analytic hierarchy process (AHP) for selection of forecasting software, in: 5th International Symposium on Intelligent Manufacturing Systems, Sakarya, Turkey, 2006: pp. 1-16. [ Links ]
[39] Ahmad, N., and Laplante, P.A., Software project management tools: Making a practical decision using AHP, in: Proceedings of the 30th Annual IEEE/NASA Software Engineering Workshop SEW-30 (SEW06) 2006. [ Links ]
[40] Godse, M., and Mulik, S., An approach for selecting software-as-a-service (SaaS) product, in: IEEE International Conference on Cloud Computing, Bangalore, 2009: pp. 155-158. [ Links ]
[41] Wei, C., Chien, C.F., and Wang, M.-J.J., An AHP-based approach to ERP system selection, International Journal of Production Economics, 96: pp. 47-62, 2005. [ Links ]
[42] Lai, V., Wong, B.K, and Cheung, W., Group decision making in a multiple criteria environment: A case using the AHP in the software selection, European Journal of Operational Research, 137(1): pp. 134-144, 2002. [ Links ]
[43] Venkatamuni, T., and Ramakrishna, R.A., Analytical hierarchal process (AHP) approach in product selection (cell phone), International Journal of Industrial Engineering, 18(7): pp. 369-376, 2011. [ Links ]
[44] Shin, M., Mo, J., Lee, K., and Lee, C., On the interval selection and interpretation of the probabilistic AHP for uncertain decision making, International Journal of Industrial Engineering, 24(1): pp. 32-43, 2017. [ Links ]
[45] Barzilai, J., On the decomposition of value functions, Operations Research Letters, 22: pp. 159-170, 1998. [ Links ]
[46] Gavade, R.K., Multi-criteria decision making: An overview of different selection problems and methods, International Journal of Computer Science and Information Technologies, 5(4): pp. 5643-5646, 2014. [ Links ]
[47] Whitaker, R., Criticisms of the analytic hierarchy process: Why they often make no sense, Science Direct: Mathematical and Computer Modelling, 46: pp. 948-961, 2007. [ Links ]
[48] Forman, E.H., Facts and fictions about the analytic hierarchy process, Mathematical and Computer Modelling, 17(4-5): pp. 19-26, 1993. [ Links ]
[49] Saaty, T.L., Decision making - The analytic hierarchy and network processes (AHP/ANP), Journal of Systems Science and Systems Engineering, 13(1): pp. 1-35, 2004b. [ Links ]
[50] Misra, S.K., and Ray, A., Comparative study on different multi-criteria decision making tools in software project selection scenario, International Journal of Advanced Research in Computer Science, 3(4): pp. 172-178, 2012. [ Links ]
[51] Yildiz, A., and Yesim Yayla, A., Multi-criteria decision making methods for supplier selection: A literature review. South African Journal of Industrial Engineering, 26(2): pp. 158-177, 2015. [ Links ]
[52] Goepel, K.D., Implementing the analytic hierarchy process as a standard method for multi-criteria decision making in corporate enterprises - A new AHP Excel template with multiple inputs, in: Proceedings of the International Symposium on the Analytic Hierarchy Process, Kuala Lumpur, Malaysia, 2013. [ Links ]
[53] Mukherjee, K., Supplier selection - An MCDA-based approach, Springer, 2017. [ Links ]
[54] Saaty, T.L., The analytic hierarchy process, New York, NY: McGraw-Hill, 1980. [ Links ]
[55] Saaty, T.L., What is the analytic hierarchy process? In: Mitra, G., Greenberg, H.J., Lootsma, F.A., Rijkaert, M.J., and Zimmerman, H.J., Mathematical models for decision support, NATO ASI Series, Berlin, Heidelberg: Springer, 1988, 48: pp. 109-122. [ Links ]
[56] Saaty, T.L., Decision making with the analytic hierarchy process, International Journal of Services Sciences, 1(1): pp. 83-98, 2008. [ Links ]
[57] Harker, P.T., The art of science and decision-making: The analytic hierarchy process, Berlin: Springer-Verlag, 1989. [ Links ]
[58] Bhushan, N., and Rai, K. , Strategic decision making: Applying the analytic hierarchy process, London: Springer, 2004. [ Links ]
[59] Brunelli, M., Introduction to the analytic hierarchy process. Cham: SpringerBriefs in Operations Research, 2015. [ Links ]
[60] Saaty, T.L., Fundamentals of the analytic network process - Dependence and feedback in decision-making with a single network, Journal of Systems Science and Systems Engineering, 13(2): pp. 129-157, 2004a. [ Links ]
[61] Saaty, T. and L. Vargas, Models, methods, concepts & applications of the analytic hierarchy process, Berlin Heidelberg: Springer Science and Business Media Publishing, 2001. [ Links ]
[62] Saaty, T.L., How to make a decision: The analytic hierarchy process. The Institute of Management Sciences, 24(6): pp. 19-43, 1994. [ Links ]
[63] Mu, E., and Pereyra-Rojas, M., An introduction to the analytic hierarchy process (AHP) using super decisions V2, Cham: SpringerBriefs in Operations Research, 2017. [ Links ]
[64] Flick, U., An introduction to qualitative research, Thousand Oaks, CA: SAGE Publications, 1998. [ Links ]
[65] Gubrium, J.F., and Holstein, J.A., Handbook of interview research: Context and method, Thousand Oaks, CA: SAGE Publications, 2001. [ Links ]
[66] Krueger, R.A., and Casey, M.A, Focus groups: A practical guide for applied research, Thousand Oaks, CA: SAGE Publications, 2000. [ Links ]
[67] Dilshad, R.M., and Latif, M.I., Focus group interview as a tool for qualitative research: An analysis, Pakistan Journal of Social Sciences (PJSS), 33(1): pp. 191-198, 2013. [ Links ]
[68] Pretorius, D., and Schurink, W., Enhancing service delivery in local government: The case of a district municipality, SA Journal of Human Resource Management, 5(3): pp. 19-29, 2007. [ Links ]
[69] Constitution, Republic of South Africa Constitution Act Number 108 of 1996. 1996. [ Links ]
[70] IDASA, L.G.U., The state of local government and service delivery in South Africa: Issues, challenges and solutions. Submitted to the portfolio committee on co-operative governance and traditional affairs, 2010. [ Links ]
[71] Reddy, P.S., The politics of service delivery in South Africa: The local government sphere in context, The Journal for Transdisciplinary Research in Southern Africa, 12(1), pp. 26-33, 2016. [ Links ]
[72] Tomashevskii, I.L., Eigenvector ranking method as a measuring tool: Formulas for errors, European Journal of Operational Research, 240(3): pp. 774-780, 2015. [ Links ]
[73] Saaty, T.L., Decision making for leaders: The analytic hierarchy process for decisions in a complex world, 3rd revised edition, Pittsburgh, PA: RWS Publications, 2012. [ Links ]
[74] Banda, W., An integrated framework comprising of AHP, expert questionnaire survey and sensitivity analysis for risk assessment in mining projects, International Journal of Management Science and Engineering Management, 14(3): pp. 180-192, 2019. [ Links ]
[75] Farahani, R.Z., and Fadaei, M. , A MCDM-based model for vendor selection: A case study in the particleboard industry, Journal of Forestry Research, 23(4): pp. 685-690, 2012. [ Links ]
[76] Ivanco, M., Hou, G., and Michaeli, J, Sensitivity analysis method to address user disparities in the analytic hierarchy process, Expert Systems with Applications, 90: pp. 111-126, 2017. [ Links ]
[77] Yadav, V., and Sharma, M.K., Multi-criteria supplier selection model using the analytic hierarchy process approach Journal of Modelling in Management, 11(1): pp. 326-354, 2016. [ Links ]
[78] Kousalya, P., and Supraja, S., On some aspects of sensitivity analysis in AHP - An illustration, International Journal of Scientific & Engineering Research, 4(6): pp. 979-983, 2013. [ Links ]
[79] Breakfast, N., Bradshaw, G., and Nomarwayi, T., Violent service delivery protests in post-apartheid South Africa, 1994-2017, African Journal of Public Affairs, 11(1): pp. 106-125, 2019. [ Links ]
[80] Runciman, C., Maruping, B., and Moloto, B., South Africa's rebellion of the poor: An overview, University of Johannesburg, 2016. Available at: https://slideplayer.com/slide/13546649/[Accessed 29 August 2019] [ Links ]
[81] Lancaster, L., At the heart of discontent: Measuring public violence in South Africa, Institute for Security Studies, 292, 2016. [ Links ]
[82] Nomdo, A., The social costs of violent and destructive service-delivery protests in South Africa, Pretoria, South Africa: Human Sciences Research Council, 2018. [ Links ]
[83] Makanyeza, C., Kwandayi, H.P., and Ikobe, B.N., Strategies to improve service delivery in local authorities, International Journal of Information Technology and Business Management, 15(1), 2013. [ Links ]
Submitted by authors 01 Jul 2021
Accepted for publication 06 Apr 2022
Available online 06 /May 2022
ORCID® identifiers
O. Ajayi 0000-0001-6256-706X
M. De Vries 0000-0002-1715-0430
* Corresponding author u16404808@tuks.co.za

