


Services on Demand
Article
 English (pdf)
 Article in xml format
 Article references
Indicators

Related links
-
 Cited by Google
 -
 Similars in Google
Share

 Permalink
South African Journal of Industrial Engineering
On-line version ISSN 2224-7890
Print version ISSN 1012-277X
S. Afr. J. Ind. Eng. vol.33 n.1 Pretoria May. 2022
http://dx.doi.org/10.7166/33-1-2556
GENERAL ARTICLES
Decision support for clinical laboratory test requisition: the utility of ICD-10 coding
F.K. HathornI, *; I.H. De KockI; E. WassermanII, III
IDepartment of Industrial Engineering, Stellenbosch University, Stellenbosch, South Africa
IIPathcare Reference Laboratory
IIIDivision of Medical Microbiology, Stellenbosch University, Stellenbosch, South Africa
ABSTRACT
This study examined the possibility of a strong relationship between ICD-10 codes and the panel of clinical laboratory tests requested. Decision-tree learning principles were used to determine whether requisition event attributes had a useful relationship with laboratory tests. A recommender system was designed and tested using ICD-10 codes as a core predictor. The results showed an average requisition accuracy upwards of 74 per cent. If such a system were to be deployed, health professionals would be able to draw from a vast and accessible pool of knowledge when selecting clinical laboratory tests, improving the effectiveness of clinical laboratory operations.
OPSOMMING
Hierdie studie het die moontlikheid ondersoek van 'n sterk verband tussen ICD-10-kodes en die paneel kliniese laboratoriumtoetse wat gevra word. Besluitboom-leerbeginsels was gebruik om vas te stel of eienskappe van rekwisisiegebeurtenisse 'n nuttige verband met laboratoriumtoetse gehad het. 'n Aanbevelingstelsel was ontwerp en getoets deur die gebruik van ICD-10-kodes as 'n kernvoorspeller. Die resultate het 'n gemiddelde rekwisisie-akkuraatheid van 74 persent getoon. As so 'n stelsel geïmplementeer word, kan gesondheids-werkers uit 'n wye en toeganklike poel kennis trek wanneer hulle kliniese laboratoriumtoetse moet kies, wat die doeltreffendheid van kliniese laboratorium-bedrywighede sal verbeter.
1 INTRODUCTION
Modern healthcare relies on laboratory diagnostic services such as clinical pathology and radiology [1]. The complexities of integrating health and laboratory information systems pose a significant obstacle to the efficient use of diagnostic services. Major system overhauls are often required, which are expensive and unattractive. A common integration issue in healthcare is the barrier between handwritten patient health records and large-scale data processing [2]. Out-dated principles for how data should be captured and transmitted in the healthcare industry commonly result in the separation of data capturing and processing units. Smarter data management systems should capture data in a way that can be smoothly integrated in processing and reporting diagnostic tests.
The efficient use of laboratory services to diagnose and manage disease should ideally be governed by evidence-based medicine. According to pathologists interviewed for this study, various guidelines and results of clinical trials reported in the literature are often insufficient for the variety of cases encountered in clinical practice, and are not validated against the local disease profile and specific economic needs. The validity of international evidence-based guidelines in a local setting may be questioned, as the variability among disease profiles around the world means that not every location would see the same volumes in particular clinical tests [3]. A patient presenting the same condition on two different continents may be treated differently because of distinct local disease profiles and available resources. Data generated locally may therefore provide guidance that is more appropriate to a specific setting. Thus guidelines for practice could be evident in the combined knowledge and experience of local clinicians, as manifested in data generated from the requisition of specific diagnostic tests by a large sample of practitioners.
Recommendation systems such as those used regularly in the retail industry are examples of data used to formulate usage guidelines. These systems use machine learning to identify trends in data and to leverage that information in order to recommend products to individual customers. Although recommendation systems are not routinely used in healthcare, they could give a medical professional a firm reference point from which they could make informed decisions [4]. An example of a successful medical recommender is one built on the idea that a specific patient will prefer particular traits and expertise that certain physicians possess [5]. This system allows patients to contact the doctor who is best suited to treat their specific illness. In a similar way, a test profile validated for a specific diagnosis may be used as the reference standard for a laboratory test recommendation.
Typical laboratory requisitioning relies on clinicians to select diagnostic tests from laboratory requisition forms (LRF) on which tests are organised according to broad criteria such as pathology discipline (e.g., chemistry, haematology, or serology). Requisitions are then captured in the laboratory information system, together with patient demographics and an ICD-10 code to denote the diagnosis. In a paper-based system, the list of tests provided on LRFs is not comprehensive, and additional laboratory tests are often handwritten by clinicians. A previous study demonstrated that the presentation of an LRF has a significant impact on which tests are conducted [6]. Guidance about the types of test requested may allow laboratories to improve utilisation through more appropriate resource management and allocation. An electronic recommender system can enable a more structured offering of tests that can be organised according to diagnostic algorithms or pre-formulated test profiles. It is conceivable that laboratory requisitioning could be more intelligent if, using pattern-recognition techniques, these profiles were dynamically structured around the symptoms or signs that the patient presents. Electronic requisitioning may be the first step towards a better integration of pre-analytical data capturing; but, to reduce the integration issues of a solution, it is necessary to identify a common denominator that can link healthcare data to diagnostic tests.
The ICD-10 code system is used universally to index clinical diagnosis [7], and is already a popular variable for hospital groups and funders to analyse and regulate health care expenditure. ICD-10 coding could act as an integration key, allowing organisations to benchmark their internal key performance indicators (KPIs) and global results. This common factor means that any system developed alongside ICD-10 coding will be easily integrated into the laboratory diagnostics [8]. This paper investigates the validity of standard test profiles occurring for specific diagnostic codes, such as the ICD-10 system, as a possible way to recommend suitable diagnostic tests in electronic requisitioning formats. If these profiles could be validated, they could also serve as a benchmark to monitor and evaluate requisitioning patterns.
At the point of test requisitioning, doctors already have to supply an ICD-10 code that denotes a diagnosis or working diagnosis. The premise of this study is that tests associated with a particular code can be electronically recommended. This study aims to contribute towards increasingly effective and efficient laboratory operations by evaluating whether a standard profile of laboratory tests can be validated for selected ICD-10 diagnostic codes. The study thus further aims to provide the foundation for a solution that offers a readily accessible and integral method of smart test requisitioning.
2 METHODS
As a proof-of-concept study, simple data analysis methods were chosen ahead of complex pattern analysis techniques. Test requisition data was supplied by a large pathology group. Each feature (listed in Table 1) was analysed in detail with specific reference to its usefulness as a laboratory test predictor. Useful features were then employed as a foundation for the predictive model with which the effectiveness of an ICD-10-based recommender system was evaluated.
2.1 Data gathering
Retrospective data of test requisitions was obtained from a large private pathology organisation. This data included basic patient demographics such as age and gender, along with event-based information such as ICD-10 code, region, doctor type, and requested laboratory tests. The primary focus of this study was to explore the relationship between ICD-10 codes and the requested clinical laboratory tests; however, it was necessary to identify whether other event-based indicators could be used to improve the results further. The raw dataset contained roughly four million records, and covered the period from October 2019 to February 2020. COVID-19-related regulations caused inconsistencies in the collected data, so records collected after February 2020 were not considered. As the dataset represented information processed by the organisation's data capturers, only a handful of cases contained missing information. A thorough analysis of the data was conducted before proceeding to evaluate the features, including cleaning and preparing the data with oversight from medical professionals.
2.2 Feature evaluation
This phase is concerned with evaluating whether each feature has any correlation with the target feature: laboratory tests. According to Senthilanathan, the identification of correlation is important for two reasons [9]: (i) an association may imply that one feature is a good predictor of another, and (ii) highly correlated features may imply that one of the features is a redundant predictor of another. Table 1 shows a brief description of each of the features examined in the dataset.
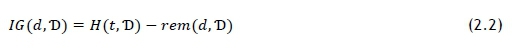
It is important to identify which features, apart from ICD-10 code, could be used in the laboratory test recommendation system. As more features are added, it is expected that the accuracy of the recommendation based on the training dataset would increase. The risk is that some feature attributes may have a low representation, and thus not provide the recommendation accuracy that is needed. This is especially true for ICD-10 codes that appear in low volumes, as the variety of laboratory tests associated with these codes is likely to be low, which would incorrectly portray a high level of recommendation accuracy. Some features may be more sensitive to certain input parameters than others; for example, it may only be valuable to include gender as a predictive feature if there is a significant difference in testing volumes and types between male and female patients, meaning that the features would need to be ranked on usefulness on a case-by-case basis. Ranking was conducted using the information gain (IG) method - a model used to describe the informativeness of a feature in terms of Shannon's entropy model, which is a method of quantifying the level of impurity of elements within a set [10]. This method is routinely adopted when deploying a decision tree. The entropy H(t,T>) of a dataset can be calculated using Shannon's entropy model as follows [10]:

The probability P(t = I) represents the fraction of outcomes in which element t of the set is of target set level l (laboratory test) in dataset Ό. Entropy is measured in bits. When using IG as a tool for feature selection, it is often referred to as mutual information (MI). A value for a feature's IG, or MI, can be calculated as follows [10]:
In this case, d represents a feature variable. The relationship is symmetrical. The remaining entropy, denoted as rem(d.D) after feature d has been tested, is considered to be a partition-wise weighted sum of entropy - that is, smaller partitions do not influence rem(d.D) as much as large counterparts do. To calculate rem(d.T)) we apply the following formula [10]:
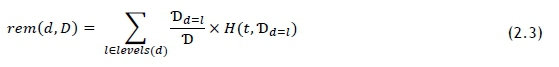
The entropy for the dataset was calculated using Eq. 5.5. Values for rem(d.T) were also calculated using the method described by Eq. 2.3. A drawback of this calculation is that entropy is an impurity-based metric, and some of the features have many more levels than others; for example, there are two gender levels, and just under 2 000 laboratory tests. To combat this bias, the information gain ratio (GR) can be used to evaluate all features directly against each other, and is calculated as follows [10]:
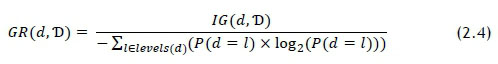
Features that showed higher GR values were selected as input parameters for the predictive model. It was recognised that the MI and GR calculations could be repeated for each recommendation, as some relationships could benefit from tailored parameters; but uniform parameters was considered as sufficient for a proof-of-concept study.
2.3 Data modelling
To test the results uncovered in the 2.2 Feature evaluation, it was necessary to build a rudimentary recommender system. The case-based recommender (CBR) system relies on a specific set of input parameters to operate. This input set is treated as a query Q within the dataset TJ, and each record in the set is considered to be a 'case'. The constraints triggered by the query initiate a filtering process that returns the query set Aq. Ranking features based on MI and GR is not a comprehensive indicator of predictive performance, but it does allow for a comparative analysis of the importance and influence of each feature.
The CBR algorithm was constructed as follows:
1. Input event-related features that will assist in filtering the dataset.
2. Filter the dataset based on the input parameters.
3. Count the number of unique patients in the dataset.
4. Calculate the average number of tests per patient; multiply that figure by the pre-determined constant to get n (number of tests per patient).
5. Rank the tests in order of occurrence.
6. Fill a list of recommended tests by using the ranked top n tests.
7. Evaluate the event-based performance, using metrics outlined below under '2.4 Model evaluation'.
The algorithm was tested on a population of 472 sets (Q), each containing more than 1 000 individual cases. These frequently occurring sets were selected because limited data was available.
2.4 Model evaluation
Once a predictive model had been developed, the generated solutions were evaluated. The results were assessed using the following performance-based metrics [11], 
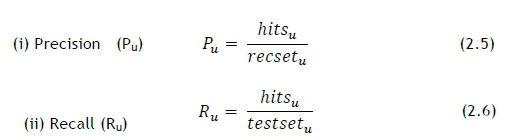
where hitsurepresents the number of correctly predicted recommendations, recseturepresents the size of the recommended set, and testseturepresents the size of the test set. Pu and Ru have certain trade-offs, which means that direct comparison for different cases is often not the most effective way to evaluate the performance. The F1 metric should, in theory, enhance the comparability of results, and is calculated as follows [11]:
A metric was derived to measure the mean for the proportion of a patient's test profile captured by the recommendation set. This is an important measure of the effectiveness of the algorithm, as it describes the typical contribution of the recommendation system. The relationship was termed 'recommendation contribution' (RC) and is shown in Eq. 2.8, where eventurepresents the size of each event's (linked to a unique patient) test set.
Metrics 2.5 and 2.6 can be evaluated by generating a recommendation based on input parameters and by comparing this set with patient samples containing the same parameters. A 'hit' occurs for each recommended test that appears in the unique patient test sample. A set of P and R values can then be used with the F1 metric to determine a standard value that represents the accuracy of the recommendation [11].
3 RESULTS
A thorough analysis of the features was conducted by making use of the decision-tree learning principles set out in Section 0. The performance of the rudimentary algorithm was tested using the parameters set out in Section 0. The intricacies of feature selection and algorithm performance were then evaluated to conclude the results analysis for this study.
3.1 Feature analysis
The results displayed in Figure 1 show that ICD-10 code and Provider ID offer the most significant MI when splitting the dataset on its features. The GRs for Patient class and Doctor type show that the bias caused by their individual entropy was reducing their performance in the MI comparison. The values calculated for GR show that these features are important predictors for laboratory tests. The MI and GR for Patient gender reveal an extremely weak relationship between this feature and the target set. The conclusion drawn from this information is that, typically, the gender of the patient will have little to no relevant influence on the type of test that is requested by the clinician. There are clear instances when the gender might have an influence on the selected laboratory test, but those will likely be related to gender-specific testing procedures. The MI and GR values for Generate region indicate that the region where the test is conducted has a very low correlation with the test selection.

Doctor type and Provider ID both provide useful information, as certain medical fields may be more prone to selecting specific tests. This is also true for individual clinicians (Provider ID), as they may operate in an environment in which they consult with a principal disorder or illness. Likewise, individuals may be more likely habitually to request similar tests, which could also create a higher level of MI. These assumptions appear to hold true, as the GR for clinician categories is higher than that for individual clinicians. This indicates that, despite having a lower MI, the Doctor type feature holds greater potential as a generalised predictor than Provider ID.
Patient class compared extremely well with other features when using the GR and MI values. The comparatively high GR indicated that Patient class would be an important feature to consider when building a recommendation model. This feature provides a practical example of the importance of considering GR, as the low number of levels in the data lead to inconclusive and unrepresentative MI results. It may be that the class of patient - that is, whether in or out of hospital - is strongly correlated with the severity of illness; and that will often influence the type of test that is requisitioned. This theory manifests in the MI and GR results for the Patient class feature, indicating that certain tests are strongly associated with either in or out patients.
Patient age did not provide significant MI or show a high GR. A possible explanation for this is that the patient age may moderate the ICD-10 codes selected for a patient, rather than act as a predictor for laboratory tests. This theory was tested by calculating the MI and GR between Patient age and the ICD-10 codes. The result is shown in Table 2, and indicates an association between the two features. A similar phenomenon occurs between the ICD-10 code and the testing region. Although these relationships could be a valuable area to explore, they do not fall within the scope of this study. The results and assumptions drawn from the analysis indicate that the following features best point to the appropriateness of a generalised recommendation of laboratory tests, and should be selected for further modelling: (i) ICD-10 code, (ii) Doctor classification, (iii) Patient class.
For this study, the CBR algorithm was developed to query the existing dataset using set Q, defined as Ό e(Iq, Dq, Pq), where Iq represents the input ICD-10 code, Dq represents the type of clinician, and Pq represents the patient class. To allow similarity metrics to influence this system, the results are evaluated using both the full (provided) ICD-10 code and a shortened version that accounts for only the primary classification (for example, R52.9 becomes R52). This adjustment means that the diagnostic information is less exacting, but it provides the opportunity to examine similar cases. Once the set Oq has been defined, each identical case is grouped in a frequency calculation. These groups are then assigned values representing their group size. At this point, the system makes it possible to provide the highest n values as a recommendation set. The n value is determined by referring to the UniquePatient classifications associated with the set Oq. The mean testing volume per patient is calculated and used as the n value for the recommendation. This value can be fine-tuned by including accuracy measures in the solution algorithm. As a standard for this study, the n value was set to 150% of the mean testing volume for the case Q1.
3.2 Algorithm performance
The algorithm's performance was measured using the metrics outlined under '2.4 Model evaluation'. The results of the algorithm and the model evaluation are summarised in Table 3. Precision values were typically low, which is consistent with a recommended set larger than the mean testing volume. It is necessary to note that the current LRF employed by South Africa pathology groups has an average precision of around 0.0125, based on the number of tests it offers and the average number of tests per LRF. The F1 values showed a linear correlation with 'Precision', but not with 'Recall' or 'Recommendation contribution' (RC). The metric was so heavily influenced by Precision that the use case for this study was focused on relative values rather than absolute ones.
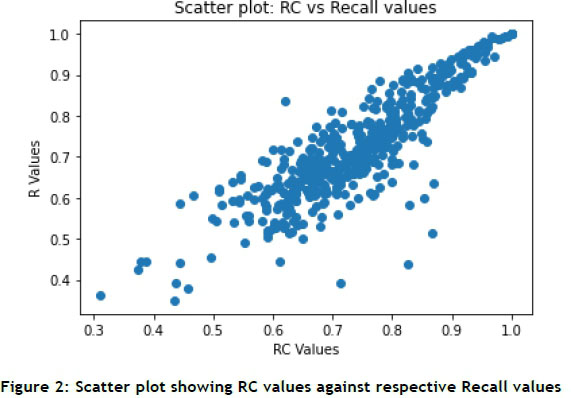
RC is arguably the most valuable metric, as it represents the proportion of a unique patient's testing profile that is recommended to the clinician. The data summary in Table 3 indicates that 74% of every patient's testing profile is recommended using the CBR algorithm. Recall is a metric that is closely correlated with RC, as shown in Figure 2. The Recall values indicate how much of the set-filtered population is represented by a specific recommendation for laboratory tests. Interestingly, several of the lower Recall values are supported by relatively high RC values, while the inverse was significantly less common.
The distribution of RC values is shown in Figure 3. As supported by Figure 3, more than 61% of the samples return RC values of higher than 70%.
3.3 Evaluation of feature selection
Features were selected on the basis of their relative measure in gain ratio and mutual information. Features with higher values were better predictors than features with low values. Four of the features showed mutual information scores that were significantly higher than the others, indicating the likelihood that they would be more useful for analysis. One of the four shortlisted features was Provider ID, a unique code assigned to each medical professional. Part of the purpose of this study was to promote the idea that a community of medical professionals make consistent and valuable decisions; therefore, the Provider ID would not be selected as a feature for development.
Mutual information is a valuable tool of analysis in modelling a recommendation system. The method unpacked the relationship between the target and the descriptive features, and allowed the contrast between good predictors and poor predictors to be defined.
3.4 Evaluation of the recommendation system
The high dimensionality and limited population in the dataset added too many constraints for algorithms such as nearest neighbour. It must be noted that, for this study, the performance of the specific recommender system is secondary to defining the utility of the relationship between ICD-10 codes and clinical laboratory tests. Once the utility of this relationship has been defined, a performance comparison between different recommender algorithms may be a useful follow-up study. The CBR algorithm was limited by two primary factors: the size of each set (that is, how many records were associated with a particular set of inputs) and the relative usefulness of the input features for each set (that is, although 'Patient class' is a good descriptor for which a laboratory test is selected, that may not be the case for every set of inputs). As an introduction to the opportunity for a laboratory test recommendation system, it was determined that the primary limitations of the CBR were not enough to prevent a satisfactory analysis of the concept.
4 CONCLUSION
Smart laboratory test requisition would require the rollout of a fully electronic requisition system to support the process. This would include point-of-care technology to support the requisition process. However, significant costs are associated with such a system. The cost benefits would be most clear when examining the savings related to data processing labour, and the cost of poor quality. Still, there are benefits beyond labour that must be considered.
Leveraging ICD-10 codes as a point-of-reference for test requisition could be a key component in the shift to smarter data management in pathology groups. The results achieved using a rudimental laboratory test recommender system indicate that ICD-10 codes could be used as a reference to make informed decisions about clinical laboratory test selection. Furthermore, these decisions would reflect the combined knowledge and experience of a multitude of clinicians, with specific reference to local disease profiles.
External-facing features, such as a recommender system, could facilitate improved decision-making by clinicians. These improved decisions would be likely to improve clinical operations further by optimising the utilisation of clinical laboratories. Pathology groups would be able to manage their resources better by maintaining a degree of influence over the effectiveness of each requested laboratory test. If modern pathology groups are to remain technologically relevant, developing a smarter laboratory test requisition system is crucial. Leveraging powerful and consistent universal references, such as the ICD-10 code, could be integral to effective and efficient future laboratory test requisition systems.
5 REFERENCES
[1] M. Plebani, M. Laposata and G. Lippi, "A manifesto for the future of laboratory medicine professionals," Clinica Chimica Acta, vol. 489, pp. 49-52, 2019. [ Links ]
[2] L. Hong, M. Luo, R. Wang, P. Lu, W. Lu and L. Lu, "Big data in healthcare: Applications and challenges," Sciendo, vol. 2, no. 3, pp.175-197, 2018. [ Links ]
[3] T. J. Drummer, "Health geography: Supporting public health policy and planning," Canadian Medical Association Journal, vol. 178, no. 9, pp. 1177-1180, 2008. [ Links ]
[4] M. Wiesner and D. Pfeifer, "Health recommender systems: Concepts, requirements, technical basics and challenges," International Journal of Environmental Research and Public Health, vol. 11, no. 3, 2014. [ Links ]
[5] L. Guo, B. Jin, C. Yao, H. Yang, D. Huang and F. Wang, "Which doctor to trust: A recommender system for identifying the right doctors," Journal of Medical Internet Research, vol. 18, no. 7 2016. [ Links ]
[6] I. Lapic, G. F. Juros, I. Rako and D. Rogic, "Changing the electronic request form proves to be an effective tool for optimising laboratory test utilisation in the emergency department," International Journal of Medical Informatics, vol. 102, pp. 29-34, 2017. [ Links ]
[7] J. Strausberg, N. Lehmann, D. Kaczmarek and M. Stein, "Reliability of diagnoses coding with ICD-10," International Journal of Medical Bioinformatics, no. 77, pp. 50-57, 2008. [ Links ]
[8] Medical Schemes, "The importance of ICD-10 codes," 2010. [Online]. Available: https://www.medicalschemes.com/medical_schemes_pmb/ICD-10_codes.htm. [Accessed 21 January 2020]. [ Links ]
[9] S. Senthilanathan, "Usefulness of correlation analysis," SSRN Electronic Journal, pp. 1-9, 2019. [ Links ]
[10] D. J. Kelleher, B. M. Namee and A. D'Arcy, Fundamentals of machine learning for predictive data analytics, 1st ed., Boston: Massachusetts Institute of Technology, 2015. [ Links ]
[11] D. Jannach, M. Zanker, A. Felfernig and G. Friedrich, Recommender systems: An introduction, New York: Cambridge University Press, 2008. [ Links ]
Submitted by authors 22 Jul 2021
Accepted for publication 12 Jan 2022
Available online 06 May 2022
ORCID® identifiers
F.K. Hathorn 0000-0002-3368-4037
I.H. De Kock 0000-0003-4136-7418
E. Wasserman 0000-0002-1535-0893
* Corresponding author f. k. hathorn@student.vu.nl
1 It is important to recognise that the size of the recommendation set is determined using tests per patient rather than tests per LRF; this is likely to yield a comprehensive set of tests that are most applicable to the particular patient.

