


Services on Demand
Article
 English (pdf)
 Article in xml format
 Article references
Indicators

Related links
-
 Cited by Google
 -
 Similars in Google
Share

 Permalink
South African Journal of Industrial Engineering
On-line version ISSN 2224-7890
Print version ISSN 1012-277X
S. Afr. J. Ind. Eng. vol.32 n.3 Pretoria Nov. 2021
http://dx.doi.org/10.7166/32-3-2634
SPECIAL EDITION
Developing a structured system for specialised industrial reporting
S. TaljaardI, *; S.G.J. van NiekerkI; J.C. VoslooI; J.N. du PlessisII; J.H. van LaarII
ICRCED-Pretoria, North-West University, South Africa. S. Taljaard: https://orcid.org/0000-0002-5162-6340; S.G.J. van Niekerk: https://orcid.org/0000-0003-2688-2884; J.C. Vosloo: https://orcid.org/0000-0003-1063-0252
IIDepartment of Industrial Engineering, Stellenbosch University, South Africa. J.N. du Plessis: https://orcid.org/0000-0002-7080-726X; J.H. van Laar: https://orcid.org/0000-0003-0457-328X
ABSTRACT
Reporting assists with informed decision-making. For industrial processes, accurate reporting of data can be vital to the success of a project. Reporting efforts can be scaled and automated by making use of software tools and products. It is often the case that tools that are not developed for reporting purposes (e.g., spreadsheets) are used to report on industrial data. This results in a lack of standardisation, and hinders large-scale implementation. Existing reporting software also does not focus on being specialised for both industrial data and large-scale implementation. The study aims to develop a system that addresses these problems. To validate it, the system is implemented on multiple large-scale South African mines, and more than 380 specialised reports are distributed daily using the newly developed system.
OPSOMMING
Verslae help om ingeligte besluite te maak. Akkurate verslaggewing van data kan noodsaaklik wees vir die sukses van projekte in industriële prosesse. Sagteware kan gebruik word om die verslagdoeningsproses te outomatiseer en uit te brei. Dit is egter algemeen dat sagteware wat nie ontwikkel is vir verslaggewing oor industriële data nie, gebruik word daarvoor (byvoorbeeld sigblaaie). Dit lei tot 'n gebrek aan standaardisering en belemmer grootskaalse implementering. Bestaande verslagdoening-sagteware is ook nie ontwikkel vir grootskaalse implementering met spesifieke fokus op industriële data nie. Die studie het ten doel om 'n sagtewarestelsel te ontwikkel om hierdie probleme aan te spreek. Om die stelsel te valideer, is dit geïmplementeer op verskeie grootskaalse Suid-Afrikaanse myne. Meer as 380 gespesialiseerde verslae word daagliks versprei deur die nuut-ontwikkelde stelsel te gebruik.
1 INTRODUCTION
1.1 The need for industrial reporting
Many industries require reports for the documentation of specific values. These can include the quality of products for the food industry, or billing reports for the oil and energy industries. Kok [1] reports how demand has always been growing for industrial reports.
Kok [1] stresses that there is a difference between business data and industrial data. Business reports typically provide lists of information, totals, and monetary values. Industrial applications have additional data sources in the form of time-series data. This data is generated by machinery and process equipment, and the measuring equipment that is installed on them.
For the data to be useful, or to be processed into useful information, calculations are required. Examples of these are equipment run times, cycle counts, and utilisation percentages. Time-aware calculations are often required, such as on incremental meter reading values or unevenly distributed time-series values. Furthermore, industries also require subject-specific calculations - for example, the energy content of fuels, fuel-mixture ratios for furnaces, and the efficiency of metallurgical recovery [1].
Reports assist with making decisions based on processed data, instead of relying on opinion or intuition [2]. Automating report generation and distribution improves the availability of reports as tools for sharing information, transferring knowledge, and undertaking continuous improvement.
1.2 Industrial reporting landscape
The automation of report generation began in the 1980s with the introduction of spreadsheet software [1]. Over time, reporting companies started creating tools for business reporting. Industrial markets often found it easier (although still not easy) to implement business reporting tools for industrial applications instead of the niche, difficult-to-use industrial options [1]. Industrial applications made up a small percentage of the overall reporting market, leaving no reason for business-related offerings to adapt to the needs of industry [1]. Consequently, the demand for industrial reporting has increased, but the availability of reporting systems has not.
Spreadsheets are still some of the most widely used tools for reporting and business intelligence [3]-[6]. The problem is that generic business tools do not inherently understand or account for industry-specific requirements [7]. Some work is required to use the business software for an industrial application, which leads to increased complexity. Reports become difficult and time-consuming to create and maintain. Spreadsheets become interlinked, making it difficult to find data and calculations [3], [6]. This hinders large-scale implementation (e.g., in the form of automation) and leads to a lack of standardisation.
Specialisation and large-scale implementation are important requirements to allow a sustainable reporting effort. This section summarises the result of a review of the literature. Popular software products were also considered, given their use as industrial reporting tools.
1.3 Industrial specialisation
Substantiating Kok's findings, Perrino et al. [8] have found that software that is specific to its application (i.e., 'specialised') is important for a reporting or business intelligence drive to succeed. As noted by Kok [1], the type of specialisation is industry-specific. It is thus important to consider this when defining the scope of the requirements.
Popular reporting software can work with industrial (time-series) data [9]-[14]. Some are even designed for time-series data [9], [12]-[14]. However, specialisation in respect of industrial calculations is not the focus of this software. Academic research on reporting typically does not include industrial specialisation within the scope of the study [15]-[20].
1.4 Large-scale implementation
For large-scale implementation, the software must be automated [21], expandable [22], and structured [23].
Existing reporting software is not necessarily meant for automation and expansion, or for inclusion in other software. However, it is often possible to do so, with varying amounts of effort. Because of the 'generic nature' of this software, it typically allows the user complete flexibility. While this flexibility can be advantageous, the lack of a fixed design, layout, formatting, and workflow (hereafter referred to as its 'structure') on which to build the report leads to a slew of disadvantages [24]. These include the lack of standardisation in report formatting/presentation, especially by people across different departments. With each spreadsheet report being uniquely built by each user, this leads to an inherent complexity in understanding its workflow [24].
In the literature, the focus is rarely on the large-scale implementation of a reporting effort or software. Tools are often used, but only to generate a single dashboard or report [15]-[20]. Other studies focus on how to design an effective report or dashboard or how to measure its effectiveness [25], [26].
1.5 Need for the study
The literature analysis in sections 1.3 and 1.4 reveals that existing tools do not conform entirely to both requirements. Little has been reported in the literature about the development of such a software tool or the associated requirements. Consequently, there is a need for a reporting system that is:
• specialised for industrial data, and
• implementable on large (industrial) scales (i.e., the ability to implement many reports with the same standard of formatting and workflow by people from different departments).
2 DEVELOPMENT OF SOLUTION
This section makes recommendations on how to develop such a reporting tool. The recommendations have also been followed in this paper, and the results section reports on the implementation of a reporting tool in a case study that serves as validation.
The solution is developed in two main parts. The first focuses on industrial specialisation, while the second part of the methodology focuses on large-scale implementation.
In this research paper, the focus is on the mining industry, where reports are widely used to monitor and continuously improve operational efficiency. These reports cover topics such as water [27] and energy management [28] and equipment condition monitoring [29].
2.1 Industrial specialisation
It is important to determine the industry-specific specialisation required for reporting software [1]. In this study, the data sources are industrial time-series data. The data sources from the mining industry include machinery and meter readings (e.g., machine temperatures, running status, air and water flow rates, temperatures, pressures, and production values). Calculations need to be performed on this data. This includes the 'decumulation' of cumulative energy meter values, as well as thermodynamic/psychrometric calculations for air properties required for mine cooling system performance calculations. Other time-aware calculations are needed, such as exception calculations for condition monitoring and energy baseline scaling calculations to determine the impact of management initiatives.
2.2 Large-scale implementation
2.2.1 Framework selection
To develop the reporting system, the first step is to determine the framework to be used to structure reports. This framework forms the core of how the software is structured. Once the structure is determined, the software is designed and developed with automation and extensibility in mind.
To select a framework, the literature on report structuring was consulted. Literature searches were done, using credible databases, with the title keywords "report AND structur*". IEEE Xplore returned no results. SCOPUS and EBSCO revealed "structured reporting" as a topic in clinical practice and research (mostly radiology). Nobel et al. [30] state that, in this context 'structured reporting' is using a computer tool to create reports with a predefined design, template, or checklist. The clinical literature rarely focuses on the generic development of the structuring framework or on creating these tools. 'Structured reporting' is mostly used as a 'design method' for creating reports.
Taljaard et al. [24] developed a framework for structuring report contents or configurations that are created in Microsoft Excel. In that paper, the authors found that using their proposed fixed structure for specifying the contents of reports as a 'set of instructions' realised benefits in respect of report generation, standardisation, approval, and maintainability. Taljaard et al. [24] recommended the expansion of this structure into a reporting system.
The Taljaard et al. [24] framework was selected for use in this paper. It was also applied in the mining industry, and has been shown in its presentation paper to be valid for the required reports.
2.2.2 Software development
Step two is the development and implementation of this framework as a software system that allows for scalable reporting. The general software development methodology of this system is illustrated in Figure 1.
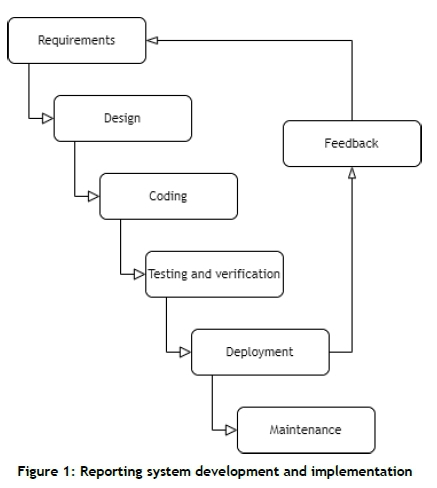
Informed by the framework selected in section 2.2.1, the requirements are considered in the software design (e.g., how object-oriented class information should be shared between components of the software). The code is written to the specification and tested to ensure that the required reports can be generated. If the required reports can be generated by the software, it is deployed for use. As the software is used over time, it is typical to find shortcomings or that it requires extra functionality. The continuous feedback loop is used to inform the developers of the required changes. This iterative process is followed in the software's life cycle. When the software is considered feature-complete, a maintenance period follows during which software bugs are fixed.
The authors have developed the software based on the Taljaard et al. [24] framework, following the method described above. The main design concepts that were followed and the decisions that were made when developing the software are listed below. These concepts highlight the key points that contributed to the successful development and implementation of the system.
• Programming language: no specific language is required. In this study, Python was used owing to its ease of use and popularity in the software and data spheres.
• The software should be extensible and should fit into existing software environments. For this reason, the design of the system is such that the inputs and outputs of the software (to generate a report) are merely configuration and data files, as shown in Figure 2. These input configuration files can be generated by any system, thus allowing for easier integration.
• The software uses LaTeX to typeset and publish the final PDF version of the report. Figures and graphs are saved as separate files, and table contents are generated. Finally, all of these are inserted into the template, along with headings, text, and report-specific logos. All reports are generated based on a single LaTeX template. This allows pre-defined styles and formatting for headings, tables, page layouts, etc.
• All reports generated by the system use the same input file format (configuration and data). This allows the use of a generic main script that generates the report output PDF. The pseudocode instructions are as follows:
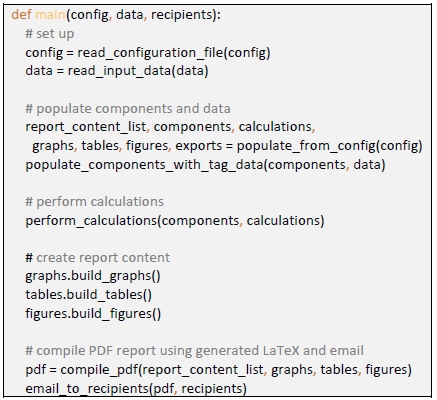
• Although not indicated in the pseudocode for the sake of simplicity, each step of the program has multiple levels of exception handling (error catching). This allows failing steps or components to be skipped, and the user still gets a report, as opposed to no report. Logging of events allows users to determine and resolve misconfigurations.
• Following on from the framework detailed by Taljaard et al. [24], all report content shares the same underlying structure. From a software perspective, this allows for the creation of shared software classes on which child classes can be based. This allows the inheriting of shared characteristics, the elimination of redundant code, and the adding of new features to a parent class that are automatically available for all child classes.
• The fixed layout (owing to the shared classes described in the point above) results in a generic report configuration input file that is still rigid and predictable. This implies that the configuration file can originate 'from anywhere', allowing for further extensibility. Depending on the requirements, different user interfaces can be written to use the same back-end software (e.g., a full reporting suite, and another that uses a more simplified user interface to set up only the calculation and output of intermediate values without generating a report PDF file).
3 IMPLEMENTATION AND RESULTS
As a case study, the software system was implemented as part of the reporting initiative of a South African energy services and optimisation company. Figure 3 illustrates how client data from the mining industry is collected into a central data warehouse. The shaded block indicates how this paper's reporting system was implemented at the company, alongside and interacting with their existing software systems.
The reports generated for the mining clients formed part of service delivery, condition monitoring, energy management, and operational improvement contracts with five business entities from the South African mining industry. Using the developed software, reports are set up by more than 70 internal users working on the contracts with the mining clients. Reports are automatically generated and sent to clients at varying levels of management. The system can detect exceptions, at which point reports are not sent to clients. From the above reporting 'application areas', specialised calculations are required to generate the reports. A few examples are provided below.
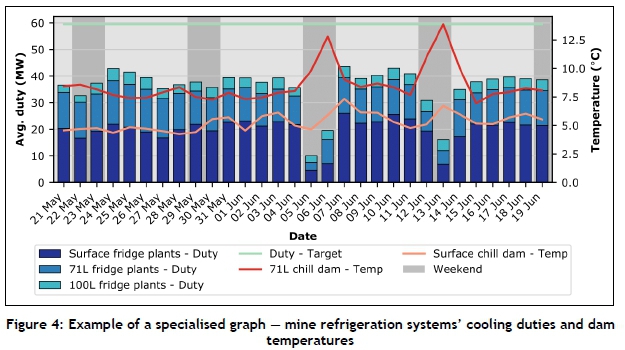
Figure 4 illustrates an example graph from a service delivery report. This report is used to monitor and provide feedback on the performance of the mine's cooling systems. To obtain all of the values required in the report, specialised calculations are needed.
The air wet-bulb temperature is required, but it is not directly measured by the mine's instrumentation. Thus psychrometric calculations are needed. These calculations are specialised, and require iteration to solve for wet bulb temperature from other available process parameters. The mine's refrigeration systems' duties are calculated and trended over a daily period, and monthly for the previous year.
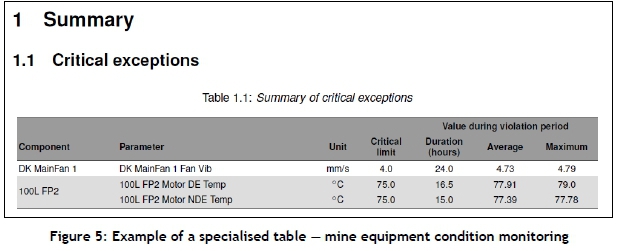
Figure 5 is an excerpt from a condition monitoring exception report. A specialised algorithm is used to determine whether the mine and processing plant equipment parameters fall within warning or critical operating regions. The calculation is such that data quality is considered. The calculation is time-aware in the sense that the equipment should be in an 'alarm state' for long enough to avoid false positive alarms.
Figure 6 illustrates an example graph from an energy management report. Here, time-aware calculations are required to allocate energy usage to the applicable time-of-use billing structure. Further calculations such as energy costs are also performed.
All of the examples provided above form part of the larger reporting initiative. The reporting system is employed in an automated manner. Reports are generated on schedules set per report (e.g., daily, weekly, or monthly). Each report has multiple data sources (tags) linked to them, with varying data resolutions. A report's purpose and requirements will determine the required input data resolutions, which can range from two-minute data intervals up to yearly data points.
The study's system was deployed alongside the company's existing Microsoft Excel-based reporting system. Figure 7 indicates the increasing number of reports generated using the reporting system for the previous 18 months. The intensification of the company's reporting initiative is clearly reflected. The data spikes are due to the occurrence of weekly and monthly reports (which are not generated every day).
The system was implemented over about three years. Over this period, users migrated many of their existing reports from the legacy system to the new system. This can mainly be attributed to the improved reliability of the new reporting system; the Excel-based automations were prone to failure or freezes as a result of user macro errors. Many users also generated new reports in the new system instead of the old one.
The reporting system is currently used to generate more than 380 reports daily. These are automatically checked and sent to clients if no data quality issues are detected. Table 1 contains a breakdown of the number of reports generated per client and the report application areas. The data is from a single snapshot of the reports generated by 07:30 on 22 June 2021. These reports are from varying contract types, and have different triggering intervals, input data resolutions, and report purposes. The table highlights the diversity of the various types of report the system generates and the scale of report generation.
With the reporting system implemented on multiple specialised contracts that require specialised calculations, the system is shown to be sufficiently specialised for industrial reporting that is specific to the mining industry. Concurrently, the system is implementable on a large scale, as shown by the large and increasing number of automated reports generated daily, as well as the system's ability to be incorporated into an existing software environment.
The report structuring framework allows shared classes at the core of the software, which is advantageous to the design and use of the software. The use of a predefined fixed LaTeX templated allows users to ignore report layout/formatting, as this is automatically handled by the template. This has led to the automatic standardisation of reports.
4 CONCLUSION AND RECOMMENDATIONS
As the demand for industrial reporting increased, the need was partially addressed by business reporting solutions. Industrial reporting is specialised, and the reporting tool should allow the required specialised calculations to be performed. Business-class offerings do not always allow for this specialisation without significant effort. Furthermore, these offerings are not always designed with automation in mind. There is a need to develop a reporting system for industrial data that specialises in handling such data while also allowing large-scale implementation.
An existing report structuring framework designed for structuring reports in spreadsheets formed the basis of the reporting system designed in this paper. This fixed structure, which is based on finding the components of report content, and is opinionated in how to specify the use of data in reports, allowed a reporting system to be created that has shared software classes. This made the improved maintainability and expandability of the system possible. To generate a report, only a configuration file and input data are required, leading to easy integration with existing systems.
The reporting system was applied to case studies from the South African mining industry. These reports are of a technical and specialised nature, requiring specialised calculation and data handling. More than 380 reports are generated daily using this system. The reports form part of a diverse set of applications forming part of service delivery, condition monitoring, energy management, and operational improvement contracts with five business entities from the mining industry. The reports use input data in data resolutions ranging from two-minute intervals to yearly data points.
The application of the reporting system for specialised reporting requirements, as well as its automation, serves as validation that the software addresses the need.
The reporting system has a generic and predictable report configuration (input) file. This file specifies the instructions for performing the required calculations and creating the report contents. In this paper, the configuration file was used to generate reports. Since the configuration file can be generated by any means, future work could investigate alternative sources for this configuration file. For example, a simple user interface could be created that allows only easy calculations and saving of the results.
REFERENCES
[1] R. Kok, "Report generation has been limited to those required for compliance," International Society of Automation, 2017. Available: https://www.isa.org/intech-home/2017/july-august/features/report-generation-has-been-limited. [ Links ]
[2] F. Provost and T. Fawcett, "Data science and its relationship to big data and data-driven decision making," Big Data, vol. 1, no. 1, pp. 51-59, 2013. [ Links ]
[3] J. Lucco, "The road to Excel hell is paved with good intentions," ClearPoint Strategy, 2014. [Online]. Available: https://www.clearpointstrategy.com/road-excel-hell-paved-good-intentions-2/. [Accessed March 11, 2021]. [ Links ]
[4] C. Cheng, T. J. Gilmore, C. Lougen, and C. Stovall, "Statistical analysis, data visualization, and business intelligence tools for electronic resources in academic libraries," in Proceedings of the Charleston Library Conference, 2018. [ Links ]
[5] M. Love, "Microsoft Excel: The good, the bad, and the advantage of added BI capability," Sage Intelligence, 2017. [Online]. Available: https://www.sageintelligence.com/blog/business-intelligence/2017/06/microsoft-excel-the-good-the-bad-and-the-advantage-of-added-bi-capability/. [Accessed March 11, 2021]. [ Links ]
[6] H. Clary, "4 surprising reasons to stop using Excel for data reporting & dashboards," ClicData, 2017. [Online]. Available: https://www.clicdata.com/blog/4-surprising-reasons-stop-using-excel-data-reporting-dashboards/. [Accessed March 11, 2021]. [ Links ]
[7] InSource Editorial Board, "Business reports vs industrial reports - What's the difference?" InSource Solutions, 2017. [Online]. Available: https://insource.solutions/business-vs-industrial-reports/. [Accessed March 11, 2021]. [ Links ]
[8] N. Perrino, G. Smith, D. Hyland, and M. Frolick, "Business intelligence challenges for small and medium-sized business," in Contemporary Perspectives in Data Mining: Volume 3, K. D. Lawrence and R. Klimberg (eds). IAP, 2017, pp. 93-101. [ Links ]
[9] Tableau Software, Seattle, WA, USA, Tableau. Available: https://www.tableau.com/. [Accessed March 11, 2021]. [ Links ]
[10] Microsoft, Redmond, WA, USA, Microsoft SQL server reporting. Available: https://docs.microsoft.com/en-us/sql/reporting-services/create-deploy-and-manage-mobile-and-paginated-reports?view=sql-server-ver15. [Accessed March 11, 2021]. [ Links ]
[11] SAP, Waldorf, Baden-Württemberg, Germany, Crystal Reports. Available: https://www.crystalreports.com/. [Accessed March 11, 2021]. [ Links ]
[12] Qlik, King of Prussia, PA, USA, QlikView. Available: https://www.qlik.com/us/products/qlikview. [Accessed March 11, 2021]. [ Links ]
[13] Microsoft, Redmond, WA, USA, Microsoft Power BI. Available: https://powerbi.microsoft.com/en-us/. [Accessed March 11, 2021]. [ Links ]
[14] Sisense, New York, NY, US, Sisense. Available: https://www.sisense.com/. [Accessed March 11, 2021]. [ Links ]
[15] C. H. Rasmussen, M. K. Smith, K. Ito, V. Sundararajan, M. O. Magnusson, E. N. Jonsson, L. Fostvedt, P. Burger, L. McFadyen, T. G. Tensfeldt, and T. Nicholas, , "PharmTeX: A LaTeX-based open-source platform for automated reporting workflow," AAPS J., vol. 20, no. 3, article 52, 2018. [ Links ]
[16] A. Mihãilã, D. Benta, and L. Rusu, "Framework for automated reporting in EU funded projects," Int. J. Comput. Commun. Control, vol. 9, no. 6, pp. 721-729, 2014. [ Links ]
[17] E. Kassem, "Automated sustainability assessment system for small and medium enterprises reporting," Sustainability, vol. 12, no. 14, article 5687, 2020. [ Links ]
[18] R. Harris, L. J. Scott, and C. A. Rogers, "Improving data quality through routine automated reporting using standard statistical software," in Trials, 2017, vol. 18. Available: https://www.sctweb.org/presentations/index.cfm?year=2017. [ Links ]
[19] A. Soraya and B. Ahmad, "Automated dynamic reporting system for Big Data," PhD thesis, Universiti Teknologi MARA Cawangan Perak Kampus Tapah (Malaysia), 2019. [ Links ]
[20] A. Azzini, N. Cortesi, A. Topalovic, and G. Psaila, "RADAR, A framework for automated reporting," in 16th International Conference on Applied Computing, pp. 54-62, 2019. [ Links ]
[21] J. Manyika, M. Chui, S. Lund, and S. Ramaswamy, "What's now and next in analytics, AI, and automation," McKinsey Global Institute, McKinsey & Company, 2017. Available: https://www.mckinsey.com/featured-insights/digital-disruption/whats-now-and-next-in-analytics-ai-and-automation. [ Links ]
[22] S. Zellagui, "Reengineering object oriented software systems for a better maintainability," PhD thesis, Université Montpellier (France), 2019. [ Links ]
[23] S. Gassenmaier, M. Armbruster, F. Haasters, T. Helfen, T. Henzler, S. Alibek, D. Pförringer, W. H. Sommer, and N. N. Sommer , "Structured reporting of MRI of the shoulder - improvement of report quality?" Eur. Radiol., vol. 27, pp. 4110-4119, 2017. [ Links ]
[24] S. Taljaard, S. van Niekerk, and J. Vosloo, "A framework for standardised industrial process data report structuring," in Proceedings of the South African Institute for Industrial Engineers Annual Conference (SAIIE NeXXXt), paper 4222, 2019. [ Links ]
[25] L. A. Botes, W. Hamer, S. van Jaarsveld, and M. Kleingeld, "Finding the four qualities of intelligent industrial reporting," South African J. Ind. Eng., vol. 30, no. 3, pp. 262-276, Nov. 2019. [ Links ]
[26] L. A. Botes, W. Hamer, D. Nell, P. Goosen, and H. G. Brand, "Evaluating the impact of operational reports," South African J. Ind. Eng. , vol. 31, no. 3, pp. 156-169, Aug. 2020. [ Links ]
[27] S. R. Ngwaku, "A strategy for potable water conservation in gold mines," Master's dissertation, North-West University (South Africa), 2020. [ Links ]
[28] A. Ferreira, P. F. Peach, and J. van Rensburg, "Alternative data structures for improved energy reporting and budgeting on gold mining group operations," in Proceedings of the South African Institute for Industrial Engineers Annual Conference (SAIIE NeXXXt), 2019, pp. 403-417. [ Links ]
[29] S. van Jaarsveld, "Developing an integrated information system to assess the operational condition of deep level mine equipment," PhD thesis, North-West University (South Africa), 2018. [ Links ]
[30] J. M. Nobel, E. M. Kok, and S. G. F. Robben, "Redefining the structure of structured reporting in radiology," Insights into Imaging, vol. 11, no. 1, article 10, Dec. 2020. [ Links ]
* Corresponding author: staljaard@researchtoolbox.com

