Serviços Personalizados
Artigo
Indicadores
Links relacionados
-
 Citado por Google
 -
 Similares em Google
Compartilhar
South African Journal of Industrial Engineering
versão On-line ISSN 2224-7890
versão impressa ISSN 1012-277X
S. Afr. J. Ind. Eng. vol.32 no.3 Pretoria Nov. 2021
http://dx.doi.org/10.7166/32-3-2637
SPECIAL EDITION
Design of an automated monitoring and control system for the soft drink capping machine and process mixer
M.O. ChikumbirikeI,#; G. KanyembaI; G.P. ChirindaII,*, †; S. MatopeII
IDepartment of Industrial and Manufacturing Engineering, National University of Science and Technology, Zimbabwe. M.O. Chikumbirike: https://orcid.org/0000-0002-3761-2233; G. Kanyemba: https://orcid.org/0000-0001-7731-2158
IIDepartment of Industrial Engineering, University of Stellenbosch, South Africa. G.P. Chirinda: https://orcid.org/0000-0002-8844-919X; S. Matope: https://orcid.org/0000-0001-5598-1027
ABSTRACT
This paper is based on bottling process optimisation through continuous improvement. A case study was done at XYZ company. The Six Sigma Define, Measure, Analyze, Improve, and Control (DMAIC) methodology revealed that the bottling and capping processes were producing defects at 3 Sigma level. The 5 Whys, Pareto chart, fish bone diagram, and Suppliers, Inputs, Process, Outputs, Customers (SIPOC) model showed that loose-capped bottles (31.6%), under-fills (29.2%), and empty bottles (28.9%) caused the highest cost through poor quality. The monitoring system was designed to monitor the applied torque value, the capping head status, and the beverage temperature upon leaving the heat exchanger. The cooling system on the mix processor was designed using the closed loop control strategy. If the beverage temperature is not within 1 or 2 degrees Celsius, it is directed to secondary cooling; otherwise, it proceeds. The glycol inlet valve is actuated such that the flow of the coolant is adjusted to ensure that the primary cooling is efficient. The results show that it is possible to operate production within the Six Sigma level.
OPSOMMING
Hierdie artikel is gebaseer op botteleringproses optimering deur deurlopende verbetering. 'n Gevallestudie is by maatskappy XYZ geloods. Die Ses Sigma Definieer, Meet, Ontleed, Verbeter, en Beheer metodologie het getoon dat die bottelering en doppie-opsit prosesse defekte by die drie sigma vlak lewer. Die 5 Hoekoms, Pareto-kaart, visgraatdiagram en Verskaffers, Insette, Prosesse, Uitsette, Kliënte model het getoon dat los doppies (31.6%), lae opvulvlakke (29.2%) en leë bottels (28.9%) die vernaamste redes tot hoë kostes as gevolg van swak gehalte is. Die moniteringstelsel is ontwerp op die toegepaste wringkrag te meet, die doppie werkstuk status te monitor en die drankie temperatuur soos dit die hitteruiler verlaat te meet. Die verkoelingstelsel van die menger is ontwerp met n geslote lus beheerstelsel. As die drankie se temperatuur nie binne een of twee grade Celsius is nie, word dit gestuur vir sekondêre verkoeling, anders beweeg dit aan. Die glikol inlaatklep word aangedryf sodat die vloei van die verkoelingsmiddel aangepas word om te verseker die primêre verkoeling is doeltreffend. Die resultate toon dat dit moontlik is om die proses binne die ses sigma vlak te bedryf.
1 INTRODUCTION
The surge in the globalisation of the beverage industry over the past few decades has led more companies to enter international markets. This has resulted in an increase of innovative and cheaper products being produced under efficient processes [1]. Keeping up with the competition to satisfy the customer's unquenchable thirst for low-cost beverages affects the company's bottom line by creating the need for low production costs through reduced waste. It also benefits the planet through the conservation of natural resources and reduced levels of disposable waste [2-3]. Despite efforts to attain world-class beverage manufacturing, many companies still face the major challenge of high defect levels. This is as a result of a lack of technology and a dependence on manual labour, to mention only two factors. This research, which is a case study from XYZ Company, is focused on reducing the defect level of the carbonated soft drink (CSD) filling and capping process.
Carbonated soft drinks are stable at room temperature, but are sensitive to high temperatures. Thus they are filled using cold filling [4]. The major stages in the cold filling process are as follows. Prior to filling, the syrup is first blended with de-aerated water and carbon dioxide. However, the beverage is first chilled before carbonation, because carbon dioxide's solubility rate is enhanced at lower temperatures and in high pressurised conditions. After blending in the mix-processor, the carbonated beverage is transferred to the filling bowl where it awaits filling. The process is called cold filling because of the lower filling temperatures, which are expected to range from 2 to 4 degrees Celsius - the range at which the beverage is stable. Carbon dioxide favours an environment in which there is high pressure and a low temperature to enable maximum gas absorption. If the temperature of the carbonated drink is increased, the dissolved carbon dioxide molecules become unstable and gaining momentum, escaping the beverage. Soon after the filling has been completed, the bottles with the chilled beverage are capped before proceeding to the next station.
The identification stage of the Define, Measure, Analyze, Improve, and Control (DMAIC) methodology showed that the bottle-filling and capping processes were producing defects at 3 Sigma level - that is, 66 800 defects per million opportunities (DPMo). This resulted in the company failing to meet its monthly targets, delaying its meeting of export orders, and incurring financial losses through the increased cost caused by poor quality. Considering the prevailing global economic situation, in which most companies are reeling from the negative effects of the COVID-19 pandemic, it is important to run production with the minimum of defects in order to gain economic returns from the process. Therefore, this research focuses on bottling-process optimisation through continuous improvement. The main objective is to use concept design and development to realise a design that addresses the company's prevailing challenge by monitoring and controlling deviations in the mix processor and the capping machine.
2 LITERATURE REVIEW
This research focuses on reducing defects in the carbonated soft drinks filling and capping process. It uses the Six Sigma strategy, a process improvement strategy that was introduced in 1986 by Bill Smith and Mikel Harry, two engineers who were working at Motorola Corporation at that time. It was first used by the company to improve the production processes in the manufacturing of quasar television sets, before venturing into mobile phones and modern computers. The strategy lived up to its function of defect reduction, as the company managed to reduce defects by 150 times [5]. As a result, the company became known as a global leader in in quality and profit-making [6]. This led to the company winning the first Malcolm Baldrige National Quality Award in 1988 [7]. The term 'sigma' (o) is derived from the Greek alphabet, and is used in statistics as a measure of how far a given process deviates from perfection (variation) [8]. Six Sigma is devoted to reducing variation and errors in production processes [9]. Variation in a process creates opportunities for error, which in turn leads to the risk of producing defects. This is because a process that lacks consistent reliability eventually produces errors and defective products, whereas reducing variance leads to higher-quality products and services. Thus the driving goal of Six Sigma is to eliminate defects [10] so that organisations can increase productivity, decrease overall costs, improve quality, increase customer satisfaction, and create maximum profit [11]. This strategy is best-suited to the unknown - that is, where the cause of the problem is not known. It is designed so that can begin to seek the causes of the problem, prioritise them, and work towards the solution [12]. If the processes are complex and feature many variables, the statistical tools in Six Sigma enable the analysis and processing of the vast available amount of data and the many variables.
This research adopts the define, measure, analyse, improve, and control (DMAIC) methodology [13]. It is a quality tool that reduces variation through continuous improvement or design. The tool has been used in different applications. Sadraoui et al. [14] researched using the Six Sigma together with Lean Six Sigma to reduce water consumption in the Coca Cola Company. It is well-known that the beverage industry uses a lot of water during the production process [15]. The DMAIC methodology used Pareto analysis to identify the sections in the production process that had the highest water consumption. It was determined that production and cleaning were the main sources of high water consumption, using 52.9% of the total monthly water consumption. Cause-and-effect diagrams were used to analyse the possible causes of the high water consumption; histograms and line graphs were used to measure the actual water consumption; and control charts were used to analyse the statistical data. As a result, water consumption was reduced while maintaining quality [14].
Mohinuddin et al. [16] reviewed the literature on how Six Sigma techniques have been used in quality improvement in the manufacture of soft drinks, and demonstrated the ability of these techniques to reduce defects. Their study focused on the research that has used Six Sigma tools to reduce the following: water wastage, out-of-range CO2 levels, CO2 yield loss, out-of-range beverage fill and brix volumes, bottle defects and leakages, and label defects. The study was carried out to provide a solid framework for which specific tool could be applied to solve a quality issue. The study proved the applicability of Six Sigma tools, some of which is tabulated below:
Telis et al. 2011 [17] implemented Six Sigma to reduce the amount of scrap in a water-bottling company. Using the DMAIC methodology, the efficiency of the 500 ml bottle line was increased from 78% to 84%. Putri et al. [18] applied Six Sigma in a water bottling company. Their Pareto analysis identified the main defects to be in the lids and cups, in the sliding machine, volume defects, and dirty water. At 2 047.96 defects per million opportunities (DPMO), the company was found to be operating at an average sigma value of 4.39, which is equivalent to the USA industry average and is regarded as good enough. However, there is a need to work towards the total elimination of defects, and so recommendations were made to undertake routine maintenance and machine checks and employee training, and to ensure that workers are supervised so that they follow standard operating procedures (SOPs).
Over the years, the application of Six Sigma's DMAIC methodology has grown across the FMCG sector. Desai et al. [19] discuss the use of Six Sigma as an effective quality improvement tool in the large-scale food-processing sector. The focus was on the production on powdered milk, and the main objective was to reduce variation in the weight of one-kilogram milk powder pouches. The rejection rate was reduced by 50%. Hakimi et al. [20] focused on its application in the production process of plain yoghurt. Through the design of experiments, the thrust was to improve the quality characteristics in order to improve customer satisfaction. pH is a critical quality characteristic in yoghurt production because it affects its acidity (sourness), thereby affecting customer satisfaction [21]. Acidity is increased by a high fat content, or by a longer-than-desired time being taken during the fermentation of lactose in the milk to produce lactic acid, or a combination of both. The optimum pH range for flavour and texture in good-quality yoghurt is between 4.0 and 4.4 [22]. Any pH level lower than 4.0 results in a more acidic product that is sourer than the customer wants. Through the application of design of experiments, the optimum settings for the incubation time were set to be 12 hours and 1.5% fat. Together with improved production processes, this led to the achievement of a pH range of 4.2 to 4.4, and thus improved customer satisfaction [20].
3 RESEARCH METHODOLOGY
This research is case-study based, and is aimed at eradicating the yield of rejects from the carbonated soft drinks filling and capping process. Both qualitative and quantitative data was collected, and it was analysed using Six Sigma strategy tools. Six Sigma was ideal, as it is well-suited to scenarios in which the root cause of the problem is not clearly defined or is unknown. The implementation of a Six Sigma strategy in the research is intended to identify the production phases in which there are under-fills and loose caps. After this has been done, the research goes on to reduce the soft drinks' deviation from the set target through redesign. The sections that follow present the DMAIC stages followed at the XYZ Company.
3.1 Define
This is the first step when implementing the methodology, and it entails identifying the problem [23]. The suppliers, inputs, process, output, and customers (SIPOC) method was used to aid an understanding the process and to determine areas in which improvement was required. It identified all of the internal and external customers and their expectations before embarking on the endeavour to improve the process. It also ensured that anyone involved in the process in question understood the problem and why there was a need for improvement. Figure 1 below shows the SIPOC diagram. It is important to note that the diagram focuses only on the filling process.
The purpose of this defining stage is to find all the causes of the defects. XYZ Company production was yielding many defects that saw the line running at a 3 sigma level of performance, producing 66 800 DPMO [14]. This was too far from the desirable Six Sigma level, which produces 3.4 DPMO. Table 2 below shows the defect category table for the Pareto chart.
The Pareto chart is used to prioritise the defects. This is a Six Sigma tool that is based on the principle of separating the vital few defects from the trivial many. The Pareto chart drawn from the given data is shown below in Figure 2.
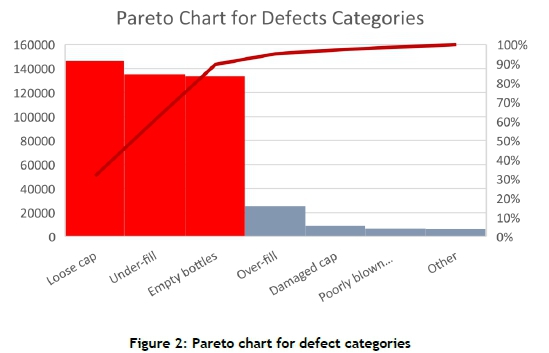
From the Pareto chart it is clearly evident that the vital few defects arose from the major factors:
1. Loose caps (31.6%).
2. Under-fills (29.2%%).
3. Empty bottles (28.9%).
The next stage was to investigate the factors that were contributing to the defect yields. The investigation looked at all the possible procedures that were followed during the filling and capping process. Starting with the under-fills, Figure 3 below shows the contributing factors.
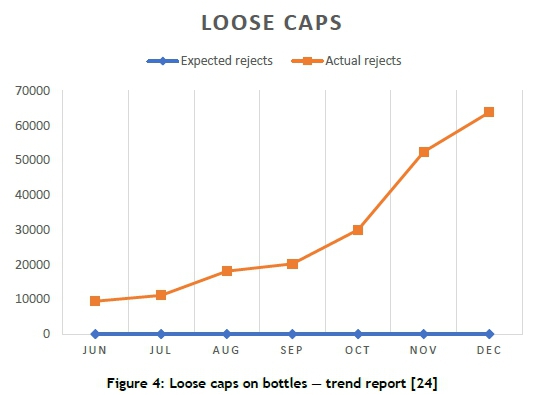
As for the loose caps, the number of defects was on the rise. This is a major drawback during production, as the capping machine is not expected to cause any defects when all of the factors are stable and constant - unlike the filler, which is bound to produce a small number of defects on start-up until the machine has reached its operating speed. This is illustrated in Figure 4 below:
3.2 Measure
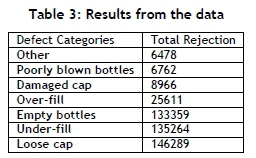
This second phase entails gathering the data from the defining phase to quantify the factors contributing to the high level of defects. The data was gathered through qualitative research that involved interviewing the process supervisors and machine specialists. Data was also gathered through quantitative research, from monthly production reports, and from records of reject yield. Table 3 below shows the total rejections and their causes for three consecutive months.
3.3 Analyse
The analyse phase is focused on revealing the probable causes of the factors that cause the greater number of defects. The root cause analysing techniques that were used were the Pareto chart, the fish bone diagram, and the 5 Whys. Figure 5 below shows the fish bone diagram for under-fills.
The under-fills occurred because the beverage mixture was foaming. Further analysis of why the beverage was doing that was undertaken. The completed 5 Whys sheet is shown below (Table 4).
These techniques showed that the beverage was foaming because the mixture was not being cooled as expected (to below 3 degrees Celsius). The reason was that the cooling system in the mix processor was manually controlled, and was not coping with rapid fluctuations in the beverage temperature. The foaming would then produce under-fills as defects.
The loose caps, on the other hand, were a result of the capping machine not having the in-line torque testing mechanism. The removal torque was tested in the quality laboratory. This lab test was done manually. The capping machine also did not have the mechanism of printing capper head numbers. This required the chemist to manually count the bottles in order to determine the capper head number. This depended on the ability to remember the counted bottles. This method was prone to error and the line chemist would frequently stop the line in order to recalibrate the capper head if it was malfunctioning. This random stopping of machines not only affected the capper, but also caused the high yield of underfills that resulted from the frequent start-ups. The way the torque was being measured and recalibrated on the machine depended entirely on the quality personnel, and so it was prone to error. Inconsistent recalibration leads to loose caps on filled bottles, which in turn causes a great deal of loss if it continues to occur. Figure 6 shows the fish bone diagram for yielding bottles with loose caps.
Since the capping machine did not have an in-line torque testing mechanism, the set torque deviations could not be quickly identified.
3.4 Improve
This is the phase in which solutions are sought for the identified root causes. The decomposition tree below shows the most critical functions of the intended solution design, which are to add an automatic monitoring cooling system to the mix processor and to resolve the problem with the capping machine.
The critical functions decomposition tree identifies the vital few functions of the design. It ensures that all the critical factors are dealt with concurrently, so keeping the production lead time to a minimum. This also entails looking at the inputs of each function, as well as the outputs after each function has fulfilled its role.
3.5 Control
Measures were put in place to ensure the design's sustainability. This involved periodically doing the following:
■ Check sensors' functionality.
■ Change heat exchangers when needed.
■ Service electrical motor on the capping machine.
■ Check leakages on the cooling system to ensure its functionality.
4 SYSTEM DESIGN
The previous section has highlighted that loose-capped bottles (31.6%), under-fills (29.2%), and empty bottles (28.9%) incur the highest cost as a result of poor quality. The design of the system mainly focuses on the loose caps and the under-fills. These constated rejects which could not be recycled or put back on the line. The system does not focus on empty bottles because they can easily be cleaned and/or rinsed and replaced on the filling line.
The monitoring system is designed to monitor the applied torque value, the capping head status, and the beverage temperature upon leaving the heat exchanger. The final design of the capping system was produced with a programmable logic controller (PLC), and used torque sensors because, as the capper header engages to cap the bottle, the sensor records the applied torque. The capping mechanism is based on the principle of magnetism. The capper head consists of a stainless-steel shaft, dimensioned for the appropriate torque, and a second metal ring that fits tightly on the shaft. The ring is made of a special titanium-nickel material that is magneto-elastic. The ring is magnetised circumferentially. Without applied torque, the magnetic field is contained wholly within the ring. However, as torque is applied to the shaft, the magnetic field twists within the ring, and field lines intersect with the surface of the ring in proportion to the amount of torque being applied. The size of the magnetic force is measured by a fluxgate magnetometer (FMG), which is an integral part of the electronics package. The FMG measures and converts the force to an electrical signal. The applied torque will be shown on the human-machine interface (HMI), and any capper head deviating from the set torque will be highlighted on the interface. The final design of the capping system is shown in Figure 8 below.
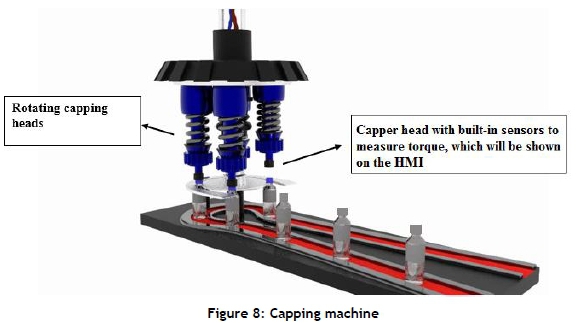
The torque sensors are fitted within the capping heads. The actual torque being applied on bottles is shown on the HMI (Figure 9 below). This allows the torque application to be monitored. This design also enables the maintenance team or machine specialist to see each capper head's individual torque-capping range. When the capper head is out of the capping torque range, a visual signal in a specific colour is shown on the HMI. Green signals that the capper head is still within the set torque range; orange signifies that the capper header is approaching the extreme points of the torque range; and red shows that the capper head is out of the set capping torque range.
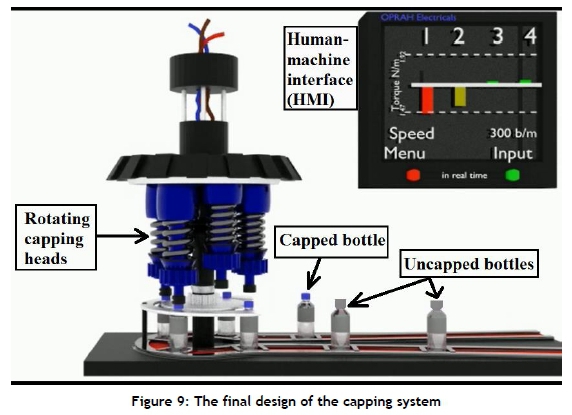
This design is tailored for condition-based maintenance so that the maintenance team can check on the HMI which capper might need adjustment or priority during maintenance planning. The condition of the capper heads would be displayed, enabling the operator to see and notify the maintenance team before the capper heads actually get to the loose torque range limit and place loose caps on bottles. With this design, the yield of loosely capped bottles should be eradicated.
The cooling system on the mix processor is designed using the closed loop control strategy. If the beverage temperature is not within 1-2 degrees Celsius, it is directed to secondary cooling, or else it proceeds. The glycol inlet valve is actuated so that the flow of the coolant is adjusted to ensure that the primary cooling is efficient. The cooling monitoring system ensures that the beverage temperature is displayed on the HMI of the mix processor.
The system was designed using a programmable logic controller (PLC), and uses ball valves to control the flow of glycol, and resistance temperature detectors (RTD) to detect the temperature of the beverage as it flows from the mix processor to the filler bowl. The RTDs used are ideal for this design: they are accurate at lower temperatures, and they also have a quick response time of between one and 50 seconds. The final design for the mix processor cooling system is shown in Figure 10 below.
This cooling design is an improvement, from manual opening to automatic opening and cooling of the pre-filled beverage. Since the system displays the status of the beverage temperature, this will ensure that proactive measures are taken to ensure that the beverage is not filled at a temperature that will cause it to start foaming and so yield under-fills.
5 RESULTS AND DISCUSSION
The new design was aimed at eradicating human interactions when responding to process deviations during production. Human interaction is often subject to error, thus making room for mistakes. These are not good for any business, as they cost not only time but also money. Thus, this design works in automated mode. However, it does provide for the rare occasions when machines malfunction and need to be operated in manual mode. Yet it is best meant to be operated in automatic mode without bypassing any operation.
The results from the simulation showed that, with the new system in place, all of the loose caps defects and 90% of the under-fills caused by beverage foaming will be eradicated. This translates into a total of 286,026 (61.81%) rejects being eradicated from the filling process according to the initial data. This should then leave the production line at the Six Sigma level, with defects per million opportunities (DPMO) of 4.38. This is calculated below:

where: DPMO = Defects per million opportunities
DPO = Defects per opportunity
Defects per opportunity (DPO) is given by:

where: D = Total number of defects
U = Number of units processed
O = Number of opportunities for error per unit
The following data was obtained after the implementation of the new design:
■ Number of units processed (U): 2,008,495 bottles.
■ Number of opportunities for error per unit (O): 20,084 bottles.
■ Total number of defects (D): 176 703 bottles.
Thus, the DPO is calculated as:
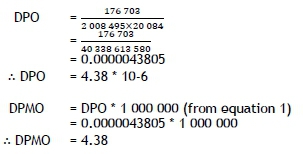
This proves that the implementation of this new design shows that Company XYZ has the potential to operate with minimal defect yields.
6 CONCLUSION
The root cause analysis tools revealed that the mixer processor was under-cooling the beverage before filling, causing the beverage to foam and the bottles to be under-filled. It also showed that the torque on the capper heads would constantly deviate from the set range, thus placing loose caps on the filled bottles.
The focus of this research was on the automatic temperature control on the mix processor so that a cold beverage ranging from 1 to 2 degrees Celsius is released such that it is still at the expected temperature when the bottle is filled. On the capping machine, the focus was on the automated torque deviation sensing mechanism. The sensors were supposed to pick up the deviation and trigger actuations that would adjust the machine so that no defects occurred. The results showed that it is possible to operate at the Six Sigma level. However, strict measures have to be put in place to ensure that other defects are kept to a minimum or avoided altogether. Regular maintenance should also be done on the machine to ensure that it works as expected during production.
REFERENCES
[1] T. B. Long, A. Looijen, and V. Blok, "Critical success factors for the transition to business models for sustainability in the food and beverage industry in the Netherlands," J. Clean. Prod., vol. 175, pp. 82-95, 2018, doi: 10.1016/j.jclepro.2017.11.067 [ Links ]
[2] G. Mutubuki and G. P. Chirinda, "Green manufacturing for waste reduction in the food industry," Proc. 2nd African Int. Conf. Ind. Eng. Oper. Manag., Harare, Zimbabwe, December 7-10, 2020, pp. 1666-1682, 2020. [ Links ]
[3] P. Kumar and P. C. Tewari, "Performance analysis and optimization for CSDGB filling system of a beverage plant using particle swarm optimization," Int. J. Ind. Eng. Comput., vol. 8, no. 3, pp. 303-314, 2017, doi: 10.5267/j.ijiec.2017.1.002 [ Links ]
[4] D. R. P. Azeredo, V. Alvarenga, A. S. Sant'Ana, and A. U. O. S. Srur, "An overview of microorganisms and factors contributing for the microbial stability of carbonated soft drinks," Food Res. Int., vol. 82, pp. 136-144, 2016, doi: 10.1016/j.foodres.2016.01.024 [ Links ]
[5] B. A. Godfrey, "Ten areas for future research in total quality management," Qual. High. Educ., vol. 1, no. 1, pp. 269-298, 2018, doi: 10.1080/10686967.1993.11918636 [ Links ]
[6] T. Pyzdek and P. Keller, Six Sigma handbook, 4th ed. New York, McGraw-Hill Education, 2014. [ Links ]
[7] A. N. Link and J. T. Scott, "An economic evaluation of the Baldrige national quality program," Soc. Value New Technol., vol. 15, no. 1, pp. 83-100, 2006, doi: 10.1080/1043859042000332204 [ Links ]
[8] P. G. LeMahieu, L. E. Nordstrum, and E. A. Cudney, "Six Sigma in education," Qual. Assur. Educ., vol. 25, no. 1, pp. 91-108, 2017, doi: 10.1108/QAE-12-2016-0082 [ Links ]
[9] D. C. Montgomery and W. H. Woodall, "An overview of Six Sigma," Int. Stat. Rev. Int. Stat., vol. 76, no. 3, pp. 329-346, 2008, doi: 10.1111/j.1751 -5823.2008.00061.x [ Links ]
[10] A. U. Samuel, F. Oyawale, and O. S. Fayomi, "Effects of waste management in beverage industries: A perspective," J. Phys. Conf. Ser., vol. 1378, no. 2, p. 022048, 2019, doi: 10.1088/1742-6596/1378/2/022048 [ Links ]
[11] J. Antony, A. Kumar, and R. Banuelas, Eds., World class applications of Six Sigma: Real world examples of success. New York, Routledge, 2006. [ Links ]
[12] A. Jayaram, "Lean Six Sigma approach for global supply chain management using Industry 4.0 and IIoT," 2016 2nd Int. Conf. Contemp. Comput. informatics, pp. 89-94, 2017. [ Links ]
[13] R. Snee, "Six Sigma: The evolution of 100 years of business improvement methodology," Int. J. Six Sigma Compet. Advant., vol. 1, no. 1, pp. 1-17, 2004, doi: 10.1504/IJSSCA.2004.005274 [ Links ]
[14] T. Sadraoui, A. Afef, and J. Fayza, "Six Sigma: A new practice for reducing water consumption within Coca Cola industry," Int. J. Six Sigma Compet. Advant., vol. 6, no. 1-2, pp. 53-76, 2010, doi: 10.1504/IJSSCA.2010.034856 [ Links ]
[15] A. E. Ercin, M. M. Aldaya, and A. Y. Hoekstra, "Corporate water footprint accounting and impact assessment: The case of the water footprint of a sugar-containing carbonated beverage," Water Resour. Manag., vol. 25, pp. 721741, 2011, doi: 10.1007/s11269-010-9723-8 [ Links ]
[16] K. S. M. Mohinuddin, V. Vivekanand, and C. Jayakumar, "Literature review on the usage of Six Sigma techniques for improvement of quality in soft drink beverage and bottling industries," IOP Conf. Ser. Mater. Sci. Eng., vol. 1033, no. 1, p. 012006, 2021, doi: 10.1088/1757-899X/1033/1/012006 [ Links ]
[17] E. S. Telis, C. Tson, G. Besseris, and C. Stergiou, "Application of Six Sigma methodology in efficiency enhancement and scrap reduction in a water-bottling company," Int. J. Six Sigma Compet. Advant., vol. 6, no. 4, pp. 301-320, 2011, doi: 10.1504/IJSSCA.2011.040677 [ Links ]
[18] B. A. D. Putri and D. Handayani, "Analysis of product quality control using Six Sigma method," IOP Conf. Ser. Mater. Sci. Eng., vol. 697, no. 1, p. 012005, 2019, doi: 10.1088/1757-899X/697/1/012005 [ Links ]
[19] D. A. Desai, P. Kotadiya, N. Makwana, and S. Patel, "Curbing variations in packaging process through Six Sigma way in a large-scale food-processing industry," J. Ind. Eng. Int., vol. 11, no. 1, pp. 119-129, 2015, doi: 10.1007/s40092-014-0082-6 [ Links ]
[20] S. Hakimi, S. M. Zahraee, and J. M. Rohani, "Application of Six Sigma DMAIC methodology in plain yogurt production process," Int. J. Lean Six Sigma, vol. 9, no. 4, pp. 1-17, 2018, doi: 10.1108/IJLSS-11-2016-0069 [ Links ]
[21] R. R. Shaker, R. Y. Jumah, and B. Abu-Jdayil, "Rheological properties of plain yogurt during coagulation process: Impact of fat content and preheat treatment of milk," Food Eng., vol. 44, no. 3, pp. 175-180, 2000, doi: 10.1016/S0260-8774(00)00022-4 [ Links ]
[22] A. L. Granata and C. V Morr, "Improved acid, flavor and volatile compound production in a high protein and fiber soymilk yogurt-like product," J. Food Sci., vol. 61, no. 2, pp. 331-336, 1996, doi: 10.1111/j.1365-2621.1996.tb14188.x [ Links ]
[23] J. Antony, A. S. Bhuller, M. Kumar, K. Mendibil, and D. C. Montgomery, "Application of Six Sigma DMAIC methodology in a transactional environment," Int. J. Qual. Reliab. Manag., vol. 29, no. 1, pp. 31-53, 2012, doi: 10.1108/02656711211190864 [ Links ]
[24] XYZ Company, Quality Report, 2019, (unpublished). [ Links ]
* Corresponding author: 24588636@sun.ac.za / gibbschirinda@gmail.com
# The author was enrolled for a B Eng. (Industrial and Manufacturing) degree in the Department of Industrial and Manufacturing Engineering, National University of Science and Technology, Zimbabwe.
† The author was enrolled for a PhD (Industrial Engineering) in the Department of Industrial Engineering, University of Stellenbosch, South Africa


