


Services on Demand
Article
 English (pdf)
 Article in xml format
 Article references
Indicators

Related links
-
 Cited by Google
 -
 Similars in Google
Share

 Permalink
South African Journal of Industrial Engineering
On-line version ISSN 2224-7890
Print version ISSN 1012-277X
S. Afr. J. Ind. Eng. vol.32 n.3 Pretoria Nov. 2021
http://dx.doi.org/10.7166/32-3-2635
SPECIAL EDITION
Systemic efficiency: a key consideration in the design of new dedicated rail freight projects in southern Africa
F. MülkeI, *; J. HavengaII; J. van EedenI
IDepartment of Industrial Engineering, University of Stellenbosch, South Africa. F. Mülke: https://orcid.org/0000-0002-7611-3840; J. van Eeden: https://orcid.org/0000-0001-9684-2357
IIDepartment of Logistics, University of Stellenbosch, South Africa. https://orcid.org/0000-0003-2844-719X
ABSTRACT
Crafting systemic engineering fundamentals into a structured design model that includes demand definition, systemic design, and efficient operations enables the railway design process to achieve viable solutions. The design model incorporates types of efficiencies that are fundamental to successfully operating new railway systems. A relationship between the geometrical layout of the new track and the technical efficiency of the dynamic hauling process and fuel consumption was determined. New results were obtained from simulation work done on the operating efficiency of the crossing of trains, and cast new light on the traditional formulae used for track capacity. The effect of total systemic efficiency on the resultant cycle time and rolling stock fleet sizes is demonstrated in this paper. The rail tariff and the internal rate of return (IRR) are interlinked, and the effect of inefficiencies on the performance and returns of the new railway project is illustrated.
OPSOMMING
Die samestelling van sistemiese ingenieursgrondbeginsels in 'n gestruktureerde ontwerpmodel wat aanvraag definisie, sistemiese ontwerp en doeltreffende bedrywighede insluit, stel die spoorwegontwerpproses in staat om lewensvatbare oplossings te bereik. Die ontwerpsmodel inkorporeer tipes doeltreffendheid wat fundamenteel is vir die suksesvolle bedryf van nuwe spoorwegstelsels. 'n Verwantskap tussen die geometriese uitleg van die nuwe spoorbaan en die tegniese doeltreffendheid van die dinamiese sleepproses en brandstofverbruik is bepaal. Nuwe resultate is verkry uit simulasiewerk wat gedoen is oor die bedryfsdoeltreffendheid van die kruising van treine, en werp nuwe lig op die tradisionele formules wat vir spoorkapasiteit gebruik word. Die effek van totale sistemiese doeltreffendheid op die gevolglike siklustyd en rollende materiaal vlootgroottes word in hierdie artikel gedemonstreer. Die spoortarief en die interne opbrengskoers is onderling gekoppel, en die effek van ondoeltreffendheid op die prestasie en opbrengste van die nuwe spoorwegprojek word geïllustreer.
1 INTRODUCTION
New dedicated rail freight projects for the export of mining products have been designed and constructed in Southern Africa in the past two decades. These design processes were mostly infrastructure-based and were divorced from operating practices. This paper attempts to illustrate the effect of efficient operating processes on the performance of railway systems and the capacity of capital-intensive production factors such as rolling stock and the associated returns on investment.
A design model was developed to integrate and optimise the production factors and to determine the financial viability of a dedicated rail freight project at the pre-feasibility stage of the development of a pit-to-port railway project.
'Full productive efficiency', as it relates to the railway environment, refers to the lack of waste [1], [2]. The inefficiency of a railway operating system stems from wasted time and, specifically, as the resulting increase in the turnaround time (TAT) or cycle time causes an increase in production factors [3], [4], [5], [6], [7], [8]. The effect of delays in the operating of trains was simulated and included in a haulage submodel as the input to a financial cash flow model.
The total systemic efficiency was determined for operating scenarios, and casts new light on the traditional approach to the analysis of the train crossing designs of new railway projects. The impact of levels of inefficient operating on the internal rate of return (IRR) was illustrated, and will serve as a critical consideration in the evaluation of the viability of new railway projects.
2 OBJECTIVES OF THE RESEARCH
The primary objective of the research was to compile a design model that integrates the design processes and production factors of new dedicated rail freight projects. The sub-objectives in this research study were to derive and quantify the design parameters of the model - namely:
Sub-objective No.1: The effect of the macro-alignment of the track work on the rolling stock performance of the project.
Sub-objective No.2: The effect of variations in release times of trains into the main line and train speed performance on the total systemic efficiency of the system.
Sub-objective No.3: The effect of efficiency levels on the utilisation of economies of scale of the capacities of a ramping-up railway system.
Sub-objective No.4: The effect of operating levels of efficiency on the rolling stock fleet size and the IRR of the project.
3 CAPACITIES OF A RAILWAY SYSTEM
The capacities [3], [9], [10] of sub-systems of a railway system that are referred to in this paper comprise:
• The track length of 500 kms that links a mining load-out site in the hinterland with a port of export [3].
• The power of the type of diesel-electric locomotives [11].
• The payload of the freight to be carried by a train consist between the mining load-out site and the port of export and the axle load of rolling stock [12].
• The structural capacity of the track to bear the trains' axle loads [12], [13], [14].
• The number and spacing of train crossing loops per railway route. The train crossing capacity of a railway line is represented by the longest section between two crossing loops on a single line [2], [15].
• The number of laden trains to be operated on the main line per day [15].
When considering the capacity and efficiency of a railway system, each influencing factor [3] plays a role in either increasing or decreasing the operating capacity of the system.
4 SUMMARY OF THE METHOD
A design model was developed for a generic railway project of a route length of 500 kms. The method comprised the following input processes:
• The demand [16], as the main driver of the activity levels of the project, was varied from low volumes of less than 10 Mtpa to 28 Mtpa, with axle loads ranging from 18.5 tons to 20 tons and 26 tons [17].
• A sub-model was developed that was based on the performance of the traction to haul loaded train sets. The macro-geometric parameters that influence the haulage process of trains were researched and incorporated into the sub-model. Three typical types of locomotive were used in the ramp-up of volumes in the haulage model.
• The effects of delays were simulated to determine the total systemic efficiency for cases of delayed train releases and sub-standard speed performances. Their effect on the variable capex in the form of the rolling stock fleet size was identified.
• A costing model was developed to research the impact of efficiency levels of operating processes on the deployment of capital-intensive production factors - i.e., the rolling stock and the number and lengths of crossing loops - and on the IRR.
The context of the development of the haulage sub-model and the simulation sub-models is described in the sections below.
5 THE EFFECTIVE DESIGN OF THE TRACK AND TRAIN HAULAGE PROCESS
5.1 The relationship between linearity and volumetric characteristics of a new railway network
The macro-alignment of a railway network consists of its horizontal and vertical alignments [18]. The horizontal alignment consists of curves and tangent (straight) sections of line, and represents the linear characteristics of the alignment in respect of track length capacity. The vertical sections consist of gradients, the steepest of which is referred to as the 'ruling grade'. The design parameters of the horizontal and vertical alignments are selected, taking into consideration the volumetric demand of the project and the restrictions of the terrain [19], [20], [21], [22], [23], [24]. The depth of cuttings is an indicator of the standard of the earthworks and of the volume determination of a new railway line, as illustrated in Figure 1 below.
The macro-geometric layout of the track-work in the form of curves and gradients [25] determines the external forces that act as guiding forces on the bogies of the train.
As the gradient of the track is increased, the resistive forces are increased, and consequently the train consist is reduced.
In the case of the railway project deploying rigid bogies, where the wheels contact the outer rail on a curve at an angle-of-attack (0), the resistance force exerted on the rolling stock is calculated by the following empirical formula [26] in (1):

where:
• Rcurveis the resistance exerted on the train (N) and R is the radius of the curve (m) and g is the gravitational force.
The degree of curvature [27], [28], [29] of a railway line is defined as the angle (0 °) that subtends a 100 feet (30.47976m) chord in relation to a specific radius, as in (2):

where:
• R is the radius of the curve and 0 the degree of curvature.
Scheffel and Von Gericke [26] developed the self-steering bogie for the then SA Transport Services, and proved through field tests that the Rcurvecurve resistance approached zero. The resistance of curves is regarded as negligible when equipping trains with self-steering bogies [26], [30].
During the design of a new railway system, crossing loops are spaced at equal distances. Following the design stage, which produces detailed track layout plans, the crossing loops are re-spaced at the equal running times of trains.
5.2 Design of the train consist
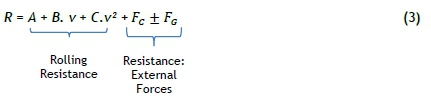
The equation for the resistance to movement created by a train set, as formulated by Davis [31], represents the rolling resistance exerted on the locomotive. The force (R) that opposes the motion is created by the friction of the axle bearings, resistance between the wheels and the rail, air resistance, and external forces, as shown below in (3). The external forces acting on the movement of the train are created by the gradients of the track work and the curvature [32].
where:
• R is the train resistance, comprising the rolling resistance and the resistance owing to external forces, in N/ton;
• A is the static and dynamic train resistance component that is dependent on the bogey construction, the axle load, and the inherent mechanical friction of the train set;
• B represents the flange friction factor between the track and train wheels and the suspension damping, which varies with train speed;
• C is the aerodynamic resistance factor at the front and rear of the train set and any additional turbulence effect not covered by B;
• v is the train speed(km/hr);
• Fc is the curve resistance owing to energy dissipation at the wheel-rail interface due to sliding, creep, and friction experienced by rigid bogies; and
• FGis the gradient resistance.
Resistive forces acting on the locomotive and the wagons were tested by Szanto [33] on the Hunter Valley coal line and the Pilbara iron ore line in Australia. The components and factors A, B, and C were adopted, as they correlated with dedicated rail freight projects in Southern Africa. The total resistive forces on rolling stock derived from the experimental results of Szanto [33] are shown in Table 1 below, where M is the mass of the vehicle (108 tons,120 tons, and 156 tons for the GT38ac, GT42ac, and GT46ac type locomotives respectively. For railway wagons, the gross mass is 74 tons, 80 tons, and 104 tons for freight wagons with axle loads of 18.5 tons, 20 tons, and 26 tons respectively.
The quantification of the wagons consist that a locomotive can haul against the ruling grade to top the track summit is calculated at the speed of 20 km/hr in (4):

The resistive components for solving (3) for three types of locomotives, which have been incorporated into the sub-model, are shown in Table 1.
The available drawbar horsepower of a locomotive is determined by solving the empirical formula [34] in (5):

where:
• the power of the above locomotives is 2 000, 3 000, and 4 300 hp respectively, and the Transmission Efficiency ( ETransmission) for a GT46ac locomotive is 0.94 [26] [34].
The number of laden wagons that a locomotive can haul on a gradient with summit speed (V) of 20km/hr is calculated by dividing the available drawbar force by the resistance force per railway wagon in (6):

where:
• the tractive effort [35] per locomotive is expressed in N/locomotive, and the total resistance per locomotive and per wagon is expressed in N/rolling stock vehicle.
The rolling stock fleet sizes were calculated in a sub-model based on the following approach:
• The demand for the railway project and the productive number of working days per year of the railway project was established.
• The ruling gradient of the railway track was specified.
• The average train speed and the type of locomotive were specified.
• The maximum number of trains/day (slots) was specified to coincide with the cycle time of a train in the loading terminal (e.g., 3 hours dwell time will result in a maximum of eight trains/24 hours).
• The mechanical availability of the locomotives was assumed to be 95% for the base case [36], [37].
The haulage design was based on the required train consist and the number of train trips per year, which was based on the TAT and the number of train slots/day to convey the required demand. (See the dashboard sub-model in Figure 4.)
6 THE TRAIN CROSSING CAPACITY OF THE RAILWAY LINE
The total systemic efficiency was determined by means of train simulation scenarios for variations in average speed versus a range of delayed release times of trains from the inland departure point.
The capacity of a single railway line was determined by the longest section between crossing loops. The running times of trains are referred to as point-to-point running times [38] and, when divided by the travelling distance, render the average speed of the train.
In Figure 2 a condensed version of a train schedule diagram is shown that reflects the train path of a laden train (in blue) and an empty train (in yellow) that cross in a crossing loop.
The empty train enters the crossing loop in advance of the arrival of the laden train, and becomes stationary near the opposite facing turn-out, and waits for the oncoming laden train that has the right-of-way on the main line.
The capacity of a single line was deduced from the Scott formula [39], [40] and the condensed train diagram in Figure 2, as shown in (7):

where:
• C is the capacity expressed in terms of the number of laden train slots per 24 hours;
• V is the average speed of the trains (km/hr);
• L is the spacing of the crossing loops (km);
• Stis the switching time (minutes) of trains in the crossing loop, based on the time that the empty train dwells in the crossing loop; and
• ETotEffis the total systemic efficiency of the loading, unloading, crossing, and running of trains.
The spacing of crossing loops (L) for variations in average train speeds and ETot Eff was solved by means of (7), and the impact on the capex for the creation of train crossing capacity was determined. The calculation process of the number and spacing of crossing loops was incorporated in the haulage submodel.
7 THE EFFICIENCY OF THE TRAIN OPERATING PROCESS: A SIMULATION APPLICATION
7.1 Effect of systemic efficiency factors on rail route capacity
A base case was developed and simulated as the design reference case with which the inefficient scenarios were compared, in order to determine their effect on the rolling stock fleet size [10]. The train movements that were restricted by operating processes were simulated by means of SIMIO software.
The restricting factors simulated were, first; the effect of inefficient loading at the load-out point, which caused the late release of loaded trains into the main line, second; the late release of empty trains from the port into the main line, and third; the late running of trains caused by slower speeds than the scheduled running speed of the line. The late entry of trains was simulated for delayed time increments, of which the cut-off time was taken to be 25 minutes, after which the departure of the train would be cancelled and delayed until the next departure slot. A similar approach was followed by Kuys [41].
Late departures and slow speeds have a ripple effect on trains following and crossing the slow train [2]. This effect becomes greater when the speed of trains in the system increases, as any delay has a greater effect on the efficiency in fast-moving railway systems with low TATs. The systemic efficiency of the system was derived from the extended TAT that the delayed trains use, and is expressed in (8).

where:
• TATdelayed is the TAT performed by delayed trains in the system; and
• TAT scheduled is the TAT scheduled for trains at maximum efficiency, including the provision of redundancy in the form of buffer time TbUffer[13].
From Figure 3 the Ef-systemicranges between 1.00 and 0.68 for travelling time delays. In cases of a buffer time of a 25 minutes delay in train crossing time, the Ef-systemlcis 1.0 at average speeds of 31.5 km/hr, 0.9 at 40 km/hr, and 0.8 at 45 km/hr.
The TATscheduledis calculated by means of the transit times of the laden and empty trains based on the average speed and the rail route length. The buffer time TbUfferis added, and the TATscheduled + TbUffer [13] is calculated to be applied in the calculations for rolling stock fleet size.
7.2 The relationship between systemic efficiency and the rolling stock fleet size
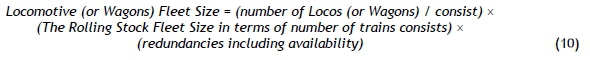
The main drivers in determining the rolling stock fleet size of a new railway system for dedicated rail freight (from pit-to-port) are the demand (Mtpa) and the TAT. The locomotive fleet size is a function of the number of train sets or train consists that are deployed to perform the annual required number of train trips, as reflected in (9) below.

where:
• the fleet size of the locomotives is determined in terms of (locomotives/consist) x the redundancy factor, including availability,
• the fleet size of the wagons is (number of wagons/consist) x the redundancy factor including availability,
• TATdelayedis a function of the systemic efficiency.
The rolling stock fleet size for the demand and restricted capacity of trains per day is calculated by determining the TATscheduledand adding Tbufferto result in TATdelayed. The TATdelayedis applied to determine the fleet size at Ef-systemlcof 1.00 at 31.5 km/hr as the base case. The fleet size is then determined at train speeds applicable to the Ei-systemlclevels of 0.9, 0.8, 0.77, and 0.68 [41]. The additional number of wagons and locomotives required at the reduced efficiency levels represents the rolling stock required to operate at the inefficient level of the system to deliver the target demand. In the event of the fleet size not being productively efficient to supplement the shortfall in annual target demand delivery, the level of actual demand delivery will constitute the target demand multiplied by the reduced efficiency factor Ei-systemlc. Equation (9) is adjusted to reflect the rolling stock fleet size in respect of the number of locomotives or wagons, which is solved by applying (10) below:
To solve the locomotive and wagon fleet sizes required to haul the demand with GT-type locomotives at various systemic efficiency levels, the sub-model shown in Figure 4 was applied.
The results calculated by means of (10) correlated with the train consist designed on the Moatize-Nacala coal line project in Mozambique-Malawi with a demand of 18 Mtpa.
7.3 The actual volumetric efficiency
In the case of determining the performance of the system, the actual volumetric efficiency was determined by (11).

where:
AVeff is the actual volumetric efficiency factor of the haulage operations, AVconveyedperannum is the actual volume conveyed for the year
DVefficient levelis the design volume per year to meet the target demand.
The actual volumetric efficiency factor in (11) is expressed as a ratio, whereas the actual volume conveyed per year is an indicator of the total productivity of the railway system (Mtpa).
8 SYSTEMIC EFFICIENCY AND THE ECONOMIES OF SCALE IN A RAILWAY PROJECT
8.1 The law of diminishing returns in railway projects
Samuelson [42] stated:
Capacity refers to a potential output level and of interest is how the level of output changes in response to changes in the levels of inputs. Although output would initially rise at an increasing level, given increases in the variable input, the rate of increase in output will reach a maximum due to the constricting effect of a limiting fixed variable in the system. This phenomenon is referred to as the law of diminishing returns which demonstrates the marginal increase in inputs that would eventually result in the diminishing of returns.
The concept of economies-of-scale refers to the potential of using the 'unused' capacity of a railway system at marginal increases in input cost. The use of track carrying capacity (train slots/day) that is available for the increased haulage of additional volumes is an example of the use of economies of scale. The effect of economies of scale and of dis-economies of scale is calculated during the quantification of the long-run average cost curve (LAC) [43], [44], [45]. This aspect is incorporated into a cash-flow projection, which forms the basis of the design model in the determination of the rail tariff and the IRR.
The average cost curves (AC-curves in Figure 5) are based on a specific fixed track capacity - e.g., crossing loop configurations. As the capacity of the specific fixed assets is absorbed by an increasing number of trains, the lowest average haulage cost at that point of haulage activity is reached, after which it will increase when additional capacity is created. The new level of capacity creation can be in the form of longer trains with additional locomotive power, which would entail additional capital investment. The next stage of capacity increase would involve increasing the axle loads of the rolling stock. In such a case, additional capital investment would be required in the track superstructure and the rolling stock's carrying capacity - e.g., heavy haul vehicles [23], [46].
The railway operations are productively efficient at the lowest point on the average cost curve where the marginal cost meets the average cost (see points A and C in Figure 5).
In Figure 5, the average cost curves are presented schematically, and are related to the crossing loop capacities, of which the length is a function of the train length and the braking distance. The cost structures of a design case were compiled in a design model to accommodate variations in demand and the effect of the short-run and long-run average cost (AC) curves [47].
On the A-B range of the AC-curve, the volumes are increased, experiencing dis-economies of scale attributable to inefficient train operations. This is attributable to increasing train speeds, which exceed the in-built buffer transit times, as well the increase in train density. At point B on the B-C range, the axle load is increased, and additional train crossing capacity is created to accommodate longer trains [48].
The additional capacity (B-C) on the new AC-curve is absorbed up to the point C, whereafter dis-economies of scale are experienced owing to the increased train speeds and train density. [2]. This phenomenon was detected in the simulation of the train operations. The shape of the envelope curve resembles the Harris curve for railway costs versus track density [49], [50].
8.2 Allocative efficiency
Allocative efficiency occurs when a railway operator's allocative efficiency price equals its marginal cost, and the railway operator does not suffer from concentrated power - i.e., a monopoly [51].
Allocative inefficiency, or price failure, results from inputs in wrong proportions, and causes the total systemic unit pricing to be excessive, or, from a client's point of view, it includes costs for 'dead capacity deployment' or paying for 'dead weight'.
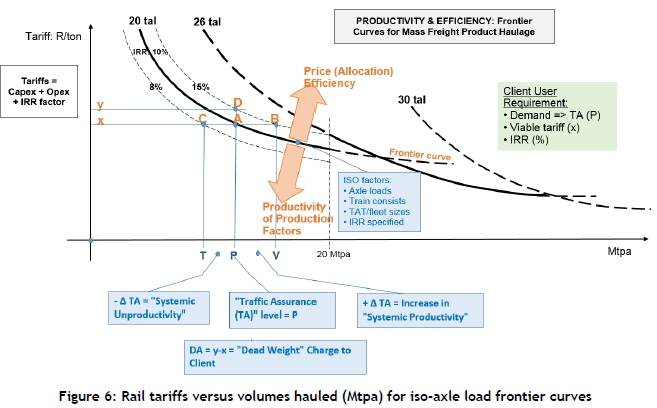
See the frontier curves for axle loads shown in Figure 6 below.
At point A, the railway system is operating efficiently due to the total factor productivity (TFP) experienced at its optimal point.
At point B, the operator has met productive efficiency at a higher level of activity (Mtpa), which renders higher internal returns
At point C, the operator has reduced his productive efficiency at lower activity levels, and, at the same unit price, experiences a reduction in returns.
At point D, the operator has increased his unit price, but operates at the same activity level as at A, and consequently experiences an increase in his returns at the expense of his 'locked in' clients. The client views this phenomenon as paying for 'dead weight' (x-y on curve), and forms the perception that the operator has exploited the monolithic 'natural monopoly' [51], [52], [4] of a railway network.
9 THE EFFECT OF EFFICIENCY ON THE RETURNS OF THE RAILWAY PROJECT
In the case of new railway projects, the analysis of the cost structure indicated that the investment cost of rail infrastructure forms 20.2% of the rail tariff and that the rolling stock and haulage costs form the other 79.8% (see Table 2 below). The haulage costs mainly consist of variable capex and opex over the short and long term, whereas the rail infrastructure costs comprise the track length and the number and lengths of crossing loops.
The fuel and lubricant consumables portion of the total tariff represents 61.59% of the tariff, which corresponds with a tariff percentage of 63%, derived from the haulage tariff for the project between Kapushi-Munama-Sakania in the DRC (2018/19) [53].
The effect of an increase in rolling stock fleet size on the IRR [54], [55], [56] and the project operating at reduced efficiency levels compared with the base case, is summarised in Table 3 below.
The pricing of the railway project in terms of tariffs for activity levels (Mtpa) would need to be based on the production efficient envelope curve (red dotted line) in Figure 5 plus an IRR mark-up [56]. In the case of using the inefficient envelope curve (green dotted line) as the cost basis, the client will experience allocative inefficient pricing.
The relationship between the IRR values and the total systemic efficiency level for the operating range exceeding 0.68 is represented by (12):

where:
• y is the IRR value
• x is the systemic efficiency level.
The conclusion is drawn that a reduction in total systemic efficiency increases the rolling stock fleet size and thus the capex and opex, and reduces the IRR in the relationship reflected in (12).
10 CONCLUSION
The objectives were realised by compiling a design model that integrates the design processes of capacity creation of production factors. The sub-objectives in this research study were met, as concluded below: Sub-objective No. 1 was met by compiling a haulage sub-model that correlates the effect of track gradients on the performance of train consists and the delivery of target annual haulage performance.
Regarding the meeting of sub-objective No. 2, delayed time effects were simulated to determine the total systemic efficiency for delayed train releases and sub-standard speed performances. The effect of efficiency levels of the operations on rolling stock capacities was quantified and design parameters were compiled.
In pursuing sub-objective No. 3, the simulation results informed the definition of parameters applied in the haulage sub-model. The exploitation of economies-of-scale in the stepped deployment of capacities of production factors is a notable feature of the haulage sub-model.
Sub-objective No. 4 was met, in that the impact of levels of inefficient operating on the IRR was derived from the financial results of the design model. The inefficiencies of operations have the effect that either the rail tariff needs to be increased as a form of allocative inefficiency, or the IRR is adversely affected instead.
The conclusion is drawn that a reduction in total systemic efficiency increases the rolling stock fleet size and thus the capex and opex, and reduces the IRR of a railway project.
REFERENCES
[1] S. Carr, "Ask the editor: How to use effective and efficient," 12 October 2016. https://www.learnersdictionary.com/qa/How-to-Use-Effective-and-Efficient. [ Links ]
[2] A. Prince, "Capacity factors in intermodal road-rail terminals," MSc thesis, University of Technology, Gothenburg, Sweden, 2015. [ Links ]
[3] M. Abril, F. Barber, L. Ingolotti, M. Salido, P. Tormos and A. Lova, "Assesment of railway capacity," Transportation Research Part E, vol. 44, pp. 774-806, 2007. [ Links ]
[4] K. Aikaterini, "A note on the theory of productive efficiency and stochastic frontier models," European Research Studies, vol. XIII, no. 4, pp. 109-118, 2010. [ Links ]
[5] S. Grosskopf, "Efficiency and productivity," The measurement of productive efficiency, techniques and applications. New York, Oxford University Press, 1993, chapter 4, pp. 160-194. [ Links ]
[6] J. Jondrow, "On the estimation of technical efficiency in the stochastic frontier production function model," Journal of Econometrics, vol. 19, pp. 233-238, 1982. [ Links ]
[7] C.A. Knox Lovell, "Production frontiers and production efficiency," The measurement of productive efficiency, techniques and applications. New York, Oxford University Press, 1993, chapter 1, pp. 3-67. [ Links ]
[8] T.H. Oum, W.G. Waters II, and C Yu, "A survey of productivity and efficiency measurement in rail transport," Journal of Transport Economics and Policy, vol. 33, pp. 9-42, 1998. [ Links ]
[9] H. Boysen, "General model of railway transport capacity" Vol. 127, Department of Transport Science, Royal Institute of Technology, WIT Transactions on the Built Environment, Sweden, 2012. [ Links ]
[10] A. Lindfeldt, "Railway capacity analysis: Methods for simulation and evaluation of time tables, delays and infrastructure," KTH Royal Institute of Technology, Department of Transport Science, Stockholm, https://www.kth.se/polopoly_fs/L613049.1550158679i/15_002PHD_report.pdf, 2015. [ Links ]
[11] J.A Lozano, J Felez, J de Dios Sanz, J.M. Mera, "Hauling power of a locomotive," retrieved from: https://eng.dieselloc.ru/railway-engineering/hauling-power-of-a-locomotive.html, 2019. [ Links ]
[12] M. Roney, "The fundamentals of vehicle/track interaction," International Heavy Haul Association (IHHA), Guidelines to best practices for heavy haul railway operations, pp. 2-65, Virginia, USA, 2015. [ Links ]
[13] A. Prince, "Capacity factors in intermodal road-rail terminals," MSc thesis in Industrial Ecology, Chalmers University of Technology, Gothenburg, Sweden, 2015. [ Links ]
[14] C. Esveld, "Modern railway track," Duisberg, Germany, MRT-Productions, 1989, chapter 10, pp. 249-259. [ Links ]
[15] H. Krueger, "Parametric modeling in rail capacity planning," in Proceedings of the 1999 Winter Simulation Conference, Montreal, Quebec, Canada, 1999. [ Links ]
[16] M.E. Lewiston, "How to write a paper in scientific journal style and format," Department of Biology, Bates College, Retrieved from https://www.bates.edu/biology/files/2010/06/How-to-Write-Guide-v10-2014.pdf, 2014, pp. 1-16. [ Links ]
[17] UIC, "Information published on 25 September 2018 in the UIC electronic newsletter 'UIC eNews' Nr 615," in IHHA Conference, 15-16 Sept. 2018, Lulea, Sweden, 2018. [ Links ]
[18] B. H. Ghoreishi, "A model for optimizing railway alignment considering bridge costs, tunnel costs and transition curves," Urban Rail Transit, vol. 5, pp. 207-224, 2019. [ Links ]
[19] B. Kufver, "A mathematical description of railway alignments and some preliminary comparative studies," The Swedish National Road And Transport Research Institute (VTI), Linkoping, Sweden, 1997. [ Links ]
[20] D.P. Duffy, "Estimating earthwork volumes," GX, https://www.gxcontractor.com/technology/article/13034514/estimating-earthwork-volumes, 24 July 2018. [ Links ]
[21] A. Skempton, "Embankments and cuttings on the early railways," Construction History, vol. 11, pp. 33-49, 1996. [ Links ]
[22] S. Sahebdivani, H. Arefi, M. Maboudi, "Rail track detection and projection-based 3D modelling from UAV point cloud," https://www.mdpi.com/1424-8220/20/18/5220, Sensors 2020, 20, 5220, pp. 1-15, 2020. [ Links ]
[23] M. Denley, "Research into enhanced tracks, switches and structures," IN2TRACK, Shift Rail, Network Rail, no. GA H2020 730841, pp. 1-191, 2018. [ Links ]
[24] P. Lombard, "Track work structure: Relationship between structure parameters, traffic volumes and maintenance," MSc (Eng) Civil thesis, Pretoria, University of Pretoria, 1976. [ Links ]
[25] G. Bureika, "A mathematical model of train continous motion uphill," Department of Railway Transport, Vilnius, Lithuania, 2008. [ Links ]
[26] H. Scheffel and R. von Gericke, "The development and design of the Scheffel self-steering truck and in-service experience gained on the South African Transport Services," South African Transport Services, Johannesburg,South Africa, 1983. [ Links ]
[27] South African Railways and Harbours (SAR&H), The green book, Johannesburg, South Africa, 1968. [ Links ]
[28] T. Mallery, "Tractive force and hauling power," Catskill Archive, 2010. [ Links ]
[29] R. McGonigal, "Grades and curves," Trains Magazine, [Online] Available at https://trn.trains.com/railroads/abcs-of-railroading/2006/05/grades-and-curves, 2006. [ Links ]
[30] P. Ball, "The Scheffel bogie and the rail gauge," https://www.theheritageportal.co.za/article/scheffel-bogie-and-rail-gauge, The Heritage Portal, 24 May 2016. [ Links ]
[31] W. Davis, "Tractive resistanceof electric locomotives and cars," General Electric Review, vol. 29, pp. 685-708, Oct. 1926. [ Links ]
[32] Coals to Newcastle, "The application of the Davis formula to set default train resistance in open rails," www.elvastower.com/forums/index.php?app=core6module=attach6section=attach6attach_id=82501, 20 November 2017. [ Links ]
[33] F. Szanto, "Rolling resistance revisited," in Conference on Railway Excellence, 16-18 May 2016, Melbourne, Australia, 2016. [ Links ]
[34] Indian Railways Institute, "Horsepower and design parameters," www.irimee.indianrailways.gov.in/instt/uploads/files/1477552393969-Horsepower_6_Design_Parameters_of_GM_Locomotive.pdf [ Links ]
[35] The Mathematical Association, "Tractive effort, acceleration and braking," Transport: Railways, https://www.m-a.org.uk/what_use/TractiveEffortAccelerationAndBraking.doc, 2004. [ Links ]
[36] C. J. Dutton and F. J. Mulke, "Systemic railway engineering relevance in heavy haul railway systems," in 11th International Heavy Haul Association Conference, 2-6 Sept 2017, Cape Town, South Africa, 2017. [ Links ]
[37] D. Milutinovic and V. Lucanin, "Relation between reliability and availability of railway vehicles," FME Transactions (2005), Vol. 33,135-139, https://www.mas.bg.ac.rs/_media/istrazivanje/fme/vol33/3/4.dusan_milutinovic.pdf. [ Links ]
[38] J. Leonard, "A strategic investment decision model for line-haul operations on a developing country railway," PhD dissertation, University of Leeds, Leeds, UK, 1986. [ Links ]
[39] PPIAF, "Technology reform: Toolkit for improving rail sector performance," [Online], Retrieved from: https://ppiaf.org/ppiaf/sites/ppiaf.org/files/documents/toolkits/railways_toolkit/PDFs/RR%20Toolkit%20EN%20New%202017%2012%2027.pdf, 2015. [ Links ]
[40] J. Preston, "A simple model of rail infrastructure capacity and costs. Working Paper 370," Institute of Transport Studies, University of Leeds, Leeds, UK, 1992. [ Links ]
[41] W. Kuys, A. Fenske and V. Klahn, "Exploring the advantages of operating a scheduled railway in the South African context," in 11th International Heavy Haul Association Conference; 2-6 Sept 2017, Cape Town, South Africa, 2017. [ Links ]
[42] P. Samuelson, Economics, New York, Massachusetts, McGraw-Hill, 1970. [ Links ]
[43] T. Pettinger, "Diagrams of cost curves," [Online], Retrieved from: economicshelp.org/blog/189/economics/diagrams-of-costcurves/, 11 Jan. 2019. [ Links ]
[44] BCcampus Open Publishing, "The structure of costs in the long run", , Cost and industry structure," https://opentextbc.ca/principlesofeconomics/chapter7-3-the-structure-of-costs-in-the-long-run/, Chapter 7.3, 2019. [ Links ]
[45] C. Chen, "Course materials for 14.01. Lecture 13: Cost functions, principles of macro-economics. Fall 2007," Open Course Ware, Massachusetts Institute of Technology Downloaded. Oxford Economic Papers, vol. 28, pp. 447-460, Massachusetts, USA, 2007. [ Links ]
[46] H. Tourney and R. Fröhling, "Rail and wheel mechanics," International Heavy Haul Association. Guidelines to best practices for heavy haul operations, Virginia Beach, Virginia, USA, Simmons-Boardman Books Inc., 2015, chapter 3, pp. 3-1 to 3-28. [ Links ]
[47] W. Wang, W. Lin and F. Jao, "Production functions: Principles of microeconomics", Lecture 11, Massachusetts Institute of Technology, Massachusetts, USA, https://resources.saylor.org/wwwresources/archived/site/wp-content/uploads/2012/07/ECON101-MITOCW-UNIT2-D11.pdf, 1 October 2007. [ Links ]
[48] H. Boysen, "More efficient freight transport through longer trains," Transport Forum, Likoping, [Online], Retrieved from: https://www.slideshare.net/hansboysen/session-42-hans-boysen, 1 December 2012. [ Links ]
[49] R. Harris, "Economies of traffic density in the rail freight industry," The Bell Journal of Economics, vol. 8 no. 2, pp. 556-564, 1977. [ Links ]
[50] A. De Bod and J. Havenga, "Sub-Saharan Africa's rail freight transport system potential impact of densification costs," Journal of Transport and Supply Chain Management, http://scholar.sun.ac.za/bitstream/handle/10019.1/16053/debod_subsaharan_2010.pdf?sequence=16isAllowed=y, 2010. [ Links ]
[51] C. Chen, "Course materials for 14.01, Lecture 22. Monopoly. Principles of Macro Economics, Fall 2007. MIT Open Course Ware," Massachusetts Institute of Technology, Massachusetts, USA, 2007. [ Links ]
[52] P. Schmidt and C. Knox-Lovell, "Estimating technical and allocative inefficiency relative to stochastic production and cost frontiers," Journal of Econometrics, vol. 9, no. 3, pp. 343-366, 1979. [ Links ]
[53] A. Parajuli, "Modelling road and rail freight energy consumption: A comparative study," Master of Engineering Dissertation, Queensland School of Urban Development, Queensland University, Australia, 2005. [ Links ]
[54] C. Drury, Management Accounting for Business, 4th ed., Singapore, Seng Lee Press, 2009. [ Links ]
[55] J.A. Kay, "Accountants, too, could be happy in a Golden Age: The accountant's rate of profit and the internal rate of return," Oxford Economic Papers, vol. 28, issue 3, 447-60, 1976. [ Links ]
[56] C. Luiu, M. Torbaghan and M. Burrow, "Rates of return of railway infrastructure investments in Africa," Birmingham, University of Birmingham, https://opendocs.ids.ac.uk/opendocs/bitstream/handle/20.500.12413/14214/422_Rates_of_Return_for_Railway_Infrastructure.pdf?sequence=1&isAllowed=y, 1 September 2018. [ Links ]
* Corresponding author: mulke@netactive.co.za

