


Services on Demand
Article
 English (pdf)
 Article in xml format
 Article references
Indicators

Related links
-
 Cited by Google
 -
 Similars in Google
Share

 Permalink
South African Journal of Industrial Engineering
On-line version ISSN 2224-7890
Print version ISSN 1012-277X
S. Afr. J. Ind. Eng. vol.32 n.3 Pretoria Nov. 2021
http://dx.doi.org/10.7166/32-3-2625
SPECIAL EDITION
Estimating the reliability of condition-based maintenance data using contextual machine-specific characteristics
J.N. de MeyerI, *; P. GoosenI; J.F. van RensburgI; J.N. du PlessisII; J.H. van LaarII
ICentre for Research and Continued Engineering Development (CRCED), North-West University, South Africa. J.N. de Meyer: https://orcid.org/0000-0002-9044-4523; P. Goosen: https://orcid.org/0000-0002-5744-5268; J.F. van Rensburg: https://orcid.org/0000-0002-8246-3396
IIDepartment of Industrial Engineering, Stellenbosch University, South Africa. J.N. du Plessis: https://orcid.org/0000-0002-7080-726X; J.H. van Laar: https://orcid.org/0000-0003-0457-328X
ABSTRACT
In the mining industry, inter-connected machinery operates under harsh conditions 24 hours a day. Naturally, this degrades their state, and can lead to premature breakdowns and production losses. Condition-based maintenance (CBM) is a strategy that plans maintenance schedules depending on the condition of the equipment, and aims to improve decision-making processes. Data collected from machinery for CBM purposes must be reliable to avoid negative impacts on the maintenance strategy. Data reliability can be estimated by comparing multiple data streams; however, they are not always available, and can be expensive. This study aims to estimate the isolated and contextual reliability of single-source CBM data by applying multiple data analytics techniques. An application is designed to analyse current data on a machine level and to determine combined reliability. A case study implementation shows the difference in reliability classification accuracy between the isolated and contextual methods, highlighting the need for them to be combined.
OPSOMMING
In die mynbedryf word komplekse masjienstelsels in ongewenste omstandighede 24 ure per dag bedryf. Dit veroorsaak die agteruitgang van hul toestand en kan lei tot stelsels wat vroegtydig onklaar raak en daaropvolgende produksie verliese. Toestandsgebasseerde onderhoud (TGO) is 'n strategie wat onderhoudskedules beplan afhangende van die toestand van die masjien en beoog om besluitnemingsprosesse te verbeter. Data opgeneem van masjiene vir TGO doeleindes moet betroubaar wees om die negatiewe gevolge op onderhoudskedules te vermy. Data betroubaarheid kan geskat word deur verskeie databronne te vergelyk, maar menigte bronne is nie altyd beskikbaar nie en kan duur wees om te bekom. Hierdie studie poog om die geïsoleerde en kontekstuele betroubaarheid van enkelbron TGO data te skat deur gebruik te maak van verskeie data analise tegnieke. n Sagteware program word ontwerp om data te ontleed op n masjien vlak en die betroubaarheid daarvan te bepaal. n Gevallestudie wys die verskil in betroubaarheidsuitspraak akkurraatheid tussen geïsoleerde en kontekstuele metodes en lig die behoefte uit om die metodes te kombineer.
1 INTRODUCTION
In the mining industry, inter-connected machinery operates under harsh conditions 24 hours a day [1], [2]. These conditions degrade the state of the machinery, and can lead to premature breakdowns and production losses [2].
To avoid unnecessary downtime, intermittent maintenance is performed on the machines to keep them in an operational state [3]. However, inefficient maintenance strategies can also have negative consequences, such as unnecessary downtime and/or delayed maintenance [1]. To minimise the negative impact, maintenance schedules should be optimised to maximise the benefits [4].
Condition-based maintenance (CBM) is a strategy that plans maintenance schedules, depending on the condition of the equipment, and that aims to improve decision-making processes [5]. For CBM to be effective, operational data from the machine is required [5].
Data can be collected using condition monitoring, which involves adding sensors to equipment in order to measure the vital characteristics of the machine [2], [6]. The more reliable the measured data, the more confidence it instils in the decision [7]-[11].
Data reliability can be estimated in various ways [12]. A simple yet efficient method is to compare the data for a specific characteristic from multiple sources. Multiple data streams can be set up by installing more sensors or by making use of secondary data sources, such as third-party measurements or reports [13].
Unfortunately, these additional data streams are not always available, and can be expensive to set up; as a result, single-source data streams are mostly used. The reliability of single-source CBM data can be estimated in two ways: in isolation, or in context [14].
Isolated reliability implies that the data streams are evaluated individually, disregarding external influences [15]. This is useful for gauging whether an installed sensor is calibrated correctly.
By contrast, contextual reliability is calculated on a machine level by considering other data streams [15]. This provides a broader picture of the operational conditions at a machine level. One such example is a machine that is switched off but still incorrectly shows, from the data, that it is drawing electrical current. Contextual reliability can be used to gauge whether the data approved by isolated reliability makes sense in the bigger picture.
Despite the rise in research related to data reliability over the past few years, only limited research has focused on single-source CBM data reliability using contextual methods in the mining industry. This study aims to reduce the knowledge gap by estimating the isolated and contextual reliability of single-source CBM data by applying multiple data analytics techniques to mining systems.
2 RELATED WORK
The amount of CBM data available to companies has increased dramatically over the past few years [2]. With this increase in volume, companies are emphasising the reliability of the data [8]. Two studies that investigated the quality of CBM data were identified as a starting point for this study.
Goosen [12] investigated the quality of industrial data using various methods. From the investigation, a system was created to estimate a quality score for each data point. The study stated that contextual knowledge could increase the accuracy of the data quality calculations. Similar methods could be applied to estimate the reliability of CBM data in an isolated manner.
De Meyer [16] implemented a system to calculate the integrity of CBM data in a contextual manner. The system took a contextual-isolated approach, as the data streams were evaluated in isolation, but with contextual information about the stream itself. This approach can be applied to expand on the isolated reliability calculations to cater for each data stream.
To estimate the isolated reliability, this study will use the metrics identified by Goosen [12], and will include contextual information from each stream, similar to the approach of de Meyer [16]. This study will also include contextual reliability methods and combine the results of both approaches to estimate the overall reliability of the data, as suggested by both Goosen and de Meyer.
This study proposes a system for estimating the reliability of single-source CBM data by making use of the combination of the isolated and contextual reliability methods.
3 METHODOLOGY
A simplified organisational structure, depicted in Figure 1, is used throughout this paper to represent mines generically.
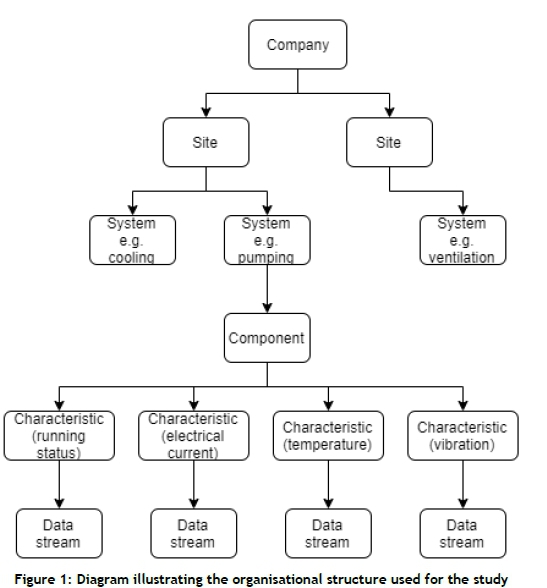
Figure 1 illustrates the terminology used in this paper, and how the different entities relate to one another. A company is the highest level of the organisation. Each company can have multiple sites that are located throughout the world. Every site categorises its machinery into systems with a main focus - e.g., cooling, pumping, ventilation.
Each system can have multiple components, or machines. Each component has various characteristics that are monitored. Depending on the component and monitoring technique, the monitored characteristics can include vibration, sound, temperature, chemicals and particles released into the environment, and physical effects. [17]. For the purposes of this paper, these characteristics are limited to the running status, electrical current, temperature, and vibration of a machine. Each of these characteristics is monitored, and their measurements are associated with a data stream.
3.1 Data collection
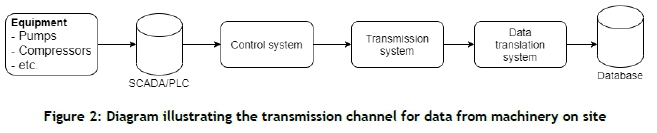
The CBM data is recorded at the mine and sent through a transmission channel to a database. The transmission channel is illustrated in Figure 2.
Each component is monitored by a monitoring system such as a supervisory control and data acquisition (SCADA) system. The monitoring system sends the data to the control system that controls the components. The control system then sends the data to a transmission system that transfers the data over the internet to a translation system. This system translates the incoming data into a more readable format for the endsystems that will use the data before saving it into the database.
Each measurement has two main properties; the timestamp of when the measurement is taken, and the value. For this paper, half-hourly data is used, as this is considered a common measurement interval, and reduces the required storage in the database while maintaining enough information to reflect the operation of the machine accurately. When higher resolution data is available, the half-hourly average is used.
3.2 Machine characteristics
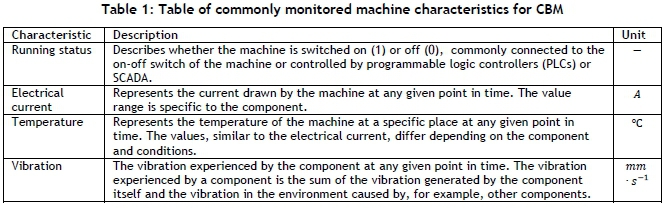
As mentioned earlier, four main characteristics that are used in the mining industry and are commonly monitored have been identified [17]. These four characteristics each have a data stream associated with them, and together they give an overview of the operational status of the machine at any point in time. These characteristics are running status, electrical current, temperature, and vibration, which are described in Table 1.
3.3 Relationships
Each of the characteristics discussed earlier has a relationship with the other characteristics when evaluating them from a contextual point of view. When a component is running, it has to draw electrical current, its temperature should increase to a specific steady value, and it should vibrate more, as described in Equations 1 -3 respectively:

where
• Ecurrentis the electrical current drawn, and
• Rstatusis the running status of the component.

where
• Tambientis the ambient temperature at the component,
• Tcurrentis the current temperature of the component,
• tonis the duration for which the component has been running,
• Tgainis the rate at which the temperature of the component increases while in operation,
• Tlimitis the safety limit of the component where it is switched off, and
• Rstatusis the running status of the component.

where
• Venvironmentis the vibration experienced by the component caused by external factors,
• Vcurrentis the current vibration measured on the component,
• vlimitis the safety limit of the component where it is switched off, and
• Rstatusis the running status of the component.
Similarly, when a component is not running, it cannot draw electrical current, it will start to cool down, and it will vibrate less, as described in Equations 4-6 respectively:

where
• Ecurrentis the electrical current drawn, and
• Rstatusis the running status of the component.

where
• Tambientis the ambient temperature,
• Tcurrentis the current temperature of the component,
• t0ffis the time the component has been switched off,
• Tlossis the rate at which the component cools down, and
• Rstatusis the running state of the component.

where
• Venvironmentis the vibration experienced by the component from external sources,
• Vcurrentis the current vibration of the component, and
• Rstatusis the running state of the component.
Applying Newton's law for the conservation of energy to the component, it can be assumed that, when the component draws electrical current, it will convert some of it into heat and kinetic energy, resulting in a rise in temperature and increase in vibration, as described by Equations 7-8:

where
• Tambientis the ambient temperature,
• Tcurrentis the current temperature of the component,
• tenergy consumedis the time for which the component has been drawing electrical current,
• Tgainis the rate at which the temperature of the component increases when in operation, and
• Ecurrentis the electrical current drawn by the component.

where
• Venvironmentis the vibration experienced by the component, caused by external factors,
• Vcurrentis the current vibration of the component,
• vlimitis the safety limit where the component will be shut off, and
• Ecurrentis the electrical current drawn by the component.
Similarly, when a component stops drawing electrical current, it will eventually cool down and vibrate less, as described in Equations 9-10:

where
• Tambientis the ambient temperature,
• Tcurrentis the component temperature,
• tlast consumedis the time since the component last drew electrical current,
• Tlossis the rate at which the component cools down when not in operation, and
• Ecurrentis the electrical current drawn by the component.

where
• Venvironmentis the vibration experienced by the component from external factors,
• Vcurrentis the current vibration of the component, and
• Ecurrentis the electrical current drawn by the component.
From Equations 1-10, it can be seen that characteristics influence one another, which is important to consider when evaluating the reliability of the data from a contextual viewpoint.
3.4 System design
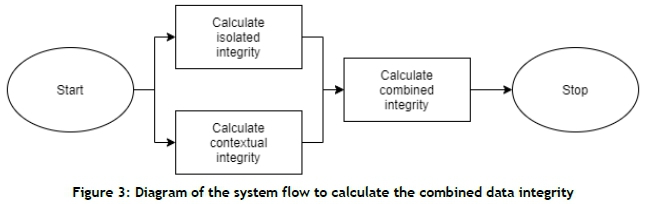
A system was designed to calculate the combined reliability of CBM data. The system flow is illustrated in Figure 3.
From Figure 3, it is shown that the system calculates the isolated and contextual reliability of each data point. It then uses these results to determine the overall reliability.
3.4.1 Isolated reliability
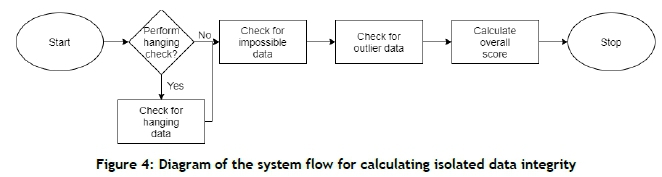
The system calculates the isolated reliability of each data point using the flow described in Figure 4.
The figure above shows how the system will calculate the data integrity for data points from an isolated perspective. This process consists of four stages, with the first being optional, depending on whether or not it is applicable to the data stream.
Hanging data implies a repeating pattern of the same value over an extended period of time. It usually indicates that a sensor is disconnected or broken. This metric check is optional, as it is not applicable to all characteristics. For this study, the running status characteristic will not be evaluated for hanging data, as the data only assumes two values: 0 or 1.
Impossible data are data points that are not possible within the context of the data stream. These include negative and extreme values that are outside the bounds of the component. These impossible values can be used to identify uncalibrated sensors.
Outlier data are data points that fall inside the bounds of possibility for the component, yet do not conform to the expected profile of the data. They can be used to identify malfunctioning sensors or interrupted measurement and/or transmission processes.
If a data point is flagged by any of the data checks, the data point is deemed unreliable from an isolated reliability perspective.
3.4.2 Contextual integrity
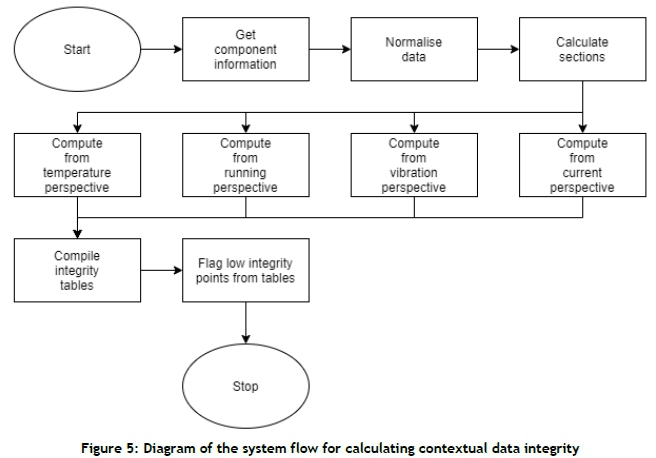
Following the calculation of the isolated reliability calculations, the data streams for each of the four characteristics of a machine are then evaluated from a contextual perspective, as shown in Figure 5.
Figure 5 illustrates the steps the system will take to calculate the contextual reliability of the data points.
First, the system will get the machine model information, which gives context to the data streams linked to the four main characteristics.
Second, the system will normalise all values for a specified range to a range of 0-1. This is done more easily to compare the different characteristics with one another according to the data trends. The unnormalised values are evaluated in the isolated integrity calculations, allowing the contextual calculations to focus on the trends.
Third, the system calculates each section per data stream. This involves breaking the profile into sections, based on whether the data has an increasing, decreasing, or flat trendline.
Using the relationships described in Equations 1-10, the system compares each characteristic's data with the data of the other three characteristics, and compiles a truth table, as illustrated in Table 2.
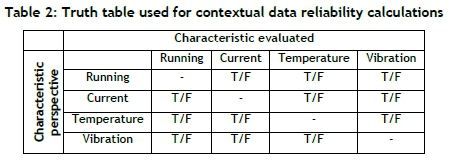
The truth table compares the reliability of each characteristic from the viewpoint of a different characteristic. From this table, the reliability of the data point is calculated using Equation 11:

where
• Rcis the contextual reliability of the data point,
• Sreceivedis the number of high reliability scores (T) for the characteristic awarded by the other three characteristics listed in the characteristic column, and
• Sgivenis the number of high reliability scores (T) given to the other three characteristics by this characteristic, as listed in the characteristic row.
For a data point to be seen as reliable, it should consider other data points to be reliable, and should be considered as reliable by other data points. By considering the reliability of a data point from both perspectives, only data points that fit into the context of the component should be classified as reliable. To this end, the ratio between the scores received and given should be greater than 60 percent. Both scores should also be at least 2 to try to reduce the number of falsely classified high-reliability data points.
3.4.3 Combined integrity
The combined reliability of each data point is the sum of its isolated and contextual reliability scores, as illustrated by Equation 12:

where
• RTis the combined reliability of a data point,
• RIis the isolated reliability, and
• Rcis the contextual reliability.
For a data point to be considered reliable, RTshould have a value of 1. If the value is less than 1, it will be rounded down to 0 and will be considered unreliable.
3.5 Verification
The system was verified using a testing data set with erroneous values to ensure that the system correctly classified the reliability of at least 95 percent of the data points. The results of the testing data set were manually reviewed to ensure that the system was working as expected.
An erroneous dataset was manually selected for two days' worth of data for a compressor. This dataset was deemed a sufficient representation of the compressor's operation, as it contained the following common operation cycles:
• extended running periods,
• extended periods of being switched off,
• periods in which the compressor was switched on and off, and
• periods with data loss.
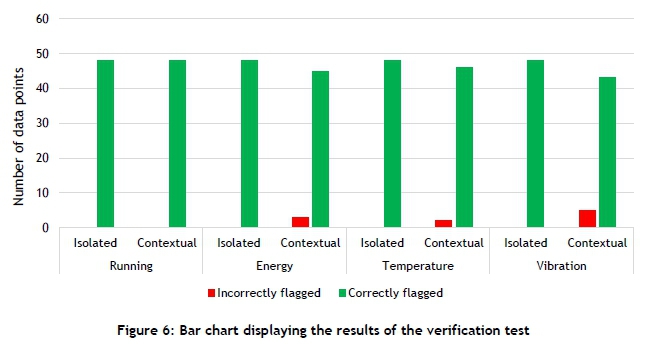
The dataset was examined manually, and the low reliability data points from both an isolated and a contextual perspective were classified. This pre-classified dataset would enable the calculation of the system's accuracy. The results of the verification dataset are shown in Figure 6.
As seen in Figure 6, the system was able to classify 376 of the 384 data points correctly, resulting in an accuracy of 97.92 percent. The system incorrectly classified data points from the contextual perspective for eight data points over three of the characteristics. All eight of these data points were shared timestamps, suggesting that the system was not fully calibrated to the component.
On further investigation it was found that the system was incorrectly classifying data points at the start of steep gradients. To correct this issue, the system was re-calibrated by adjusting the contextual parameters for the component.
4 IMPLEMENTATION AND RESULTS
The system was applied to a case study compressor for a month's data. The dataset included data for each of the four characteristics - running status, electrical current, temperature, and vibration. In the dataset, each of the data streams had instances of low-reliability data points from both isolated and contextual perspectives.
Similar to the verification, each of the data points in the dataset was manually classified to calculate the system accuracy. After implementing the system, the electrical current data stream was classified with low reliability over the majority of the dataset. On further investigation, it was found that the incorrect data stream was linked to the component. After correcting the configuration error, the system was applied again, and obtained the results shown in Figure 7. From Figure 7, it can be seen that the system performed well overall.
The system experienced the most difficulty with classifying the temperature and vibration characteristics. This was surprising, as the relationship between these two characteristics initially seemed to be the weakest. From the results, however, it would seem that this relationship played a large role in the contextual calculations, as the incorrectly classified temperature data points correlated with the incorrectly classified vibration data points. In other words, there is a high likelihood that when a temperature data point is incorrectly classified, the corresponding vibration data point will also be incorrectly classified.
From the above chart it can also be seen that neither the isolated nor the contextual reliability methods were flawless in their classification, with the isolated reliability methods being more accurate. This is to be expected, as the isolated reliability methods only consider a single data stream, leaving less room for incorrect classification owing to the reduced variables involved.
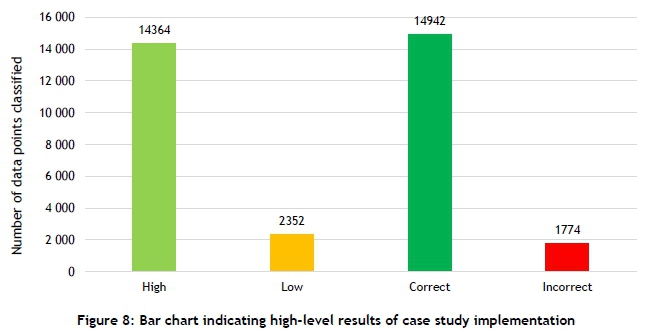
A summary of the case study's implementation is shown in Figure 8.
As is evident from Figure 8, the majority of the data points were of a high reliability. Interestingly, all of the data points that were incorrectly classified were wrongly classified as high reliability points - i.e., false negatives. The system was able to classify 89.39 percent of the data points correctly - considerably less than the percentage achieved during the verification. This could be attributed to the small size of the testing data set compared with the case study data set, as the system was calibrated to the smaller set. This smaller set did not have a comprehensive amount of variety in the data, causing the system to be calibrated too finely. This can be seen as similar to over- or under-training a model.
As stated earlier, the isolated reliability methods classified the data points more accurately. However, when trying to gain insight into the component as a whole, the contextual reliability played a far larger role. In the first attempt to implement the case study, the electrical current data stream was incorrectly linked to the case study component; but the isolated reliability methods did not raise any red flags for this data stream.
However, the contextual reliability methods classified the majority of the data as unreliable, and the overall reliability was classified as low. On further investigation, the incorrect component configuration was discovered. Although the contextual reliability methods did not perform as well as the isolated reliability methods, they were crucial in avoiding false negatives over the majority of the data set. Thus the combination of isolated and contextual reliability methods produced a more reliable result than what would have been produced if the methods had been implemented separately.
5 CONCLUSION AND RECOMMENDATIONS
Machinery in the mining industry endures harsh operating conditions. To ensure an extended lifetime, efficient maintenance strategies such as condition-based maintenance should be implemented. To get the maximum benefit from the strategies, the data used for decision-making should be reliable.
This paper presented a method for estimating the reliability of single-source condition-based maintenance data by making use of isolated and contextual reliability calculations. A system was created, verified, and implemented on a case study. There was an approximate 10 percent difference in accuracy between a testing data set and the case study results. This could be attributed to the small testing data set, which in effect under-trained the system.
Although the isolated reliability methods produced more accurate results in the case study, they have their limitations. Incorrectly configured data streams for components are not identified by the isolated reliability methods, which produces false negatives. Using the combination of isolated and contextual reliability methods will ultimately produce a more accurate classification of the data streams over a large dataset than the two methods individually.
Although the system was accurate during the case study, there is room for improvement. When calibrating the system, a larger data set should be used to ensure that the system is capable of handling most data situations. The relationship between temperature and vibration should be revisited to ensure that this relationship is thoroughly catered for in the system.
An edge case arose during the case study, in which the temperature rose for a period whenever the component was shut off. The initial design did not cater for this with the simple relationship equations between the temperature and the running status (Equations 2 & 5) and between the temperature and the electrical current drawn (Equations 7 & 9). This rise in temperature could most likely be attributed to Newton's law of energy conservation, in which the rotational energy, along with friction, was converted to heat. Once the rotational energy of the component had been depleted, the component started to cool down.
Currently the system only classifies the reliability of the data points. Future work could include using these reliability results to try to identify and classify the events that cause the low reliability.
By implementing the proposed system on mines, unnecessary maintenance time could be reduced. This would result in a reduction of wasted capital and maintenance hours and an increase in the machinery's uptime, and could lead to increased production. Ultimately, implementation of the system will result in a reduction of wasted time, as decisions made using reliable data will be more reliable.
REFERENCES
[1] S. van Jaarsveld, "Developing an integrated information system to assess the operational condition of deep level mine equipment", PhD dissertation, Dept. Compt. & Elect. Eng., NWU, Potchefstroom, 2018. [ Links ]
[2] X. Xu, Y. Lei and X. Zhou, "A LOF-based method for abnormal segment detection in machinery condition monitoring", 2018 Prognostics and System Health Management Conference (PHM-Chongqing), 2018, pp. 125-128, doi: 10.1109/PHM-Chongqing.2018.00027. [ Links ]
[3] S. Jong-Ho and J. Hong-Bae, "On condition based maintenance policy", Journal of Computational Design and Engineering, vol. 2, no. 2, pp. 119-127, Jan. 2015, doi: 10.1016/j.jcde.2014.12.006. [ Links ]
[4] S. Telford, M. Mazhar and I. Howard, "Condition based maintenance (CBM) in the oil and gas industry: An overview of methods and techniques", International Conference on Industrial Engineering and Operations Management, 2011, pp. 1152-1159. [ Links ]
[5] A.K.S. Jardine, D. Lin and D. Banjevic, "A review on machinery diagnostics and prognostics implementing condition-based maintenance", Mechanical Systems and Signal Processing, vol. 20, no. 7, Oct. 2006, pp. 1483-1510, doi: 10.1016/j.ymssp.2005.09.012. [ Links ]
[6] S. Turrin, S. Subbiah, G. Leone and L. Cristaldi, "An algorithm for data-driven prognostics based on statistical analysis of condition monitoring data on a fleet level", 2015 IEEE International Instrumentation and Measurement Technology Conference (I2MTC) Proceedings, 2015, pp. 629-634, doi: 10.1109/I2MTC.2015.7151341. [ Links ]
[7] W. Hamer, "A practical approach to quantify rSA Section 12L EE tax incentives for large industry", PhD dissertation, Dept. Mech. Eng., NWU, 2016. [ Links ]
[8] C. Cichy and S. Rass, "An overview of data quality frameworks", IEEE Access, vol. 7, pp. 24634-24648, 2019, doi: 10.1109/ACCESS.2019.2899751. [ Links ]
[9] Y. Ishizuka, W. Chen and I. Paik, "Workflow transformation for real-time big data processing", 2016 IEEE International Congress on Big Data (BigData Congress), 2016, pp. 315-318, doi: 10.1109/BigDataCongress.2016.47. [ Links ]
[10] J. Rabean, P. Rusnak, E. Zaitseva, D. Macekova, M. Kvassay and I. Sotakova, "Analysis of data reliability based on importance analysis", 2019 International Conference on Information and Digital Technologies (IDT), 2019, pp. 402-408, doi: 10.1109/DT.2019.8813668. [ Links ]
[11] S. Zhang, W. Yao, P. Sun and Y. Zhang, "A condition monitoring data cleaning method for power equipment based on correlation analysis and ensemble learning", 2020 IEEE International Conference on High Voltage Engineering and Application (ICHVE), 2020, pp. 1-4, doi: 10.1109/ICHVE49031.2020.9279409. [ Links ]
[12] A. Goosen, "A system to quantify industrial data quality", MEng thesis, Dept. Compt. & Elect. Eng., NWU, 2018. [ Links ]
[13] H. Liu, F. Huang, H. Li, W. Liu and T. Wang, "A big data framework for electric power data quality assessment", 2017 14th Web Information Systems and Applications Conference (WISA), 2017, pp. 289-292, doi: 10.1109/WISA.2017.29. [ Links ]
[14] A. Juneja and N.N. Das, "Big data quality framework: Pre-processing data in weather monitoring application", 2019 International Conference on Machine Learning, Big Data, Cloud and Parallel Computing (COMITCon), 2019, pp. 559-563, doi: 10.1109/COMITCon.2019.8862267. [ Links ]
[15] A. Immonen, P. Pääkkönen and E. Ovaska, "Evaluating the quality of social media data in big data architecture", IEEE Access, vol. 3, pp. 2028-2043, 2015, doi: 10.1109/ACCESS.2015.2490723. [ Links ]
[16] J.N. de Meyer, "Validating the integrity of single source condition monitoring data", MEng thesis, Dept. Compt. & Elect. Eng., NWU, 2020. [ Links ]
[17] B. Chindondondo, L. Nyanga, A. van der Merwe, T. Mupinga and S. Mhlanga, "Development of a condition based maintenance system for a sugar producing company", SAIIE26 Proceedings, 2014, pp. 1-14. [ Links ]
* Corresponding author jdemeyer@rems2.com

