


Services on Demand
Article
 English (pdf)
 Article in xml format
 Article references
Indicators

Related links
-
 Cited by Google
 -
 Similars in Google
Share

 Permalink
South African Journal of Industrial Engineering
On-line version ISSN 2224-7890
Print version ISSN 1012-277X
S. Afr. J. Ind. Eng. vol.32 n.2 Pretoria Aug. 2021
http://dx.doi.org/10.7166/32-2-2321
CASE STUDIES
Application of an integrated model to a construction and building industry for energy-saving assessment
O.A. Olanrewaju*
Durban University of Technology, Durban, South Africa; http://orcid.org/0000-0002-3099-9295
ABSTRACT
The activities of the building and construction industry have made it one of the highest energy consumers and thus one of the highest emitters of greenhouse gases. The main objective of this study was to develop a system to determine energy saving in the industry. This was achieved through an integrated model of index decomposition analysis, an artificial neural network, and data envelopment analysis. Index decomposition analysis is used to understand the contribution of the factors responsible for energy consumption. These factors are inputs to the artificial neural network to predict the baseline energy consumption. The energy saving is finally determined through data envelopment analysis. The results showed that the integrated model presents a reasonable amount of energy saving in the building and construction industry.
OPSOMMING
Die konstruksiebedryf is een van die grootste verbruikers van energie en dra dus noemenswaardig by tot die vrystel van kweekhuisgasse. Die hoofdoel van hierdie studie is die ontwikkeling van 'n stelsel om energiebesparing in die bedryf te bepaal. Dit is bereik deur 'n geïntegreerde model van indeks ontledingsanalise, 'n kunsmatige neurale netwerk en data omvattingsanalise. Indeks ontledingsanalise word gebruik om die bydrae van verskillende faktore tot energieverbruik te verstaan. Hierdie faktore is insette tot die kunsmatige neurale netwerk om die basislyn energieverbruik te voorspel. Die energiebesparing word dan deur data ontledingsanalise bepaal. Die geïntegreerde model dui op n redelike hoeveelheid energiebesparing in die konstruksiebedryf.
1 INTRODUCTION
The total amount of energy used globally in the construction industry is 204.67Mtoe, whereas the total direct consumption equals 24.57Mtoe, indicating huge amounts of energy being used indirectly [1]. The construction industry and the building sector require techniques that assist in quantifying and reducing the consumption of resources and their environmental impact, and that support decision-making [2]. One of those resources is cement, the production of which involves an energy-intensive process, with an estimated total consumption of energy of two per cent of the world's primary energy consumption [3]. Energy is one of the key resources in constructing buildings, which leads to emission [4]. The energy cost indeed plays a major role in the process of producing cement [5], to say nothing of the amount of energy required for such production and the emission consequences.
Buildings and similar indicators use a lot of energy in the material production, construction, and operation phases [6]. Numerous efforts globally to make buildings more energy-efficient and to reduce energy consumption through energy-saving policies have been looked on from the viewpoint of the consumption of energy [7]. The application of new strategies in the form of green buildings, sustainable material use, and integrated renewable energy systems is important in managing the reduction of energy consumption and enhancing energy efficiency to produce more energy-efficient buildings and infrastructure [8]. It is reported that 30 to 40 per cent of the primary energy is used in building-connected projects [6]. Energy policies' target for buildings is to cut the consumption of energy leading and so reduced their carbon footprint [9].
Considering all emission sources, the contribution of the building and construction industry is huge as a result of massive material and equipment usage [10]. With various environmental issues emerging, the design of buildings is becoming more energy-efficient through the development of new building materials and improved building structures [4]. Various models, however, have made an impact on analysing energy use and emissions for the purposes of energy conservation and emission mitigation. Energy models, particularly those that are integrated to create integrated assessment models (IAMs), are developed to project energy use and the emission of greenhouse gases (GHGs) and to assess their potential [11]. To be able to reduce the amount of energy consumed and the emissions, integrated approaches could be applied [12] ._This study approached the literature on various energy models to understand their impact before considering a theoretical background that could lead to two or more of those models being integrated for the purpose of better analysis. Best-known among the energy models reviewed for this study are index decomposition analysis (IDA), artificial neural network (ANN), and data envelopment analysis (DEA).
Decomposition analysis is extensively used in both energy and environmental studies [4]. Of the various IDA methods, the logarithmic mean Divisia index (LMDI) has received the most attention from researchers. Other authors' arguments in choosing the LMDI as the preferred technique note its perfect decomposition with no residues, independent path, unified mathematical form, consistent aggregation, and ability to handle zero values in any dataset [13,14,15,16]. Index decomposition analysis attributes changes in energy consumption between period 0 and period T to a product of various significant factors. Index decomposition analysis also quantifies the relative significance of each of the factors [4]. It could be in forms that are either multiplicative or additive. Although the forms are inconsequential, the representation and the interpretation of results are most important; this study chose the multiplicative form because of its non-negativity, which can only permit its integration with the other models. An artificial neural network is similar to decomposition analysis when it comes to the different types of neural network used in the literature. The preferred type for this study was the multilayer perceptron (MLP) trained by the backpropagation algorithm. ANN captures non-linear relationships to achieve accurate forecasting [17]. It has a structure of three layers: the input, hidden, and output layers. These layers have one or more neurons, and bias neurons are linked to the hidden and output layers. DEA is based on linear programming that produces a single measure of efficiency [18], and is a powerful data analytic tool that is widely used by researchers and practitioners alike to assess the relative performance of decision-making units (DMUs). It comprises input-oriented and output-oriented models operating under constant returns to scale or variable returns to scale. The input-oriented model operating under the variable returns to scale was adopted for this study. The next section elaborates on the literature review, followed by the data and methodology (section 3), the results and discussion (section 4), and the conclusions (section 5).
2 LITERATURE REVIEW
The search of the literature used the search phrases "LMDI application on energy consumption", "ANN application on energy consumption", "DEA application on energy consumption", and "integrated energy models' applications on energy consumption". In the decomposition literature, few of the existing studies have been reviewed for the purpose of understanding the role of decomposition techniques in the energy field. In the Italian tourism sector, to understand the contributions of energy intensity, economic structure, and industrial structure to the sector's electricity consumption between 1995 and 2017, Bianco [19] applied IDA. The 5.58GWh increase in electricity use was the result of both the industry's energy intensity and its structural changes, while the decrease of 1.337GWh was the result of economic structure. With the interest in reasons why the Korean manufacturing sector had increased its energy consumption over two recent decades, Kim [20] used LMDI in a study focused on the period 1991 to 2011. Activity was the factor most responsible for the energy increase, while structure and intensity had the opposite effect. The study proposed industrial restructuring as well as the introduction of industry-specific energy-saving policies. Achour and Belloumi [21] assessed the energy consumed in Tunisia's transport sector from 1985 to 2014 using LMDI. The factors they considered were energy intensity, transportation structure effects, transportation intensity effects, economic output, and population scale effects. The overall energy intensity proved to be the only factor playing a key role in reducing the amount of energy consumed during the period studied.
Dai and Gao [22] analysed the factors responsible for the changes in the energy consumed in China's logistics industry between 1980 and 2010 using the LMDI. Responsible for those changes were logistics activity, a modal shift in freight transportation, increased transport intensity, and overall improvements in energy consumption, while an improvement in energy intensity controlled the increase. Similar to the studies of [21] and [22], Wu and Xu [23] analysed the energy consumption factors in the Chinese cargo transportation sector between 2000 and 2012 using the LMDI approach. To reduce the country's energy consumption for goods, it was proposed that an optimisation of the transport structure, industrial layout, and promotion of technological progress would be required. Between 1990 and 2009, Xu et al. [24] analysed the energy consumption change in China's cement industry using the LMDI technique. The analysis was focused on the clinker manufacturing process in which the following factors were analysed: cement output, clinker share, process structure, and specific energy consumption per kiln type. The results pointed to the growth of cement output as the dominant factor that led to increased energy consumption, while the clinker share declined and the structural shift decreased the energy consumtion.
Similar to the decomposition literature, studies that used neural network techniques were also reviewed to understand their role in the energy field. To forecast the energy consumed over 24 hours in the building of the Regulation Authority of Energy (RAE) in Athens, Greece, Katsatos et al. [25] developed a forecasting model using ANN. Among the inputs was meteorological data (air temperature, relative humidity, wind speed, and barometric pressure), and ANN gave a remarkable prediction result. In an Italian case study in which energy and environmental performance of a building was to be assessed, Amico et al. [7] proposed the application of ANN. The study was simulated in various weather conditions, with 13 inputs for the energy analysis. ANN was applied successfully. In an attempt to forecast the electricity consumed in different areas (science and technology, a humanities college, and old liberal arts) on a university campus in Japan, Yuan et al. [26] proposed and applied ANN. Among the inputs that were combined were meteorological data and previously consumed electricity. The old liberal arts area had the least root mean square error, followed by the humanities college and science and technology.
For the purpose of developing a model to predict the HVAC-related energy saving in 56 office buildings in Singapore, Deb, Lee and Santamouris [27] used ANN and compared it with a multiple linear regression application. ANN produced a more accurate result, as evidenced by the 14.5 per cent mean absolute percentage error. To model the energy consumed in a residential building, Rafe Biswas, Robinson and Fumo [28] addressed the nonlinearity in the energy situations of residential buildings by applying ANN to one of the houses in the study. The results were impressive, as indicated by the outcomes of the coefficients of determination, which were within the range of 0.87 and 0.91. The electricity consumed in a suburban area in Palermo was assessed to see whether it correlated with demand, using ANN for short-term forecasting. The study was done over a period of 79 weeks, using both climatic conditions and electricity intensity as inputs. The result showed 1.5 per cent for the mean error and 4.6 per cent for the maximum error [29]. To address Greece's long-term energy consumption, a prediction was carried out using ANN, and the results were compared with the resulting outputs of a linear regression and a support vector machine, as well as the actual energy consumption [30]. ANN gave accurate results.
Concerning DEA energy-related studies, some reviews were analysed. With environmental problems caused by industrial activity, Wu et al. [31] applied DEA to handle 38 sectors in China, with non-homogeneous inputs and outputs being considered in the study. Among the sectors, the recycling and disposal of waste department achieved the best energy-saving and emission-reduction efficiency. Another application of DEA to Chinese industry was the study of Zhou et al. [32], which examined the energy performance of Chinese industrial sectors from 2010 to 2014. The majority of the industries were revealed not to have performed well - most of them in the energy extraction sectors. To understand the roles played by efficiency, technology use, and factor substitution in energy productivity improvements, DEA was applied to 35 industries in China from 1998 to 2011 [33]. The study revealed gthat technical efficiency made a major contribution, whereas factor substitution played the smallest role. Efficiency's contribution, on the other hand, was obvious. The efficient industries in the study were telecommunications equipment and computer and other electronic equipment.
Because of energy scarcity in China, Tian and Lin [34] investigated the technology gap in energy use in 30 provinces from 2005 to 2014, using DEA. The study concluded that the eastern region of China had the most advanced technology. Energy-conservation technology was being threatened in the western and central regions by low labour costs, contributing to a huge growth in the number of SMEs. The SMEs' lack of finance made the situation worse. Pérez, González-Araya and Iriarte [35], using DEA, analysed Chilean manufacturing industries for both energy efficiency and greenhouse gas emissions by considering the region and sector. The regions of Coquimbo, La Araucania, and Aysen were found to be the most efficient, while thed regions of Tarapaca, Antofagasta, and Bobio had industries with less efficiency. The efficient sectors included communications equipment, base metals, and clothing, while the least efficient were food and beverages, textiles, and non-metallic minerals. Mediterranean countries were examined to see how energy-efficient they were from 2009 to 2012, using DEA [36]. The results indicated a high energy efficiency in the Mediterranean, with a decline over time. The factors impacting energy efficiency were the gross national income per capita, population density, and renewable energy use.
Integrated models have proved helpful in upgrading the performance of single models. In the area of energy studies, few of these hybrid models have been cited in thed literature. In the study of Lin and Xu [37] to assess qualitatively the factors affecting China's metallurgical industry from 2000 to 2016, a comprehensive framework combining LMDI and productive decomposition analysis (PDA) was conducted. The study concluded that energy intensity declined rapidly during the period of study, with technological progress contributing the most to that decrease. On the other hand, the contributions of both the energy-structure effect and capital-energy substitution were very minimal. The labour-energy effect was the major factor hindering the reduction of the industry's energy intensity. To predict accurately the energy consumed in a residential setting for the purpose of ensuring a stable supply of power, Kim and Cho [38] employed a convolutional neural network (CNN) combined with long short-term memory (LSTM) to achieve the objective. The CNN-LSTM achieved an almost perfect prediction of the electricity use that had initially proved difficult to predict.
Using the LMDI method-based long-term energy alternatives planning (LEAP) model, Wang et al. [39] were able to analyse the energy consumed in the Hunan Province of China. The study was able to divide the energy consumed by three industries between 2006 and 2015 according to scale, structure, and efficiency effect through LMDI, and later predict energy use for the period from 2016 to 2040 using LEAP. The energy saving and management of complex chemical processes was successfully modelled using index decomposition analysis integrated with the energy-saving potential method [40]. The study showed the influence of activity on energy consumed, energy hierarchy and intensity, and energy hierarchy on energy-saving technology. An improved artificial neural network approach, integrated with DEA, was applied to petrochemical industries for energy optimisation and prediction [41]. The results led to a reduction in the energy consumption of an ethylene production system.
Similar to the technique proposed for this study, IDA-ANN-DEA has been applied in various studies. IDA-ANN-DEA was applied to South African industry to assess its energy potential [42]. The study concentrated on 11 energy-intensive industrial sectors from 1971 to 2008, and concluded that 49.9 per cent of energy could be saved when compared with the practice in 1975-1976. In a Canadian application, 15 industries were tested from 1990 to 2000 using the IDA-ANN-DEA approach, and it was observed that 0.47 per cent of energy could be saved if the practice in 1993 and 1994 were observed [43]. The dynamic relationship between Chinese energy consumption and economic growth was successfully analysed empirically, using cointegration analysis and a state-space model [44].
Sustainable buildings provide ways of significantly mitigating the impact on the environment [45]. Thus the rate at which energy increases in the construction of buildings and infrastructure necessitates an improvement in the building and construction industry's energy efficiency [4]. The aim of the current study was to assess the energy efficiency potential of this industry. The integrated approach was based on a top-down approach that identified the factors responsible for energy consumption, predicted the energy consumption, and later estimated the potential that could be obtained in a particular period. The proposed methodology was designed to assess the energy potential of the industry, and to develop an integrated system that could successfully determine its energy saving.
3 DATA AND METHODOLOGY
3.1 Data
For the purpose of this study, data for the building and construction industry and for the civil engineering and other construction industry in South Africa from 1994 to 2016 was collected. The data used (Figure 1 and Figure 2) was from Quantec, a private company in South Africa. The production values were all given by the gross domestic product (GDP) output, expressed in millions of Rands at current prices.
3.2 Methodology
3.2.1 Index decomposition analysis-LMDI
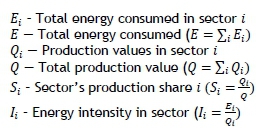
The consumption of energy in any period is best explained by the changes in activity, structural impact, and energy intensity. These changes in energy consumption from the starting period (0) to the end period (T) are decomposed to activity (the Q-term, which captures the contribution of the various productions to the overall GDP), energy intensity (the I-term, which refers to changes in energy efficiency), and the structural impact (the S-term, which describes the shifts in the mix of products or activities).
All of the corresponding terms capture the change in energy consumed in the periods that were analysed. The variables used for the decomposition analysis are:
Total energy use is addressed in the equation below - the sum of the product of total production value, sector's production share, and energy intensity.

An assumption of aggregate C is composed of n factors (x1,...,xn), i.e. C = Σi Ciand Ci = x1,i x2,i ...xn,i, with the additional assumption that from period 0 to T the aggregate changes from C° to CT. The IDA's objective is to understand the contributions of the n factors that led to the change in the aggregated energy consumption with the multiplicative and general LMDI expressions below. For further guidance on the mathematical expressions, refer to [15,46].
Multiplicative form

Similar to equations 1 and 2, the ratio change in energy consumption from period 0 to period T is equivalent to the product of activity, structure and intensity in equation 3 below

Where act represents activity, sir refers to structure, and int implies intensity.
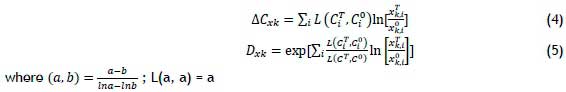
General formulae of LMDI
In the logarithmic mean Divisia index approach, the general formulae for the effect of the kth factor on the right-hand side of equations 2 and 3 are given in equations 4 and 5
LMDI (Multiplicative)
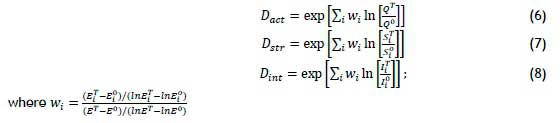
For simplicity, for each of the factors in activity, structural impact and energy intensity, the equations are given below:
Artificial neural network
The neural network's objective function is the mean square error (MSE) between the neural network's output (energy consumption from IDA) and the predicted energy consumption values. As the decomposed factors are fed to the network, the output generated from the network is compared with the actual output. The error between the actual output and the network's output is computed. The average sum of the errors must be minimised to achieve the goal of the ANN. The equation governing the MSE is given below:

where Q represents the total number of units, from the k = 1 to Q, and t(k) the actual output and a(k) the predicted output. The least MSE algorithm adjusts the weights and biases of the linear network. The proposed ANN for this study is the multilayer perceptron (MLP) with backpropagation algorithm training. The network's architecture comprises the input, hidden, and output layers. The network can be described through the computational procedure below [47] (Hsu and Chen, 2003):

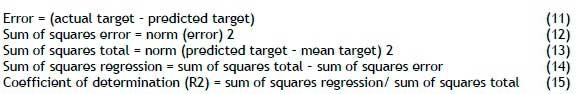
where Yjrepresents the output of node j, is the transfer function, Wijrefers to the connection weight between nodes j and i at the lower layer, whereas Xiis the input signal from node i in the lower layer. The backpropagation is based on a gradient descent algorithm, which improves the neural network's performance through total error reduction by the changes of weights along its gradient. Inputs for the neural network are from the decomposition results. The number of hidden neurons chosen was determined after a performance comparison of various cross-validated networks, from 1 to 10 hidden neurons, and the one with the best performance was picked. This was a network of the three factors (activity, structural impact, and energy intensity) as inputs, eight hidden neurons, and the energy consumption (output) - i.e., a 3-8-1 network. The network parameters included a learning rate of 0.06, a momentum of 0.7, a variable learning rate with momentum (trainlm) as the network's training function, and the activation functions of tansig and purelin. Because there were 22 data points, the data was divided into 50 per cent training, 27 per cent testing, and 23 per cent validation, to allow for a proportionate distribution for analysis. To validate the ANN, the coefficient of correlation (R) and the coefficient of determination (R2) were used. The equations governing R and R2 are given below:
3.2.2 Data envelopment analysis
The DEAFrontier package in Microsoft Excel® was used to perform this analysis. The input-oriented Charnes-Cooper-Rhodes (CCR) was the DEA model considered for this study. The variable returns to scale (VRS) was selected, as the increase in the input did not correspond with a proportional increase in the output. The input-oriented model minimises inputs while the least-given output is satisfied [48]. The efficiency scores obtained from the input-oriented model for the inefficient years (DMU) interpreted the possible amount of energy saving when compared with the efficient DMUs. The mathematical form is given below [49]:
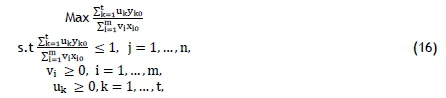
where yk0, k = 1, ...,t denotes outputs and xi0, i = 1, ...,m signifies inputs for all j = 1, ...,n, DMUs and j = 0 pinpoint the DMUj, which needs assessment. ukrepresents output weight, and the input weight is represented by vi. With the DEA equation above (equation 16) being a linear fractional programming problem, this is transformed into an ordinary linear programming problem, with new defined variables nk = ß uk, vi = ßviand obtaining the following ordinary linear programming problem with the same optimum value of the DEA equation as above [49]:
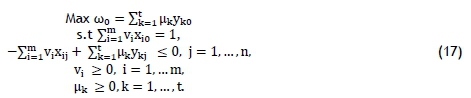
This problem is dual in nature, and takes an 'envelopment model' form, which is easily expressed below as:
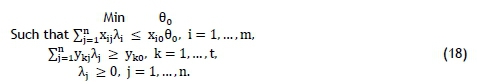
This problem can be solved if 00, λj= 1 for the DMUj = DMU0is chosen to be evaluated and every other λj= 0. Additionally, there is a bounded solution below by max yk0,k = 1, ...,t, and the λj> 0 constraints. The optimal value of 00becomes finite so that, through the dual theorem of linear programming, equation (17) gives a finite solution with w*0= 0*0, where "*" specifies the optimal value [49].
3.2.3 Theoretical framework - the guide to the proposed model
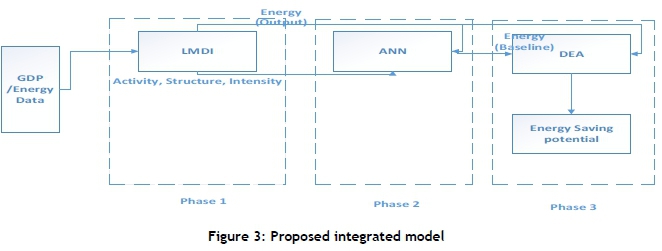
The ability to assess the potential of energy saving guided the theory behind the integrated model. The various energy models have different capabilities. The notable capabilities that are needed for energy analysis include understanding the factors responsible for the energy consumed, the ability to predict energy use, and comparing various units with homogeneous resources to analyse the efficient use of energy. These capabilities are demonstrated by IDA, ANN, and DEA. Integrating these models (Figure 3) offsets the bias of each model, turning it into an improved model for energy analysis. The background of this model can be found in [42] in its early application. The application of this model includes decomposing the energy consumed in the industry case study into the activity, structural impact, and energy intensity factors. These become inputs for predicting the energy consumption, which in turn serves as the baseline to optimise energy use and to determine the potential savings.
The steps to achieve the objective of this study are given below.
1. Phase I - IDA through multiplicative LMDI disaggregates the econometric data (GDP and energy data) into the contributing factors that lead to energy consumed in the building and construction industry. These factors are activity, structural impact, and energy intensity.
2. Phase 2 - The contributing factors serve as inputs to ANN to predict energy consumption. The prediction is verified and validated to obtain the preferred neural network structure for the energy baseline to be integrated into the other models.
3. Phase 3 - The final step involves DEA. The predicted energy consumption is the baseline that serves as output to the DEA, while the actual energy consumption from the LMDI serves as the input to allow the determination of the potential savings in the industry.
3.2.4 Proposed integrated model
The mathematical expression behind the integrated model is as follows. The activity, structural impact, and energy intensity results obtained from the decomposition result serve as inputs to equation 10 in the neural network, and Ctotserves as the output. These inputs and outputs were used as vectors in MATLAB (Matrix Laboratory). This becomes:

The goal is to minimise the average sum of the errors between the decomposed energy consumption (output to the neural network) and the target energy consumption (predicted energy consumption). Thus MSE = 1/Q (ΣQK=iCtott(k)- Ctota(k)}2
where Ctott is the predicted total energy consumption and Ctota is the decomposed total energy consumption. Substituting Ctott as the output variable and Ctota as the input variable in equation 16 gives:
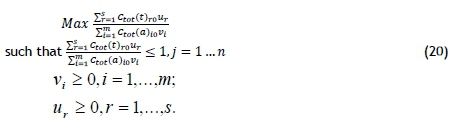
where Ctot(t)ror = 1,...s represents the outputs and Ctot(a)ioi = 1,...m, represents the inputs for each of j - 1,..n, DMUs and j=0 identify DMUj to be evaluated. μr is the output weight, while Vi is the input weight. Once they are transformed into an ordinary linear programming problem, nr = ß μr, vi = ß vi is obtained with the same optimum value as equation (20).
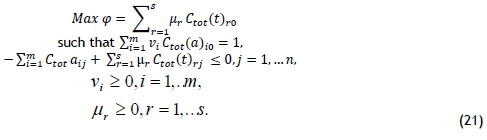
Equation (21) accounts for the possible energy saving consumed, while the expected energy to be consumed is kept at the baseline level.
4 RESULTS AND DISCUSSION
4.1 LMDI
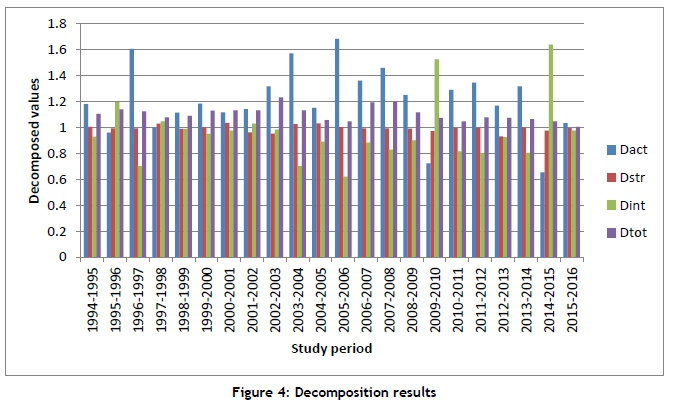
The decomposition result shown in Figure 4 expresses the changes in the energy consumption of the industries being studied. Of the factors, the activity effect contributed the most. Except for the years 199596, 1997-98, 2000-01, 2009-10, and 2014-15, the years were dominated by the activity effects. Energy intensity contributed most to the energy consumption on only two occasions, 2009-10 and 2014-15, whereas the structural impact effect played a secondary role. Most of the time, the activity effect was the key contributor to the energy consumed. Around 407 per cent of the industries' activity contributed the most to the changes experienced in energy consumption throughout the study period, followed by structural impact (11%) and energy intensity (3%). All of the factors contributed the most to the energy changes in 2007-08 and the least in 2015-16. Although the energy change reduced by 8.91 per cent in 1994-95 , the changes were erratic throughout the study period.
4.2 ANN
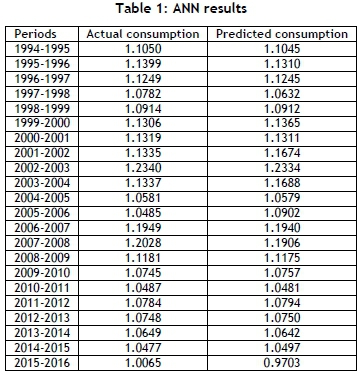
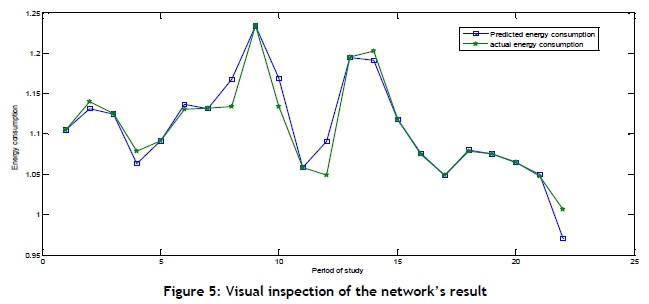
Table 1 presents the results following the network's application. The network was validated using visual inspection (Figure 5) and statistical measures of performance in the form of a coefficient of correlation. Figure 5 clearly shows the similarity between the predicted and the actual energy consumption, with minimal space (errors) between them. With the coefficient of correlation close to 1, the network's performance proved effective. The coefficient for training was 1, testing was 0.96352, validation was 0.82976, and the overall coefficient of correlation was 0.96098, while the coefficient of determination (R2) was 0.9234.
4.3 DEA
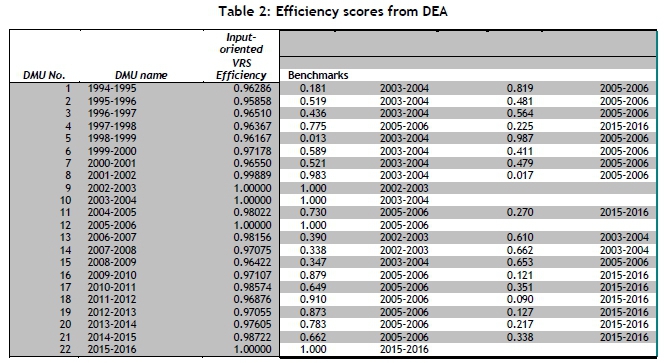
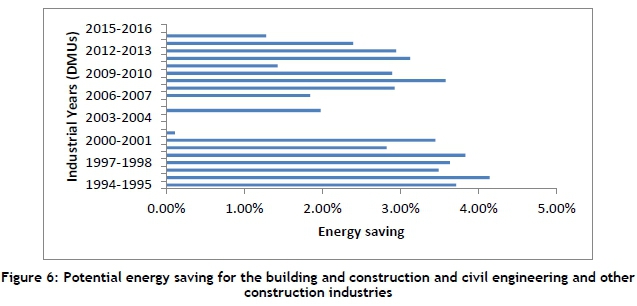
The actual energy consumption was the input and the predicted energy consumption was the output. The efficiency scores in the various years (DMUs) are presented in Table 2. Of the 22 DmUs, four industrial years - 2002-03, 2003-04, 2005-06, and 2015-16 - were efficient, and also served as benchmarks for the inefficient years, which would help to determine the potential saving. The efficient scores served as coefficients, indicating the potential saving. For example, the year 2013-14 was inefficient, and could have saved about 2.4 per cent (100% - 97.605%) energy when compared with the best practices of 2005-06 and 2015-16. However, based on the ratio of the importance of each of the benchmarks, the year 2005-06 would be responsible for the major share (1.87%) of the energy saving, and the year 2015-16 for 0.6 per cent energy saving. If all the inefficient years were to reduce their consumption on the basis of the benchmark efficient years, the average energy to be saved throughout the 22 years would be 2.25 per cent (Figure 6). Figure 6 relates the consumption to the percentage amount of energy that would have been saved if all of the periods had emulated the four efficient years. The energy saving potential has a sinusoidal waveform, if we look at the points of the saving in Figure 6.
5 CONCLUSION
The building and construction and civil engineering and other construction industries represent a step towards economic growth, given the infrastructure that arises from these industries. Achieving the industries' objectives requires energy use. Owing to the nature of the industries' use of energy, emissions occur in large volumes. To manage the energy use in the form of conservation while achieving their objective, this study proposed an integrated model to overcome energy-related emissions, leading to improvements in the use of energy in the building and construction and civil engineering and other construction industries.
The proposed approach is an integrated IDA-ANN-DEA to decompose energy into the factors responsible for its consumption. The total amount of energy was predicted in order to determine the baseline for defining the amount of energy to be saved. In its decomposition, the activity effect made the highest contribution to the energy consumed. All of the activities in these industries need to be scrutinised to see where there could be improvements, which in turn would lead to policy improvements or to the development of new policies where needed. In the period that was studied, the years 2002-03, 2003-04, 2005-06, and 2015-16 were the ones that the inefficient years could emulate to become efficient. An average of 2.5 per cent of the energy consumed could be saved each year throughout the 22-year period.
The essence of this study has been to alert policymakers and stakeholders in the building and construction and civil engineering and other construction industries to the need to have proper energy management, and to the important issue of energy reduction while achieving the industries' objectives. The reduction of industrial energy consumption is a useful procedure to reduce emission. The outcomes of this study can help policymakers to devise systems for energy management. It is recommended that future studies look at considering greenhouse gas mitigation and energy-saving possibilities, using the integrated model, for a possible robust result.
REFERENCES
[1] Guo, S., Zheng, S., Hu, Y., Hong, J., Wu, X. & Tang, M. 2019. Embodied energy use in the global construction industry. Applied Energy, 256(August), p. 113838. doi: 10.1016/j.apenergy.2019.113838 [ Links ]
[2] Hossain, M.U. & Poon, C.S. 2018. Global warming potential and energy consumption of temporary works in building construction: A case study in Hong Kong. Building and Environment, 142(June), pp. 171-179. doi: 10.1016/j.buildenv.2018.06.026 [ Links ]
[3] Tesema, G. & Worrell, E. 2015. Energy efficiency improvement potentials for the cement industry in Ethiopia. Energy, 93, pp. 2042-2052. doi: 10.1016/j.energy.2015.10.057 [ Links ]
[4] Lin, B. & Liu, H. 2015. CO2 mitigation potential in China's building construction industry: A comparison of energy performance. Building and Environment, 94(P1), pp. 239-251. doi: 10.1016/j.buildenv.2015.08.013 [ Links ]
[5] Swanepoel, J.A., Mathews, E.H., Vosloo, J. & Liebenberg, L. 2014. Integrated energy optimisation for the cement industry: A case study perspective. Energy Conversion and Management, 78, pp. 765-775. doi: 10.1016/j.enconman.2013.11.033 [ Links ]
[6] Lu, Y., Cui, P. & Li, D. 2018. Which activities contribute most to building energy consumption in China? A hybrid LMDI decomposition analysis from year 2007 to 2015. Energy and Buildings, 165, pp. 259-269. doi: 10.1016/j.enbuild.2017.12.046 [ Links ]
[7] D'Amico, A., Ciulla, G., Traverso, M., Lo Brano, V. & Palumbo, E. 2019. Artificial neural networks to assess energy and environmental performance of buildings: An Italian case study. Journal of Cleaner Production, 239, p. 117993. doi: 10.1016/j.jclepro.2019.117993 [ Links ]
[8] Najjar, M., Figueiredo, K., Hammad, A.W.A. & Haddad, A. 2019. Integrated optimization with building information modeling and life cycle assessment for generating energy efficient buildings. Applied Energy, 250(May), pp. 1366-1382. doi: 10.1016/j.apenergy.2019.05.101 [ Links ]
[9] Belussi, L., Barozzi, B., Bellazzi, A., Danza, L., Devitofrancesco, A., Fanciulli, C., Ghellere, M., Guazzi, G., Meroni, I., Salamone, F., Scamoni, F. & Scrosati, C. 2019. A review of performance of zero energy buildings and energy efficiency solutions. Journal of Building Engineering, 25(December 2018), p. 100772. doi: 10.1016/j.jobe.2019.100772 [ Links ]
[10] Lu, Y., Cui, P. & Li, D. 2016. Carbon emissions and policies in China's building and construction industry: Evidence from 1994 to 2012. Building and Environment, 95, pp. 94-103. doi: 10.1016/j.buildenv.2015.09.011 [ Links ]
[11] Kermeli, K., Edelenbosch, O.Y., Crijns-Graus, W., Van Ruijven, B.J., Mima, S., Van Vuuren, D.P. & Worrell, E. 2019. The scope for better industry representation in long-term energy models: Modeling the cement industry. Applied Energy, 240(March 2018), pp. 964-985. doi: 10.1016/j.apenergy.2019.01.252 [ Links ]
[12] Seferlis, P., Varbanov, P.S. & Klemes, J.J. 2015. Applied thermal engineering solutions through process integration, modelling and optimisation. Applied Thermal Engineering, 89, pp. 1001 -1005. [ Links ]
[13] Albrecht, J., François, D. & Schoors, K. 2002. A Shapley decomposition of carbon emissions without residuals. Energy Policy, 30(9), pp. 727-736. doi: 10.1016/S0301-4215(01)00131-8 [ Links ]
[14] 14. Ang, B.W. 2004. Decomposition analysis for policymaking in energy: Which is the preferred method? Energy Policy, 32(9), pp. 1131-1139. doi: 10.1016/S0301-4215(03)00076-4 [ Links ]
[15] Ang, B.W. 2005. The LMDI approach to decomposition analysis: A practical guide. Energy Policy, 33(7), pp. 867-871. doi: 10.1016/j.enpol.2003.10.010 [ Links ]
[16] Mairet, N. & Decellas, F. 2009. Determinants of energy demand in the French service sector: A decomposition analysis. Energy Policy, 37(7), pp. 2734-2744. doi: 10.1016/j.enpol.2009.03.002 [ Links ]
[17] Olanrewaju, O.A., Jimoh, A.A. & Kholopane, P.A. 2012a. Comparing performance of MLP and RBF neural network models for predicting South Africa's energy consumption. Journal of Energy in Southern Africa, 23(3), pp. 40-46. [ Links ]
[18] Olanrewaju, O.A. 2013. Analysis and assessment of industrial sectors for energy efficiency potentials. DTech thesis. Tshwane University of Technology. [ Links ]
[19] Bianco, V. 2019. Analysis of electricity consumption in the tourism sector: A decomposition approach. Journal of Cleaner Production, 248, p. 119286. doi: 10.1016/J.JCLEPRO.2019.119286 [ Links ]
[20] Kim, S. 2017. LMDI decomposition analysis of energy consumption in the Korean manufacturing sector. Sustainability, 9(2), p. 202. doi: 10.3390/su9020202 [ Links ]
[21] Achour, H. & Belloumi, M. 2016. Decomposing the influencing factors of energy consumption in Tunisian transportation sector using the LMDI method. Transport Policy, 52, pp. 64-71. doi: 10.1016/j.tranpol.2016.07.008 [ Links ]
[22] Dai, Y. & Gao, H.O. 2016. Energy consumption in China's logistics industry: A decomposition analysis using the LMDI approach. Transportation Research Part D: Transport and Environment, 46, pp. 69-80. doi: 10.1016/j.trd.2016.03.003 [ Links ]
[23] Wu, H.-M. & Xu, W. 2014. Cargo transport energy consumption factors analysis: Based on LMDI decomposition technique. IERI Procedia, 9(2012), pp. 168-175. doi: 10.1016/j.ieri.2014.09.058 [ Links ]
[24] Xu, J.-H., Fleiter, T., Eichhammer, W. & Fan, Y. 2012. Energy consumption and CO2 emissions in China's cement industry: A perspective from LMDI decomposition analysis. Energy Policy, 50, pp. 821 -832. doi: 10.1016/j.enpol.2012.08.038 [ Links ]
[25] Katsatos, A.L. & Moustris, K.P. 2019. Application of artificial neuron networks energy consumption forecasting tool in the building of Regulatory Authority of Energy, Athens, Greece. Energy Procedia, 157(2018), pp. 851-861. doi: 10.1016/j.egypro.2018.11.251 [ Links ]
[26] Yuan, J., Farnham, C., Azuma, C. & Emura, K. 2018. Predictive artificial neural network models to forecast the seasonal hourly electricity consumption for a university campus. Sustainable Cities and Society, 42(January), pp. 82-92. doi: 10.1016/j.scs.2018.06.019 [ Links ]
[27] Deb, C., Lee, S.E. & Santamouris, M. 2018. Using artificial neural networks to assess HVAC related energy saving in retrofitted office buildings. Solar Energy, 163(January), pp. 32-44. doi: 10.1016/j.solener.2018.01.075 [ Links ]
[28] Rafe Biswas, M.A., Robinson, M.D. & Fumo, N. 2016. Prediction of residential building energy consumption: A neural network approach. Energy, 117, pp. 84-92. [ Links ]
[29] Marvuglia, A. & Messineo, A. 2012. Using recurrent artificial neural networks to forecast household electricity consumption. Energy Procedia, 14, pp. 45-55. [ Links ]
[30] Ekonomou, L. 2010. Greek long-term energy consumption prediction using artificial neural networks. Energy, 35(2), pp. 512-517. doi: 10.1016/j.energy.2009.10.018 [ Links ]
[31] Wu, J., Li, M., Zhu, Q., Zhou, Z. & Liang, L. 2019. Energy and environmental efficiency measurement of China's industrial sectors: A DEA model with non-homogeneous inputs and outputs. Energy Economics, 78, pp. 468-480. doi: 10.1016/j.eneco.2018.11.036 [ Links ]
[32] Zhou, Z., Xu, G., Wang, C. & Wu, J. 2019. Modeling undesirable output with a DEA approach based on an exponential transformation: An application to measure the energy efficiency of Chinese industry. Journal of Cleaner Production, 236, p. 117717. doi: 10.1016/j.jclepro.2019.117717 [ Links ]
[33] Wang, R. 2018. Energy efficiency in China's industry sectors: A non-parametric production frontier approach analysis. Journal of Cleaner Production, 200, pp. 880-889. doi: 10.1016/j.jclepro.2018.07.277 [ Links ]
[34] Tian, P. & Lin, B. 2018. Regional technology gap in energy utilization in China's light industry sector: Non-parametric meta-frontier and sequential DEA methods. Journal of Cleaner Production, 178, pp. 880-889. doi: 10.1016/j.jclepro.2018.01.017 [ Links ]
[35] Pérez, K., González-Araya, M.C. & Iriarte, A. 2017. Energy and GHG emission efficiency in the Chilean manufacturing industry: Sectoral and regional analysis by DEA and Malmquist indexes. Energy Economics, 66, pp. 290-302. doi: 10.1016/j.eneco.2017.05.022 [ Links ]
[36] Khraief, N. & Jebali, E. 2017. The analysis of energy efficiency of the Mediterranean countries: A two-stage double bootstrap DEA approach. Energy, 134, pp. 991-1000. doi: 10.1016/j.energy.2017.06.063 [ Links ]
[37] Lin, B. & Xu, M. 2019. Quantitative assessment of factors affecting energy intensity from sector, region and time perspectives using decomposition method: A case of China's metallurgical industry. Energy, 189(C), p. 116280. doi: 10.1016/j.energy.2019.116280 [ Links ]
[38] Kim, T. & Cho, S. 2019. Predicting residential energy consumption using CNN-LSTM neural networks. Energy, 182, pp. 72-81. doi: 10.1016/j.energy.2019.05.230 [ Links ]
[39] Wang, P., Wang, C., Hu, Y. & Liu, Z. 2017. Analysis of energy consumption in Hunan Province (China) using a LMDI method based LEAP model. Energy Procedia, 142, pp. 3160-3169. doi: 10.1016/j.egypro.2017.12.384 [ Links ]
[40] Geng, Z., Gao, H., Wang, Y., Han, Y. & Zhu, Q. 2017. Energy saving analysis and management modeling based on index decomposition analysis integrated energy saving potential method: Application to complex chemical processes. Energy Conversion and Management, 145, pp. 41-52. doi: 10.1016/j.enconman.2017.04.087 [ Links ]
[41] Han, Y., Geng, Z. & Zhu, Q. 2016. Energy optimization and prediction of complex petrochemical industries using an improved artificial neural network approach integrating data envelopment analysis. Energy Conversion and Management, 124, pp. 73-83. doi: 10.1016/j.enconman.2016.07.002 [ Links ]
[42] Olanrewaju, O.A., Jimoh, A.A. & Kholopane, P.A. 2013. Assessing the energy potential in the South African industry: A combined IDA-ANN-DEA (index decomposition analysis-artificial neural network-data envelopment analysis) model. Energy, 63, pp. 225-232. doi: 10.1016/j.energy.2013.10.038 [ Links ]
[43] Olanrewaju, O.A., Jimoh, A.A. & Kholopane, P.A. 2012b. Integrated IDA-ANN-DEA for assessment and optimization of energy consumption in industrial sectors. Energy, 46(1), pp. 629-635. doi: 10.1016/j.energy.2012.07.037 [ Links ]
[44] Ma, Y., Wang, B. & Xue, L. 2011. An empirical analysis for the dynamic relationship between China's energy consumption and economic growth-based on cointegration analysis and state-space model. Energy Procedia, 5, pp. 2252-2256. doi: 10.1016/j.egypro.2011.03.389 [ Links ]
[45] Ding, G. & Ying, X. 2019. Embodied and operating energy assessment of existing buildings: Demolish or rebuild. Energy, 182, pp. 623-631. doi: 10.1016/j.energy.2019.06.056 [ Links ]
[46] Ang, B.W. 2005. The LMDI approach to decomposition analysis: a practical guide. Energy Policy,33 (7), pp 867-871 [ Links ]
[47] Hsu, C.-C. & Chen, C.-Y. 2003. Regional load forecasting in Taiwan: Applications of artificial neural networks. Energy Conversion and Management, 44, pp. 1941 -1949 [ Links ]
[48] Liu, C.H., Lin, S.J. & Lewis, C. 2010. Evaluation of thermal power plant operational performance in Taiwan by data envelopment analysis. Energy Policy, 38, pp. 1049-1058. [ Links ]
[49] William, W.C., Jose, L.R. & Sirvent, I. 2007. Choosing weights from alternative optimal solutions of dual multiplier models in DEA. European Journal of Operational Research, 180, pp. 443-458. [ Links ]
Submitted by authors 17 Feb 2020
Accepted for publication 21 Jul 2021
Available online 31 Aug 2021
* Corresponding author: oludolapoo@dut.ac.za

