


Services on Demand
Article
 English (pdf)
 Article in xml format
 Article references
Indicators

Related links
-
 Cited by Google
 -
 Similars in Google
Share

 Permalink
South African Journal of Industrial Engineering
On-line version ISSN 2224-7890
Print version ISSN 1012-277X
S. Afr. J. Ind. Eng. vol.32 n.2 Pretoria Aug. 2021
http://dx.doi.org/10.7166/32-2-2415
GENERAL ARTICLES
Use of partial quality function deployment to identify processes required for ISO 9001
O. Cruz-DomínguezI,*; O.A. Guirette-BarbosaI; J.L. Carrera-EscobedoI; H.A. Duran-MuñozII; C.H. Guzman-ValdiviaIII; E.A. Ruelas-SantoyoIV
IDepartment of Industrial Engineering, Zacatecas Polytechnic University, Mexico. O. Cruz-Domínguez: https://orcid.org/0000-0003-1320-4371; O.A. Guirette-Barbosa: https://orcid.org/0000-0003-1336-9475; J.L. Carrera-Escobedo: https://orcid.org/0000-0003-1761-8096
IIDepartment of Electrical Engineering, Zacatecas Autonomous University, Mexico. H.A. Duran-Muñoz: http://orcid.org/0000-0002-7190-3528
IIIEngineering Science Centre, Aguascalientes Autonomous University, Mexico. C.H. Guzman-Valdivia: https://orcid.org/0000-0003-0638-1417
IVDepartment of Industrial Engineering, Technological Institute of Irapuato, Mexico. E.A. Ruelas-Santoyo: https://orcid.org/0000-0003-0515-7667
ABSTRACT
This paper proposes an objective way to identify the necessary processes of a quality management system (QMS) to enhance customer satisfaction by meeting customer requirements (CRs). This quality function deployment (QFD)-based method helps to address the implementation of process management, which is a mandatory requirement of modern standards based on QMS, such as ISO 9001 and other international standards. Currently, this identification of processes is made through subjective judgements derived from observation, brainstorming, debates, group projects, and other techniques; but this research presents a standardised way of determining or identifying the processes. The proposed method achieves the identification only of the processes that influence customer satisfaction, consolidating it as a crucial tool in the robust QMS design. The results indicate that the method shown can serve as a platform for subsequent activities, such as process mapping, indicator creation, procedure writing, and other important documents. The purpose of this paper is to show the feasibility of the proposed method, finishing with a summary of the results achieved in a Mexican company's QMS identification of processes.
OPSOMMING
Hierdie artikel stel 'n objektiewe manier voor om die noodsaaklike prosesse vir 'n gehalte bestuurstelsel te identifiseer om kliëntbevrediging te verbeter deur kliënte se behoeftes te bevredig. Die gehalte funksie ontplooiing gebaseerde metode dra by tot die implementering van prosesbestuur - dit is 'n verpligte vereiste van moderne standaarde wat op gehalte bestuurstelsels gebaseer is, soos ISO 9001 en andere. Op die oomblik word hierdie identifikasie van prosesse gemaak deur subjektiewe beoordelings wat afgelei word van observasies, dinkskrums, debatvoering, groep projekte en ander tegnieke. Hierdie navorsing bied egter 'n gestandaardiseerde manier vir die identifisering of bepaal van die prosesse. Die voorgestelde metode is beperk tot die identifisering van prosesse wat kliëntbevrediging beïnvloed en die resultaat is ' belangrike toevoeging tot 'n robuuste gehalte bestuurstelsel. Die resultate toon dat die metode gebruik kan word as 'n platform vir daaropvolgende aktiwiteite, soos die kartering van prosesse, skep van aanwysers, skryf van prosedures en ander belangrike dokumente. Die doel van hierdie artikel is om die lewensvatbaarheid van die voorgestelde metode aan te bied en dit sluit af met ' opsomming van die resultate behaal deur ' Meksikaanse maatskappy se gehalte bestuurstelsel proses identifisering
1 INTRODUCTION
A process is a set of interrelated or interacting activities that use inputs to deliver an intended result [1]. According to ISO 9001: 2015, process identification is an activity that has importance and relevance during the implementation of a quality management system (QMS). This process approach is a quality management principle that allows organisations to control the interrelationships and interdependencies between processes, improving the overall performance [2]. Personal interviews, observation, and other common practices have been used to determine the processes needed to achieve the organisation's intended outputs, but their implicit subjective value generates different compositions in companies with the same commercial activity. Some authors have approached this lack of homogeneity in the identification of processes from different perspectives. For example, in Popova et al. [22], development of a methodology for QMS's identification of processes is presented. Their research presents different approaches to processes classification and the results of studying the QMS process models of Russian companies. In Bacoup et al. [32], a comprehensive methodology that combines the benefits of both ISO standards and Lean Management is proposed. According to this research, their methodology leads manufacturing or service companies to certification without creating more documentation. The proposed methodology enables each firm to develop, first, the minimum amount of documentation needed in order to demonstrate effective planning, and second, set up and control its processes and their continuous improvement (design of the continuous improvement process) so that the QMS is as efficient as possible. Other authors have used very specific tools to reduce the documentation of a QMS; for example, Micklewright's approach reduces the documentation of a QMS through the use of the 5 'S' approach [33].
There is agreement between the research presented in this document and the research mentioned above in respect of achieving a more efficient QMS. However, the current research differs in that the efficiency of the QMS is achieved from the origin - that is, from the design of the system. Choosing the relevant processes saves resources, thus allowing a QMS to be implemented quickly and effectively, and with just the right level of documentation.
The rapidly changing consumer demand for better products and services, and the urgent need to achieve efficiency, have also contributed to companies' identification of processes/documentation. The old pyramidical structure used in organisations such as the army, the Church, and universities is no longer pertinent when talking about total quality in every operation and process [3]. Because of that, the identification of processes in companies must be done using an objective criterion, and only the processes with an impact on a company's functioning and performance must be characterised.
According to Mallar [4], the methodology for processes-based management consists of seven distinct stages:
1. Information, formation and participation.
2. Identifying processes and defining boundaries.
3. Selecting key processes.
4. Appointing the responsible for each process.
5. Reviewing processes and detecting the analysis/problem.
6. Correcting the problem.
7. Establishing indicators.
This research paper focuses on the second and third stages of that methodology, identifying the characteristics relevant to the product/service and the processes involved with a quality function deployment (QFD)-based mathematical algorithm. The first goal of this paper is to present a systematic method for determining which processes must be included in a QMS. The second goal is to show the use of this method in organisations that have implanted quality systems, and then to compare the processes that identify the procedure with the processes that the organisations have already identified and use.
The rest of the paper is organised as follows. The second section is the literature review. The third section is the methodology, which describes, among other things, the partial QFD process and its use in identifying the processes that should be part of a QMS. An actual case in a Mexican cinema is described to demonstrate the proposed approach in practice. The fourth section summarises the results of the proposed method when applied to a group of companies in the north-central region of Mexico. In section 5 the results obtained are discussed, and section 6 presents the conclusions.
2 LITERATURE REVIEW
According to ISO/TC 176/SC 2 [5], organisations have to define the number and type of processes needed to fulfil their business objectives. While these will be unique to each organisation, it is possible to identify typical processes, such as these:
• Organisational management
• Resource management
• Realisation
• Measurement, analysis, and improvement
However, the ISO 9001:2015 standard does not mention the method to identify the processes. Point 4.4.1 of this standard only states that companies must determine the necessary processes for the QMS and its application in the company. Many researchers and experts have addressed the definition of processes with the intention of facilitating their correct identification [6] [7] [8]. Others have used process management to establish the importance and validity of this management tool, or the need for it [9] [10] [11]. None of these investigations provides a process identification method to comply with the requirements of the ISO 9001 standard and some quality models, such as the EFQM excellence award.
Other references to process management worth mentioning are:
• Clause 4.4 of ISO 14001:2015 [12] and ISO 45001:2018 [13] standards specify that companies must establish, implement, keep, and constantly improve their management systems, including the necessary processes and interactions to achieve the foreseen results.
• Clause 8.1 of ISO 27001:2013 [14] states that companies must plan, implement, and control the necessary processes to meet the requirements of information security.
• One of the ISO 10006 clauses [15] contemplates the necessity of identifying and documenting the project's processes.
But the importance of the identification of processes goes well beyond the international standards. Some processes need to be identified because they are of strategic importance to an organisation's survival. Other processes might reveal striking problems that should be resolved for the sake of all the stakeholders involved. In other words, the processes that an organisation should focus on identifying are found in areas where either great value is created or significant trouble is present - or both.
All of these arguments show the necessity of a method for obtaining a robust and objective process architecture that generates a practical and optimised documentation system.
2.1 QFD as a method to identify customer requirements
QFD is a planning process to guide the design, manufacturing, and marketing of products that integrate the voice of the customer throughout the organisation. Through QFD, all design, manufacturing, and control decisions are made so that they fulfil the express needs of the customer. QFD uses a series of matrices to present data and information [17]. The first matrix, 'planning CRs', is shown in Figure 1, and provides the basis for the QFD concept. On the left side of this matrix, the most important customer needs must be entered. In the example shown in this research, customers care about the following qualities in a cinema: physical environment (hygiene, comfort, clean toilets), perceived value (the relationship between the price and the service received - for instance, image resolution, sound fidelity, 3D rooms, VIP rooms), and service quality (parking lot, service, security, ticket availability, special sales, payment methods) [35-39]. Once a set of CRs has been obtained, they should be prioritised from the customer's perspective (the right side of Figure 1) to determine the rating of their relative importance. The final importance ratings of CRs are generally determined by combining the relative importance ratings and the competitive priority ratings [40]. Most of the methods to determine the competitive priority ratings of CRs have assumed that the relationship between product (or service) quality criteria (i.e., CRs, and therefore the processes for achieving them) and customer satisfaction is one-dimensional or linear (the higher the perceived quality, the higher the customer's satisfaction, and vice versa [41]. The method proposed in this research is presented as a tool for manufacturing and service sectors alike to identify what customers are looking for in a product or service, and what processes would be required to fulfil these requirements. Using an adaptation of the Pareto principle, the proposal separates out the processes whose characteristics arre not necessary, identifying only the processes that are needed and discarding those that are not necessary for the QMS. There is evidence in the literature about the use of partial QFD; for example, the investigation of Pérez Soriano et al. [18] enables one to identify and arrange in order of importance the needs and problems gymnasts and coaches have with gymnastic mats. In a technical paper by Burge [42], a partial QFD is used to show the relationships between customer requirements and a particular functional requirement for an intelligent washing machine. Huovila et al. [43] implemented the QFD methodology in the construction of a flat, a restaurant, and an industrial building, and showed that, in spite of the extra work involved, even partial implementation could bring benefits (e.g., better designs, better communication with customers) to companies in the sector. Other research addresses the use of QFD to explore the level of customer satisfaction with the features offered in specific products [19,44]. The method proposed in this research shows the application of a partial QFD as a tool to analyse a process of prioritising, in the same way as has been done in previous investigations [20,45,46].

3 METHODOLOGY
3.1 Research design
A quantitative design was employed to identify customer/user expectations of a product or service in a group of companies in the north-central region of Mexico. In the first phase, a data collection instrument was designed and validated. To conduct the reliability and validity testing of the instrument, a Cronbach's coefficient alpha of a sample pilot of six certified companies was calculated. This sample size is similar to those used in other studies in which the face and content validity of instruments were tested [47,48]. In a second phase, the final sample of 29 companies was chosen, and the validated instrument was applied. The first phase of the research design is explained in section 3.2; the sampling method and final sample size are explained in 3.3; and an example in this research of the proposed method to identify the necessary processes of a QMS in a cinema is given in 3.4. Finally, the second phase is explained in the results section.
3.2 Reliability and validity testing of the data collection instrument
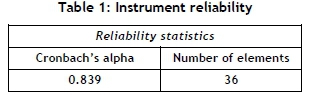
The data collection instrument was a questionnaire that was used to define the relevant variables to be considered in determining the internal processes when implementing a QMS (see Appendix A). It consists of five sections. The first section seeks to identify the main requirements of a product or service. The next three sections consist of 36 items that are measured with a five-point Likert-type scale (Tables 4 and 7 show the scores assigned to each level of the different scales). The last section seeks to identify the processes in the QMS of the companies that provided information for this research. The calculation, the capturing of the information, and the determination of the Cronbach's alpha coefficient were done using an Excel® 2016 worksheet. It was verified later with the data analysis using the SPSS program, version 24. To determine the reliability of the questionnaire, Cronbach's alpha was applied in a grouped manner, obtaining a value of 0.839 (see Table 1). With this coefficient, internal consistency is measured as an indicator of the correlation between the items that make up any scale measurement instrument. Values are acceptable when they are equal to or greater than 0.70 and less than or equal to 0.90 [49]. For the present study, the alpha value obtained was considered acceptable [21].
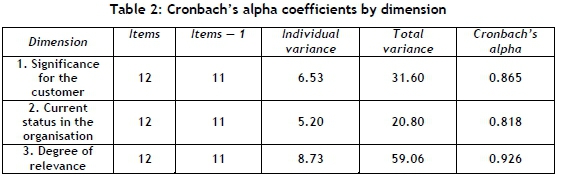


To avoid the risk of underestimating internal consistency, because scales are used with items that explore three different dimensions, a Cronbach's alpha value was calculated for each group of items that made up a dimension. These results were also acceptable, and are shown in Table 2.
3.3 Sampling method and sample size
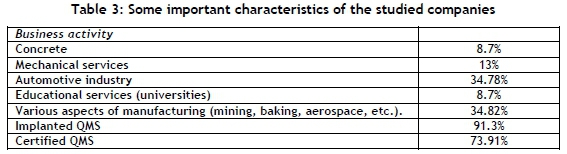
For sampling, a simple random sampling technique was employed. The researchers administered the validated instrument to the individuals in charge of QMS in a group of companies in Mexico. These firms were found and selected from a list provided by certifying agencies operating in that country. Also, some data for the study were also obtained from non-QMS-certified firms. Only 23 of the 29 selected companies (based on the sample size used in similar studies [22]) agreed to participate, on condition that the researchers used company information only for academic purposes. Their important characteristics are given in Table 3, which shows that different business activities and companies - with and without implanted or certified QMS - were chosen, in order to achieve the representativeness of the sample. Accordingly, the response rate of 79.31 per cent of the 29 distributed questionnaires achieved validity, and so the information of 23 questionnaires was used in this research's analysis.
3.4 Research instrument
The research data were collected by using the validated instrument (Appendix A). The data thus obtained were used to feed the QFD-based method and, through that, to identify the relevant characteristics of the product/service and the processes involved. This systematic method of determining which processes must be included in a QMS is presented below, taking as an example its use in a cinema.
3.4.1 Gather and evaluate functional requirements that customers look for in a product and/or service: the WHATs
In this stage, the functional requirements that indicate what customers expect from a product or service are identified. These requirements may be represented in a 'WHATs' list along the vertical axis of the matrix in Figure 1. It is recommended to do a product/service survey in order to obtain the greatest number of aspects that customers will expect from the product/service (see Appendix A, question 1). For example, in a cinema, customers will look for the following aspects (the WHATs):
• Image resolution
• Sound fidelity
• Cinema billboard
• Price
• Schedules
• Hygiene
• Comfort
• Service
• Parking lot
• Setup
• Special sales
• Payment methods
• Website
• Clean toilets
• Security
• Ticket availability
• 3D rooms
• VIP rooms
3.4.2 Analysis of WHATs
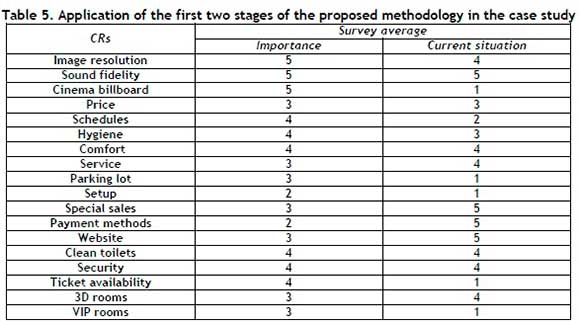
In the second stage, the WHATs should be classified according to their importance, translating the customer's perceptions into numerical scales. It is proposed to conduct a potential customer survey (see Appendix A, question 2) to classify the aspects using a Likert scale [23] with the values shown in Table 4.
The weights averages should be placed in a Microsoft Excel® worksheet so that they can continue to be used in subsequent stages of the proposed methodology. The next column is the assessment of the product/service's current situation for each WHAT (see Appendix A, question 3), assigning values such as those shown in Table 4.
Table 5 shows the application of these two stages in the case that serves as an example in this paper. A preliminary analysis of these data pairs is useful to find any existing gaps in customer satisfaction, particularly in cases where the importance of a requirement is scored as 'essential' and the current situation of the organisation in meeting that requirement is scored as 'very poor'. As explained in the next stage, these combinations of values are used to identify the value of the improvement objective.
3.4.3 Assignment of improvement objective and improvement range
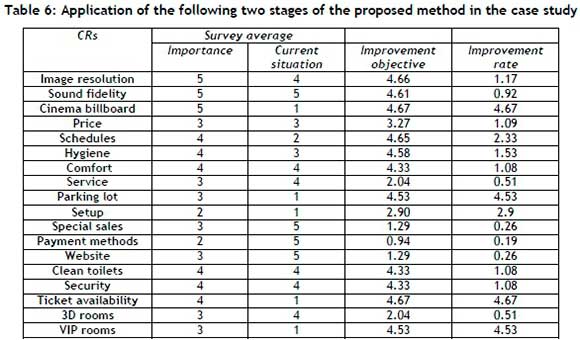
The requirement importance grade represents the area of most interest to the customers; and the current situation evaluation highlights the absolute strengths and weakness in the products or services provided by the company. In this way the improvement opportunities are discovered by comparing the values of importance and of the current situation; this is where the 'objective of improvement' concept comes from.
The identification of processes that are prioritised to conform to the QMS begins with this stage. For example, if an important requirement has an evaluation of 'poor' for the current situation in the organisation, then a suitable process in the QMS will have to be considered so that it increases its evaluation and becomes a competitive advantage. The model in Figure 2 and equation 1 uses the values for importance and for the current situation to assign the corresponding value to the improvement objective. The model seeks to obtain an adequate value for each data pair, as follows:

a. Correcting (assigning an improvement objective a high value) the high importance values and low current situation, and
b. Complimenting (assigning an improvement objective a low value) the low importance values and high current situation.
The range of improvement is obtained by dividing the improvement objective by the value of the current situation of every requirement.

In equation (1), X1 and X2 represent the input values (the pair of data that rate the importance and the current situation of a specific customer requirement). The other numbers shown in the equation were obtained using an artificial neural network (ANN). The use of the ANN involved the fed of different input quantities (importance and current situation) to generate the output (specific values, called 'improvement objectives'), and then the backpropagation of errors for gradient descent optimisation (training). The training values that were taken into consideration were those of correction and/or complimenting, as mentioned above. There is evidence in the literature about the use of similar ways of assigning a number to every possible pair of data in the (x,y) space. For example, in an investigation by Rodas et al. [50], the identification of the sense of belonging that a university community has with its institution was carried out, considering the behaviour of two items of data: the role in the university (professor, administrator, or student) and their degree of knowledge and understanding of aspects that are important to the institution. In a study by Espejo-Fandiño [51], the boarding time per passenger on urban routes in the city of Bogota was determined on the basis of two types of data: the different types of vehicle that operate in the public transport of the city, and the bus occupation (e.g., few or many passengers standing). In this paper, some properties of the utility function were used - specifically that of assigning larger numbers to those preferred data pairs (when a significant requirement has a poor evaluation of the current situation in the organisation) instead of the least-preferred ones [24]. Table 6 shows the application of these last stages in the case serving as an example in this paper.
3.4.4 Assignment of sales argument
In this stage, the perception of the manufacturer/service provider should also be considered. This is because the proposed method includes in the identification of the processes the preferences of the end customer and also those of the manufacturer and/or service provider. The perception must also be translated into a numerical scale. In addition, it is proposed to conduct a survey of a manufacturer or service provider (see Appendix A, question 4), using a Likert scale [23] with the values shown in Table 7. This stage is shown in Table 8.
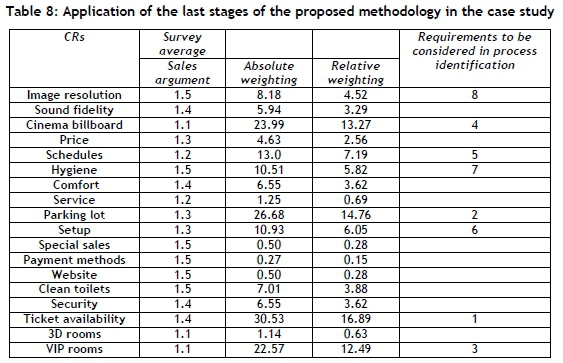
3.4.5 Calculation of absolute weighting and relative weighting
The absolute weighting for each aspect is obtained through the product of the improvement objective, the improvement rate, and the sales argument. For the calculation of the relative weighting of each aspect, the following model is proposed:

where:
Yi = relative weighting of each CR
Xi = specific requirement of customer
n = total number of requirements considered
Table 8 shows the application of these stages in the case serving as an example in this paper.
3.4.6 Selection of CRs to be considered in the identification of processes
Once the calculations have been made to obtain the absolute and relative weights of each customer requirement, those that should not be considered for the identification of the processes are ignored. The method of this paper proposes to use the Pareto principle [25] to carry out this action, taking as its reference the values of the relative weights. The requirements whose values have a greater relative weight are presumably of greater interest to customers, so it will be necessary to make sure to choose them and to discard those of low relative weight.
The last column in Table 8 shows the customer requirements selection using the 80-20 rule (80 per cent of effects are due to 20 per cent of the causes). These requirements are identified in ascending order until they reach a cumulative sum of 80 per cent in their relative weights. In this case, that amount was slightly exceeded, reaching 82 per cent. For the identification of processes, the requirements found as 'vital' or important are listed, and in another column the organisation processes that currently exist are listed, which can be obtained through field observation or interviews with key personnel. Then both columns are matched by asking the following question: What process is used to meet a specific requirement that is identified as 'important' for the organisation? Processes that do not meet any customer requirements will have to be discarded from the QMS because investing resources in them would not contribute to customer satisfaction, thus making the QMS ineffective. Table 9 shows this stage in the organisation that serves as an example in this paper.

As can be seen in Table 9, the method shows that the organisation being studies should include only five processes in the design of its QMS: operative administration, projection, infrastructure maintenance, supplying, and planning. Based on the selection of only these processes, the CRs will be met, and customer satisfaction will be the result. The selection of processes allows the prioritisation of only those resources that have an impact on customer satisfaction. This criterion is used because the methodology includes data that are obtained directly from customers, product/service providers, and a continuous improvement approach by using related variables, such as the objective of the improvement and the range of the improvement.
4 RESULTS
In this section the main results of the survey of the companies in this study are presented and analysed. First, general information about the processes found in companies' QMS is presented, and then specific information about the performance of the QFD-based method is presented.
One hundred and seventy processes were identified in the companies' QMS. On average, eight QMS processes were documented at the studied enterprises. These processes attracted attention: sales, competencies development, maintaining infrastructure, purchases, management review, and communication. The method proposed in this paper was applied to the data obtained from the application of the validated instrument (see Appendix A), and the following information was obtained: 96 processes identified by the proposed method were found to exist in the companies that were studied. Without doubt, the processes related to sales, production, purchases, maintenance, and developing competencies showed tendencies that needed to be identified. Other more specific processes in the organisations' business activities were identified too - for example: logistics, inspection point at goods receipt, cleaning/hygiene, and service quality. However, 74 existing processes related to the aspects contemplated in ISO 9001:2015 could not be identified - mainly processes such as communication, management review, external providers, people, and infrastructure. Other important characteristics found in the studied companies were:
• The number of people working in these enterprises was between 31 and 3 500.
• The maximum number of processes (11) was in enterprises of mining mechanical services.
• The minimum number of processes (five) was found at universities.
To analyse the performance of the proposed method in this research, a classification of the processes found in the companies was first developed. This classification was based on the work of Porter [26], Garvin [27], and Harrington [28]; and it had already been used in case studies to define QMS processes in industrial enterprises [22]. The classes of processes chosen for analysis were the primary, secondary (or support), and development (administrative) processes. Subsequently the proposed method (developed, with an example, in the methodology section) was applied to each process class. The way which the processes were grouped, and the results of the number of processes that were identified, are shown in Figures 3 to 5.
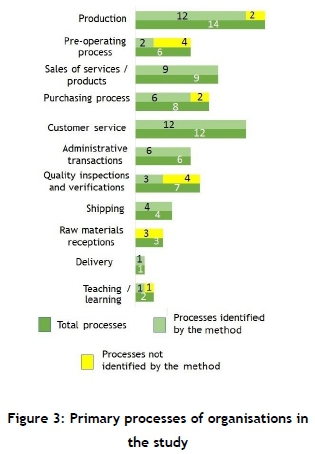


According to the results, 43.11 per cent (72) of the processes detected in the studied enterprises were primary processes. This result is similar to those obtained in the research by Popova et al. [22], who found that 50.45 per cent of the processes in 20 industrial companies in the Saratova region in Russia were primary. It is interesting to see the efficiency of the proposed method, because 61.11 per cent of these types of process were identified correctly (see Figure 3). Thus the use of this method would be very convenient as a standardised way of determining or identifying this process type in organisations that want to implement or improve their QMS. It is also important to mention that the processes related to pre-operating processes and quality inspections or verifications were difficult to identify.
The supporting processes (see Figure 4) of the enterprises showed that the proposed method identified 42.85 per cent of them (27 out of 63 processes). As can be seen, the processes' identification efficiency decreased at around 18 per cent with respect to the primary processes' identification. The authors consider that, since it is a methodology that focuses on the voice of the customer (the term used to describe stated and unstated customer needs or requirements), the efficiency of identifying support processes decreases because the client does not perceive their role in the product or service. However, as can be seen in Figure 4, the proposed method identifies in a very precise way some typical supporting processes, such as those related to the development of personnel competencies (training), maintenance, and facility management. Therefore the authors recommend using the proposed method only as a reference when identifying support processes.
Finally, this research studied the management processes and those related to the implementation of a QMS (see Figure 5). The proposed method identified a percentage similar to that for support processes: 46.87 per cent (15 of 32 processes) were identified and attracted attention as those related to customer relations and the achievement of product/service quality. However, as mentioned earlier in this paper, processes related to the aspects contemplated in ISO 9001:2015, such as management review, measurement-evaluation-improvement, and others, could not be identified by the method. Therefore the authors also recommend using the proposed method only as a reference when identifying this type of process.
5 DISCUSSION
The contribution of the QFD-based method shown in this research is that it can mathematically identify the processes that must be included in a QMS. It will also show, in established QMSs, which processes are not necessary and thus create extra costs in the organisation's quality management. Other researchers have also studied the costs involved in a QMS [29] [30]. However, it is necessary to clarify that, being a method that focuses its procedure on the customer's voice (through the QFD matrix), the identification of processes focuses only on those catalogued as operational processes. So the strategic processes (those intended to define and control the goals of the company) and some support processes might not be identified by this method. However, the use of a mathematical algorithm that identifies in a structured way the processes that directly affect the satisfaction of the client has not been much addressed in the literature; and so, this paper addresses this gap in the knowledge.
The authors believe that using a partial QFD-based approach instead of a desktop-oriented approach can eliminate the wrong perception that the main goal of a QMS is to obtain a conforming compliance certificate for a company [31]. This is because, in identifying algorithm-based processes, subjective judgements will be set aside, since the processes obtained will be the result of a data treatment exercise obtained from the organisation's interested parties.
Finally, this paper explains a process identification method that seeks to comply with the requirements of the ISO 9001 standard and some other quality models. This seeks to provide a scheme that allows one to identify the processes of those organisations that want to implement or improve their QMS. Thus, the method used could provide a standardised way of identifying processes in organisations with the same business line, and so facilitate other activities such as mapping relationships, creating procedures, and defining quality objectives and indicators.
6 CONCLUSIONS
It is possible to develop a systematic method for determining which processes must be included in a QMS. However, the method shown in this research performs better when identifying primary processes rather than supporting or QMS managerial processes. Therefore the authors suggest using it as a standardised way of determining or identifying primary processes, but using it only as a reference when identifying other types of process. The advantage of the method is that it demonstrates a scheme that eliminates the subjective selection of processes that must be part of a QMS. This will achieve a lean QMS that is relevant to and functional in organisations that wish to implement it, and enable each firm to develop the minimum amount of documentation needed in order to demonstrate that the QMS is as efficient as possible.
REFERENCES
[1] ISO. 2015. Quality management systems - Fundamentals and vocabulary. International Organisation for Standarisation, Geneva, Switzerland, pp. 1-55. [ Links ]
[2] ISO. 2015. Quality management systems - Requirements. International Organisation for Standarisation, Geneva, Switzerland, pp. 1-42. [ Links ]
[3] Medina, A., Nogueira, D. & Hernández, A. 2009. Relevance of process management in strategic planning and continuous improvement. Eídos, 2, pp. 65-72. DOI: https://doi.org/10.29019/eidos.v0i2.62 [ Links ]
[4] Mailar, M. 2010. La gestión por procesos: un enfoque de gestion eficiente. Revista Científica "Visión de futuro", 13(1). Available at: http://www.redalyc.org/articulo.oa?id=357935475004. Accessed on 16 Jul 2020. [ Links ]
[5] ISO. 2008. ISO 9000 Introduction and support package: Guidance on the concept and use of the process approach for management systems. Document: ISO/TC 176/SC 2/N 544R3. International Organisation for Standarisation, Geneva, Switzerland. [ Links ]
[6] De Feo, J.A. 2010. Business Process Management: Creating an Adaptable Organization. In Juran,J. & De Feo, J.A. (Ed.), Juran's quality handbook, 6th Edition. McGraw Hill. New York. pp. 255-277. [ Links ]
[7] Albart, E. 2007. Global, un modelo de gestión de procesos. Técnica Industrial, 272(1), pp. 34-41. [ Links ]
[8] Ponjuán, G. 2006. Principios y métodos para el mejoramiento organizacional. Editorial Félix Varela. Ciudad de la Habana, Cuba. pp. 192. ISBN: 959-07-0193-0. [ Links ]
[9] Hernández, A., Nogueira, D. & Medina, A. M. 2013. Inserção da gestão por processos em instituições hospitalares: Concepção metodológica e prática. Rev. Adm., 48(4), pp. 739-756. [ Links ]
[10] Hernández, Y., Lianes-Font, M. & Velázquez-Zaldívar, R. 2019. Managing by processes in civic participation: Application in the Holguín Province. Ingeniería Industrial, 40(1), pp. 59-66. [ Links ]
[11] Hernández, Y., Lianes-Font, M. & Velázquez-Zaldívar, R. 2018. Contribution to the management of citizen participation processes: Analysis of a case study. Dilemas Contemporáneos: Educación, Política y Valores, 5(2), pp. 1-21. [ Links ]
[12] ISO. 2015. Environmental management systems - Requirements. International Organisation for Standarisation, Geneva, Switzerland, pp. 1-36. [ Links ]
[13] ISO. 2018. Occupational health and safety management systems - Requirements and guidance for use. International Organisation for Standarisation, Geneva, Switzerland, pp. 1-41. [ Links ]
[14] ISO. 2013. Information technology - Security techniques - Information security management systems - Requirements. International Organisation for Standarisation, Geneva, Switzerland, pp. 1-24. [ Links ]
[15] ISO, 2017. Quality management - Guidelines for quality management in projects. International Organisation for Standarisation, Geneva, Switzerland, pp. 1-34. [ Links ]
[16] Tapke, J., Muller, A., Johnson, G. & Seick J. The house of quality: Steps in understanding the house of Quality, IE 361. [ Links ]
[17] Evans, J. & Lindsay, W. 2014. Managing for quality and performance excellence, 10th Edition. Ohio, USA. Cengage Learning. [ Links ]
[18] Pérez, P., Llana, S. & Alcántara, E. 2006. Partial implementation of the Q.F.D. methodology for gymnastic mats design. International Journal of Applied Sports Sciences, 18(2), pp. 65-77. [ Links ]
[19] Jiménez, R., Macías, I. & Nuñez, P. 2020. Application of the QFD to products from a cannery. Espacios, 41(27), pp. 225-239. [ Links ]
[20] Mohd, M., Jaffar, A., Kasolang, S. & Kayat, S. 2019. AHP-QFD in assessing the outcome of gemba kaizen events. In IOP Conf. Series: Materials Science and Engineering. doi:10.1088/1757-899X/834/1/012061. [ Links ]
[21] Peterson, R. 1994. A meta-analysis of Cronbach's coefficient alpha. Journal of Consumer Research, 21 (2), pp. 381-391. doi: 10.2307/2489828. [ Links ]
[22] Popova, L., Yashina, M., Bocharova, S. & Cherkashnev, R. 2018. Development of methodology of identification of the quality management system processes. Quality Access to Success, 19(164), pp. 43-47. [ Links ]
[23] Boone, H. & Boone D. 2012. Analyzing Likert data. Journal of Extension, 50(2). Retrieved: https://archives.joe.org/joe/2012april/pdf/JOE_v50_2tt2.pdf. Accessed on 16 Jul 2020. [ Links ]
[24] Coculescu, D. & Delbaen, F. 2019. Surplus sharing with coherent utility functions. Risks, 7(1), p. 7. https://doi.org/10.3390/risks7010007. [ Links ]
[25] Harvey, B. & Sotardi, S. 2018. The Pareto principle. Journal of the American College of Radiology, 15(6), p. 931. https://doi.org/10.1016/j.jacr.2018.02.026. [ Links ]
[26] Porter, M. 2016. Competitive advantage. Creating and sustaining superior performance. Moscow: Alpina Publisher. [ Links ]
[27] Garvin, D. 1998. The processes of organization and management. Sloan Management Review, 39(4), pp. 33-50. [ Links ]
[28] Harrington, J., Esseling, E. & Nimwegen, H. 2002. Business process improvement workbook (translated version). St Petersburg: Azbuka Publisher. [ Links ]
[29] Neyestani B. & Punongbayan, J. 2017. Impact of ISO 9001 standard on the quality cost of construction projects in the Philippines. Conference: 2017 Manila International Conference on "Trends in Engineering and Technology", pp. 60-65. [ Links ]
[30] Bialasiewicz, A., Breidenbach, K., Kayambu G., Al Saeidi, R. & Ganguly, S. 2006. Konzeption und implementierung eines qualitätsmanagementsystems nach ISO 9001:2000: Qualitäts- und effizienzsteigerung über 3 jahre an der augenklinik der Sultan Qabbos Universität in Oman. Der Ophthalmologe, 103(10), pp. 877-887. [ Links ]
[31] Yashin, N., Popova, L., Bocharova, S. & Bagautdinova, N. 2016. Customer satisfaction assessment in management quality system of industrial enterprises. International Business Management, 10(24), pp. 5720-5726. [ Links ]
[32] Bacoup, P., Michel, C., Habchi, G. & Pralus, M. 2017. From a quality management system (QMS) to a lean quality management system (LQMS). The TQM Journal, 30(1), pp. 1-25. https://hal.archives-ouvertes.fr/hal-01649171. [ Links ]
[33] Micklewright, M. 2010. Lean ISO 9001: Adding spark to your ISO 9001 QMS and sustainability to your lean efforts. Milwaukee: ASQ Quality Press. [ Links ]
[34] Dumas, M., La Rosa, M., Mendling, J. & Reijers, H. 2013. Fundamentals of business process management. Berlin: Springer. DOI 10.1007/978-3-642-33143-5 [ Links ]
[35] Cuong, D. 2020. The effect of physical environment and perceived value on customer satisfaction and behavioral intention at the cinema in Vietnam. Test Engineering and Management, 82(1), pp. 1665-1674. [ Links ]
[36] Cuong, D. 2020. Empirical research on the relationship between service quality, customer satisfaction, and customer loyalty at the cinema: Evidence from Vietnam. Test Engineering and Management, 82(1), pp. 16491657. [ Links ]
[37] Ogbuji, Ch., Onuoha, O. & Abdul, U. 2016. Spatial layout and customer patronage of cinema firms in Port Harcourt, Nigeria. International Journal of Research in Business Studies and Management, 3(6), pp. 44-50. [ Links ]
[38] Fira, F. & Tumewu, F. 2015. Customer decision making in selecting cinema using analytical hierarchy process (AHP) method (Case study: mantos 21, megamall XXI, cinemaxx). Jurnal Berkala Ilmiah Efisiensi, 15(4), pp. 322331. [ Links ]
[39] Kowalik, K. & Klimecka-Tatar, D. 2017. Identification of main areas of customer service process improving in the cinema. Archives of Engineering Knowledge, 2(1), pp. 42-44. [ Links ]
[40] Nahm, Y., Ishikawa, H. & Inoue, M. 2013. New rating methods to prioritize customer requirements in QFD with incomplete customer preferences. International Journal of Advanced Manufacturing Technology, 65(1), pp. 15871604. DOI 10.1007/s00170-012-4282-1 [ Links ]
[41] Chen, C.C. & Chuang, M.C. 2008. Integrating the Kano model into a robust design approach to enhance customer satisfaction with product design. International Journal of Production Economics, 114(1), pp. 667-681. [ Links ]
[42] Burge, S. 2007. A functional approach to quality function deployment (putting the function back into quality function deployment). Systems Engineering, Technical Paper 0001/sb. [ Links ]
[43] Delgado-Hernandez, D., Bampton K. & Aspinwall, E. 2007. Quality function deployment in construction. Construction Management and Economics, 25(1), pp. 597- 609. DOI: 10.1080/01446190601139917 [ Links ]
[44] Sireli, Y., Kauffmann, P. & Ozan, E. 2007. Integration of Kano's model into QFD for multiple product design. In IEEE Transactions on Engineering Management, 54(2), pp. 380-390. DOI: 10.1109/TEM.2007.893990 [ Links ]
[45] Li, Y.L., Tang, J.F. & Luo, X.G. 2010. An ECI-based methodology for determining the final importance ratings of customer requirements in MP product improvement. Expert Systems with Applications, 37(1), pp. 6240-6250. [ Links ]
[46] Cherif, M.S., Chabchouf, H. & Aouni, B. 2010. Integrating customer's preferences in the QFD planning using a combined benchmarking and imprecise goal programming model. International Transactions in Operational Research, 17(1), pp. 85-102. [ Links ]
[47] Vargas, C. & Hernández, L. 2010. Validity and reliability of the questionnaire "Self-care practices of women during postpartum period". Avances en Enfermería, 28(1), pp. 96-106. [ Links ]
[48] Arteaga, A., Garzón, L. & Vergara, K. 2016. Validación de apariencia, de contenido y confiabilidad del cuestionario de confort holístico para la familia, Cartagena 2016. Tesis de grado en Enfermería, Universidad de Cartagena, Colombia. [ Links ]
[49] Oviedo, C. & Campo-Arias, A. 2005. An approach to the use of Cronbach's alpha. Revista Colombiana de Psiquiatría, 34(4), pp. 572-580. [ Links ]
[50] Rodas, P., Ospina, L. & Lanzas, A. 2010. Measuring the sense of belonging from a two-factor factorial design. Scientia et Technica, 44(1), pp. 111-116. [ Links ]
[51] Espejo-Fandiño, F. 2020. Analyze passengers' boarding time in buses in the city of Bogota using a factorial design. Ingeniería, Investigación y Tecnología, 21(1), pp. 1-13. http://dx.doi.org/10.22201/fi.25940732e.2020.21n1.005 [ Links ]
Submitted by authors 14 Sep 2020
Accepted for publication 28 Jul 2021
Available online 31 Aug 2021
* Corresponding author: ocruz@upz.edu.mx


