


Services on Demand
Article
 English (pdf)
 Article in xml format
 Article references
Indicators

Related links
-
 Cited by Google
 -
 Similars in Google
Share

 Permalink
South African Journal of Industrial Engineering
On-line version ISSN 2224-7890
Print version ISSN 1012-277X
S. Afr. J. Ind. Eng. vol.32 n.2 Pretoria Aug. 2021
http://dx.doi.org/10.7166/32-2-2340
GENERAL ARTICLES
Cellular manufacturing layout design using heuristic clustering algorithm and LPP model
Ramesh S.I, *; Arunkumar N.II; Vijayaraj R.III
IMechanical Engineering, Anna University, Chennai, India. http://orcid.org/0000-0002-1200-1647
IIMechanical Department, St. Joseph's College of Engineering, Chennai, India. http://orcid.org/0000-0002-6618-0329
IIIMechanical Department, Dhanalakshmi Srinivasan College of Engineering & Technology, Chennai, India. http://orcid.org/0000-0002-0364-611X
ABSTRACT
This mathematical model forms machine cells, optimises the costs of unassigned machines and components, and designs the shop floor cell layout to have minimal movement of materials. The complete similarity measure algorithm forms machine cells and part families in a refined form. Later, exceptional elements are eliminated in the optimisation model by using machine duplication and sub-contracting of parts. Then the shop floor layout is designed to have optimised material movements between and within cells. An evaluation of the cell formation algorithm' performance is done on the benchmark problems of various batch sizes to reveal the process's capability compared with other similar methods. The data of machining times are acquired and tabulated in a part incidence matrix, which is used as input for the algorithm. The results from the linear programming optimisation model are that costs are saved, machines are duplicated, parts are sub-contracted, and there are inter- and intra-cellular movements. Finally, the output of the inbound facility design is the floor layout, which has machine cell clusters within the optimised floor area.
OPSOMMING
Hierdie artikel bied 'n wiskundige model aan wat masjien selle skep, die onkostes van nie-toegewysde masjiene en komponente optimeer, en die aanlegvloer uitleg te ontwerp sodat daar minimale beweging van materiaal is. Die volledige eendersheidsmaatstaf algoritme skep masjien selle en onderdeelfamilies in 'n verfynde formaat. Daarna word uitsonderlike elemente van die optimeringsmodel verwyder deur die gebruik van duplikasie en sametrekking van onderdele. Daarna word die aanleg se vloeruitleg ontwerp om minimale beweging van materiaal tussen en binne-in die selle te hê. Die sel skeppingsalgoritme se vertoning word evalueer teen maatstafprobleme van verskeie lot groottes om die proses se vermoë te vergelyk met ander, soortgelyke metodes. Die data van masjineertye word verkry en getabuleer in n matriks wat gebruik word as inset vir die algoritme. Die resultate van die lineêre programmering optimeringsmodel is kostes wat gestoor word, masjiene wat gedupliseer word, onderdele wat saamgetrek word tesame met die inter- en intrasellulêre bewegings. Laastens word die aanleg se vloeruitleg bepaal wat masjien sel groeperings binne die geoptimeerde vloer area plaas.
1 INTRODUCTION
Cellular manufacturing (CM) works to increase productivity and production efficiency by reducing processing time, work-in-progress, and material movement time. In a CM system, identical components are formed as families and related machines are formed as cells so that one part family can be manufactured within a machine cell. Among various matrix formulation similarity coefficient methods, such as direct clustering, the bond energy algorithm, rank order clustering approaches, in this paper a complete similarity coefficient method (SCM) is proposed because of its easy cluster analysis and its being more flexible in having production data - for example, a process plan, part demand, and processing time.
The cell formation will have exceptional elements (EE) i.e., exceptional machines and parts. EE creates interactions between two manufacturing cells and void elements (VE) inside block diagonals that affect machine utilisation and grouping efficiency. An exceptional component is a component that requires manufacturing on machines in two or more cells. An exceptional machine manufactures parts from two or more part families. Exceptional elements create inter-cellular movements that affect the independence of the cells and increase costs.
Cell layout design has a direct effect on the function of the manufacturing system through the movement of materials. These can help to increase productivity, reduce work in process and inventories, shorten production lead times, and regulate the flow of materials. The operations of cells and the sizes of cell layouts can vary. The cell layout will have work cells inside it, in which machine tools are arranged in series or cross lines, depending on the process plans for the parts. However, a U-shaped layout can be preferred in a cell design that has simultaneous in-line or cross-movements of materials.
2 LITERATURE REVIEW
In this review, the survey was conducted on recent literature of mathematical approaches using various similarity coefficients. In [1], a new similarity coefficient is incorporated with the job sequence and part volume to form cells alone. Approach [2] preferred to apply Jaccard's similarity coefficient for forming cells alone using the principal component analysis. It [3] was proposed with a new similarity coefficient containing process plans, operation time, demand, and production volume, which are able to form machine cells alone. The job sequence, part volume, inter-cell movement cost, job production cost, and the alternative process plans were [4] used in the proposed similarity coefficient-based heuristic method for CM. The cell formation [5] was done, and also achieved the minimisation of the cumulative cell load variation and cumulative inter-cellular moves. The number of parts, operation sequences, processing time, the capacity of machines, and workload of the machinery were considered as parameters. For the grouping of the equipment, the modified artificial bee colony algorithm was considered. A new multi-objective mathematical model [6] was provided with a consideration of machine reliability and alternative process routes. The literature [7] has provided a new model by considering dynamic production times, and uncertainty demands in designing cells for test problems with real-world dimensions have been solved using simulated annealing and particle swarm algorithms. The review revealed that the similarity coefficient can possess parameters such as job sequence, setup and handling time, changes in demand, and volume, in addition to machining time, machine capacity, and several operations to have the capability to form the perfect machine and part clusters simultaneously without (or only a few) exceptional elements, which can overcome the difficulties faced by other methods.
This section of the review is aimed at evaluating the elimination of costs directly related to the exceptional elements. A paper [8] proposed a nonlinear programming model under potentially dynamic conditions that minimises the cost associated with the estimated demands for inter- or intra-cellular movements of elements (forwards and backwards movements), the existence of exceptional elements, the inter-cellular displacement of machines, and cellular reconfiguration and operational costs and the constant cost of machinery. The modified genetic algorithm [9] for interchanging block diagonal forms is for reducing voids inside cells and exceptional elements outside cells. Two alternative actions are evaluated [10]: a bottleneck machine can be duplicated, or it can be allowed; and manufacturing parameters are incorporated into the proposed simulation study, such as job sequence, batch size, and setup time in comparing the cost of alternatives. Parametric programming [11] is used to reduce the cost of an exceptional element, decrease the number of outer cell operations, and increase utilised machine capacity. The model [12] was proposed to reduce the number of movements between cells, voids, and EEs minimises the total cost of duplicated machines without considering the processing time of operations. A model was [13] proposed that considers reducing the cost of to-and-fro movements between cells and within the cells and the investment cost of machines. The above review revealed that the cost elimination of EE must look into intra-cell and inter-cell movements significantly by correlating machine duplication and part sub-contract respectively.
A layout optimisation model was [14] formulated based on fuzzy demand and machine flexibility, and then developed a genetic algorithm. A systematic methodology [15] was developed to combine the same machines into the cell, which was simulated, and the outcome of the cell design was evaluated by analysis of variance. A split departmental plant layout generation system was described by [16] to develop a facilities layout design that would minimise the material handling costs. Researchers [17] examined how lean production principles had a significant impact on the dimensions of ramp-up factories, including their length and clear interior height. Both the mapping of materials flows and the optimisation of layout [18] were considered through the integration of different operative techniques and commercial software. The proposed construction-cum-improvement algorithm [19] was a novel combination of analytical steepest descent and heuristic cluster boundary search.
In section 3 of the current work, machine cells are formed by using the proposed similarity coefficient between machines and components, as well as refining clusters by using a weight-based approach in-line, with the similarity measure proposed in a recent model [3]. Finally, a performance evaluation is carried out through machine utilisation (MU), grouping efficiency (GE), and the percentage of exceptional elements (EE). In section 4, a linear programming model is developed to reduce the cost of exceptional elements more than the cost reduction given in [11]. In section 5, the sizes of cells, positioning cells, and machines are determined with the help of the sorting of cells and of machines in relation to their origin; and finally
a 2D shop floor layout is designed.
2.1 Notations
A Aisle between machines or machine to sidewalls
Ai Cost of machine type i
aij 1 if part j assigned to machine i, 0 otherwise
axi 1, if part type x visits machine i; 0 otherwise
axjr 1 if part type j assigned to machine x with process plan r; 0 otherwise
ayi 1, if part type y assigned to machine j; 0 otherwise
ayjr 1, if part type j assigned to machine y with process plan r; 0 otherwise
Bik Budget allowed duplicating the bottleneck machine i
BM, BP Set of pairs of bottleneck machines, bottleneck parts (i, j)
BS1x and BS1y No. of future batches of part x and y rounded to the whole, D1x/Vx, D1y/Vy
BSx and BSy No. of batches of part x and y rounded to the whole, Dx/Vx, Dy/Vy
C Number of components
Ci Periodic capacity of machine type i
Ck Number of jobs in the kth cell
Dj Periodic demand for part j
DM Duplicated machines set connected to exceptional component j
DN, SC Set of pairs of duplicated machines, sub-contract parts (i, j)
Dx and Dy demand of part type x and y per period
EE No. of exceptional elements
GE Grouping efficiency
i = 1... , M (machines index)
IAj Handling cost for a unit of part j within one cell
Ij Handling cost for a unit of part j between two cells
j =1..., N (parts index)
k =1..., Nc (cells index)
Ml Number of machines along lengthwise of the cell
M Number of machines
Mk Number of machines in the kth cell
MLi Machine length considered from the dimensions of machine i
Mrs/Mls Number of machines along the right side and left side of the cell
MTij Machining time of machine i required for part j
MU Machine utilisation
MW Machine width considered as constant for all machines
N Total number of operations
N01 Total number of operations within the block diagonals
Nc Number of cells formed
nj Number of operations a part j undergoes
nk Number of operations in kth cell;
PBsj Ratio of no. of batches of part j, BSj / BS1j
pj (xk) Probability of operations in the jth job
q Weighing factor 0 < q < 1=0.5
Qi Number of machine type i required to process parts in machine cells (integer)
p = 1.. , P (process plans)
Rik Number of machine type i to be purchased for cell k (integer)
Sj Subcontracting cost of a part j for a process
spxj, spyj Process sequences of part j in machines x and y respectively
tix/ Ctx Ratio of processing time which part x in machine i with a cycle time of part x.
tiy/ Cty Ratio of processing time which part y in machine i with a cycle time of part y.
tjxr/ Ctx Ratio of machining time which part j in machine x with a cycle time of part j;
tjyr/ Cty Ratio of machining time which part j in machine y with a cycle time of part j;
UCij Usage capacity of machine i for part j (MTj Dj / Ci)
Vx and Vy Batch size of part type x and y per period
wk Frequency of operations in the kth part family/cell;
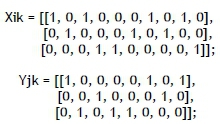
Xik, Yjk 1 if machine i and part j occurs in cell k respectively, 0 otherwise
(noj-spxj+1)/noj Proportion of job sequence weight and no. of operations to be done on part j; this term represents the ratio of process sequence weight of machine x, pswxj
(noj-spyj+1)/noj Proportion of job sequence weight and no. of operations available on machine y; this term represents the ratio of process sequence weight of machine y, pswyi
3 PRAGMATIC ALGORITHM OF A RESUMPTIVE INLINE (PARI) MODEL
The proposed PARI model forms machine cells and part family clusters in two stages. In the first stage, the similarity coefficient algorithm forms machine cells and part families. In the second stage, as resumption, the same clusters are iterated by a weighting-based method to obtain proper partitioning by refining the machine cells and the part families. The modus operandi of generating high similarity matrices incorporates a job sequence weight ratio, setup and handling time in processing time ratio, the ratio of present and new batch sizes, which have a significant impact on finding complete similarity for machines as well as components. The authors incorporated the necessary manufacturing data, such as alternative process plans and operational sequences, to improve the similarity coefficient in order to process the input data over the other similarity coefficients.
3.1 A complete similarity measure weight-based algorithm
The process plan-weight ratio is calculated between the sequence weight and the number of operations to be done on the part. The ratio of batch size is calculated between the new batch size and the present batch size of parts. The batch size is the ratio between demand and production volume. The use of the time ratio, the sequence weight ratio, and the batch size ratio will help in boosting the similarity between machines as well as parts.
The cycle time of each part is calculated by considering the sum of waiting time, setup time, and handling time, which is assumed to be equal to the machining time for each operation to be performed in the machine.

From the assumptions of the model, the cycle time is double the value of the machining time of each operation of the part.

The process sequence weightage ratio is calculated between the weightage of a sequence of the particular operation and the total number of operations to be performed on the part.

For machines, compute the similarity coefficient between machines x, y (for forming machine cells) using equation (4), SCxy = 1 if x = y
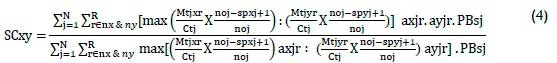
The similarity coefficient SCxy is calculated between machines, and the similarity coefficient matrix is formulated from the input part incidence matrix along with the production data, considering all alternative process plans.
For parts, compute the similarity coefficient between parts x, y (for forming part family) using equation (5). SCxy = 1 if x = y;
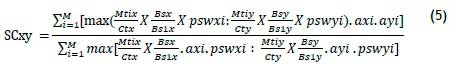
The similarity coefficient of parts is calculated, and a matrix is formulated for each of the process plans. Several parts' similarity coefficient matrices will be equal to several process plans. A good cluster is chosen among various process plans parts matrices.
The quintessential proposal in similarity measure is the inclusion of manufacturing data proportions that have a significant impact on similarity whose purpose is to generate simultaneously perfect clusters of machine cells and part families. The pragmatic algorithm is coded and executed to generate similarity matrices using the C++ programming language (with a 2.13 GHz Core 5 Pentium processor); the production data are given as the input, and the output is obtained as similarity coefficient matrices, and a block diagonal form is obtained through iteration using spreadsheet simulation.
The weights for the rows and columns of the similarity coefficient matrix (machine-machine matrix) are calculated using the equations:
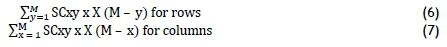
Select X > 1, replace M with N for the part-part similarity matrix. Arrange the rows and columns in a descending order of magnitude of the weights obtained.
An iteration using spreadsheet simulation is done until there is no change in the sorting of the rows and columns. Cells and part families are identified from the machine matrix and the part matrix, finally obtaining a block diagonal form from the given machine component incidence matrix.
Clusters are refined sequentially for machine cells and part families, assuming that part family and machine cell formation has already been carried out that is, to use this procedure for machine cell formation when the part family is known, or vice versa. If the components are more than machines, first use the procedure for part family refining; otherwise use the procedure for machine cell refining and then another. A machine cell or part family is formed using the procedure explained earlier, assuming that cell formation has already been done; part family formation is explained here.
Assign weights to each part or a machine to the cell or part family using equations 8 and 9.

The component or machine is assigned to the machine cell or part family where it has scored the highest weight, and then to the other.
3.2 Numerical illustration
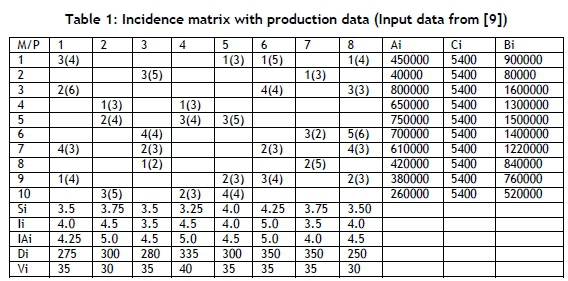
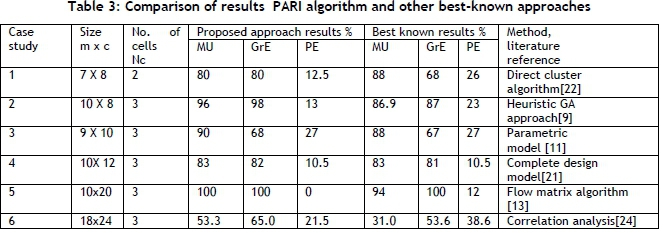
The selected benchmark problems (the literature references to five mathematical approaches and one metaheuristic approach of different sizes are mentioned in each input case study) of small, moderate, and large machine component incidence matrices are solved. The data for part incidence, machining time, job sequence, demand and production volume, and machine capacity are acquired and tabulated, and used as input for generating similarity matrices.
Case study 1: 7 machines X 8 components (input data from [20]) Cells are grouped after four iterations, part families are formed after ten iterations. After the weighting-based approach has been used in a series, a block-diagonal form is obtained.
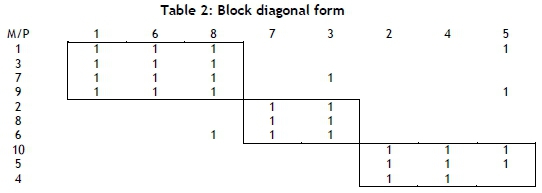
Case study 2: 10 machines X 8 components. Cells and part families are formed after four iterations in a spreadsheet simulation. After the weighting-based approach has been used in series so that cells are refined, then part families have perfect clusters because there are fewer parts than machines. In this solution, there is only one VE and there are four EEs, as shown in Table 2.
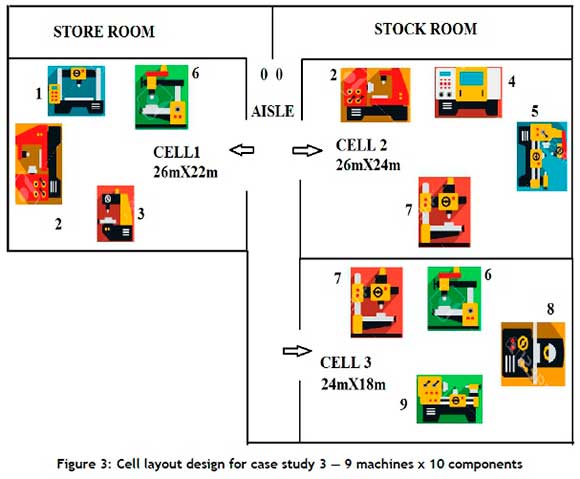
Case study 3: 9 machines X 10 components (input data from [11]). The machine and part similarity matrices are transformed into block diagonal form after three iterations and five iterations respectively, and cells and part families are formed.
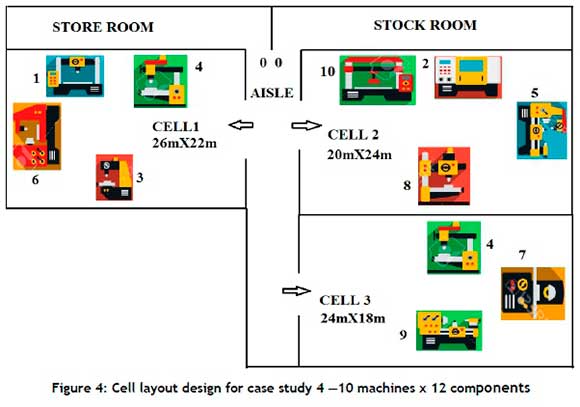
Case study 4: 10 machines X 12 components (input data from [21]). The machine and part similarity matrices are transformed into block diagonal form in the spreadsheet simulation after three iterations and seven iterations respectively.
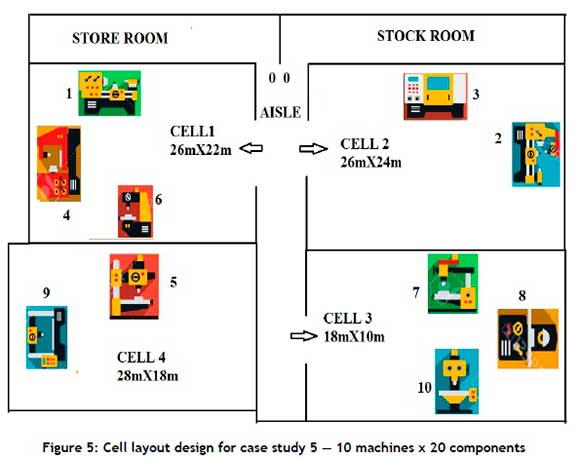
Case study 5: 10 machines X 20 components (input data from [23]). The incidence matrix is transformed using a similarity coefficient heuristic algorithm; cells are formed after three iterations, part families are also formed after two iterations. After the weighting-based approach used in a series, the relocation of clusters has taken place in both horizontal and vertical directions; finally, the block-diagonal form is obtained.
Case study 6: 18 machines X 24 components (input data from [24]). The block diagonal is now formed through iterations in similarity and weight-based methods over the machine and part matrices after seven iterations and ten iterations respectively.
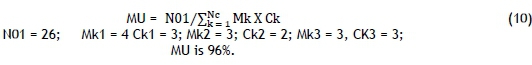
Evaluation through performance criteria for 10 x 8 machines components case study:
Machine utilisation: Machine utilisation is a parameter for measuring the goodness of a solution. It denotes the proportion of time the machines within cells are used in production.
Grouping efficiency:

Percentage of exceptional elements: Several elements that occur out of the diagonal blocks are called exceptional elements, which denote the impact of cell formation. The best cell formation approach ends in a lower percentage of exceptional elements.

For EE = 4, out of 30 (N), PE is 13%; the criteria for other case studies are shown in Table 3.
3.3 Discussion of results
This proposed PARI algorithm gives an optimal solution with minimal or no exceptional elements as one of the objectives. The solution of the small and medium-size case studies (1, 2, 3, 4, and 5) has few EEs or VEs. The machine grouping is effective in the large-size case study, and it has fewer EEs and VEs. This proposed similarity coefficient can achieve clear partitioning in block diagonal form, if even the case study is large (Case study 6). So this similarity measure algorithm is suitable for any part volume with no or few exceptional elements.
The small and moderate part machine-component case studies (Case studies 1, 2, 3, and 4) are solved effectively in less iteration time to get better solutions. The large-size machine component case studies (case studies 5 and 6) are solved with more than average performance compared with typical methodologies. EEs are equal in case study 4 with a benchmark case study, but inter-cell movements are fewer, and there are more voids than with the benchmark solution. The block diagonal form is given as input for an optimisation model and facility layout design, and transformed into a shop floor layout design for all the case studies in section 5.
4 OPTIMISATION MODEL
The aim of the proposed linear programming model is to reduce EE costs. The inferences from the literature review are the cost of EE, such as inter- and intra-movements; duplication and sub-contracting make up most of the recent crisis in the manufacturing sector. If duplication were is the only remedy for an exceptional element, then there would be no inter-cellular movements; so it is necessary to include intra-cellular movements in the objective function as the proposal in this work rather than the cost's elimination given by [4]. The other proposal in this model is the inclusion of the budget constraint to set a limit to machine duplication.
4.1 Decision variables
Zijk - Number of inter-cell movements required by part j when machine i is not available in cell k,
Wijk - Number of intra-cell movements required by part j w.r.t to machine i in cells(s) k,
Oijk - Number of units of part j to be sub-contracted when machine i is not available in cell k,
Mijk - No. of machine i dedicated by duplication to cell k for producing exceptional part j.
Step 1: The objective function is to maximise the sum of the savings by either duplicating the exceptional machines or sub-contracting the exceptional parts in the original cell.
The objective function is to maximise the savings by minimising:
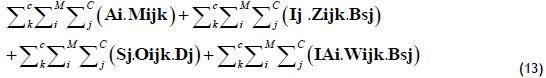
Equation 13 is an objective function that minimises machine duplication cost, inter-cellular movement cost, parts sub-contracting cost, and intra-cellular movement cost. The input coefficients of the objective function take the individual direct values of the input data for the given period of regular manufacturing operations.
Step 2: The constraints for bottleneck machines, intra-cell movements, and bottleneck parts with respect to sub-contract as well as inter-cell movements originally assigned to the same cell are:
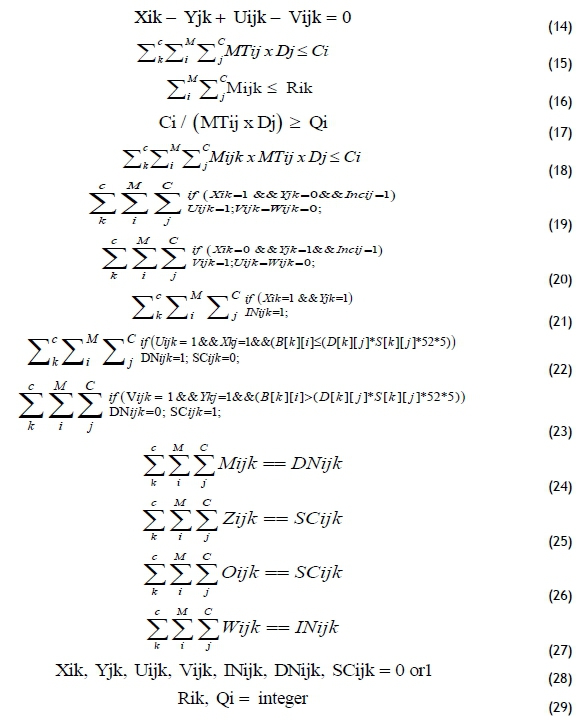
Equation 14 ensures that each machine and component is assigned to one cell only. Constraint 15 ensures that the sum of machining times of operations in each machine is within capacity. Constraint 16 is to check that the machines to be duplicated in each cell to process the part are fewer than the total number of duplicated machines of the same type in the cell. Constraint 17 is to ensure that a number of each machine type is within its utilisation capacity; otherwise its number will increase. Constraint 18 is to ensure that the sum of machining times of operations in duplicated machines of various parts in a cell is less than its capacity. Equations 19, 20, and 21 state the conditions to assign values for Ujk, Vjk, and INjk as 0 or 1. Equations 22 and 23 are the condition to assign DNjk and SCjk as 1. Equations 24, 25, 26, and 27 are the conditions to assign Mjk, Zjk, Ojk, and Wjk as 0 or 1 with preconditions DNijk, SCijk as 0 or 1.
Input data (Case study 2: 10 machines X 8 components)
The block diagonal form in Table 2 is converted into Xik, Yjk as an input data set, along with the other data sets from Table 1. The incidence matrix of size M x C is the primary data input, given as Inc [M][C](refer to Table 1). The purchase price, machine duplication budget, and the capacity of each machine type are given as A[M], B[M], and C[M] respectively. The inter-cell moving cost, intra-cell moving cost, sub-contract price, past, present, and future demands, and production volume of each part type are given as I[C], IA[C], S[C], D[C], D1[C], and V[C] respectively.
Step 3: If an exceptional part is assigned to two or more exceptional machines, then either all of these machines or none are duplicated in the cell to which the part was originally assigned.
Step 4: The constraint for duplication budget is formulated using the purchase price of those machines related to each bottleneck part.
4.2 Budgetary constraint

In the analysis of the exceptional elements, sometimes sub-contracting the bottleneck parts will be dealt with alone to check whether or not the bottleneck machines are to be considered for duplication. The optimisation model is used to solve all the case studies in Ilog Cplex 12.2. An engine log for case study 2 during execution is a minimisation problem with 448 variables and 635 constraints.
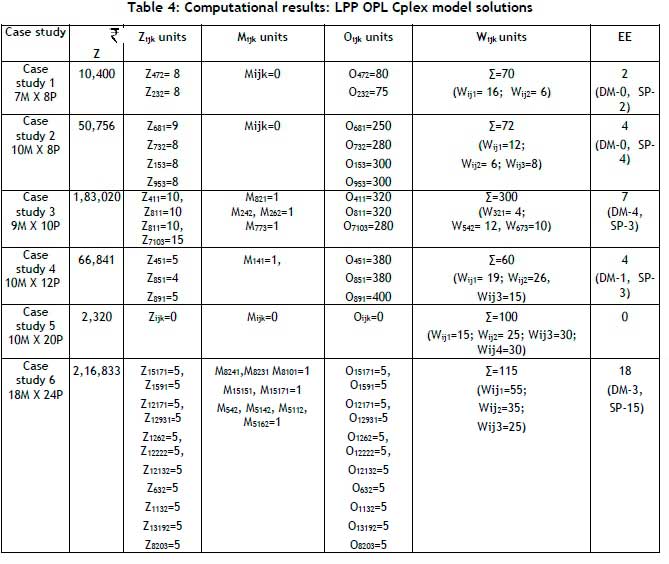
4.3 Discussion of results
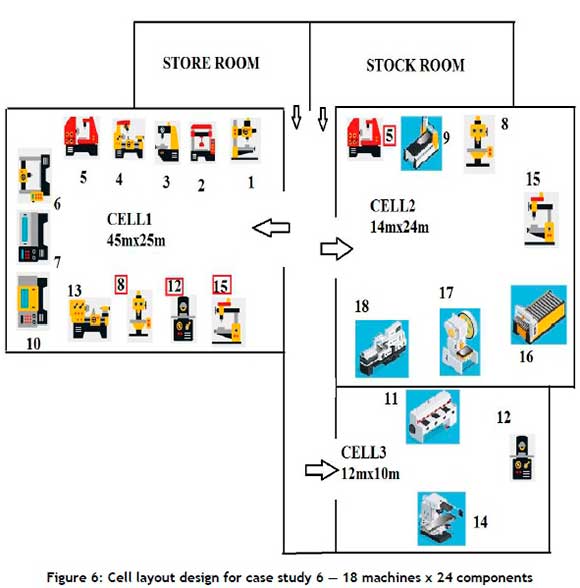
In the solution of case study 3, out of seven exceptional elements, bottleneck machines 2, 7, and 8 are chosen to be duplicated and estimated for intra-movement costs concerning their cell; bottleneck components 2, 4, 6, and 7 are eliminated, and the remaining two (1 and 10) are sub-contracted. In most problems, the sub-contracting cost is low and moderate, so parts are sub-contracted alone to eliminate EE. The total of all intra-movements is given and, along with it, some movements are given - one in each cell. The duplication of machine 8 in case study 6 consecutively eliminates three exceptional elements; the duplication of machine 5 consecutively eliminates four exceptional elements; the duplication of machine 15 eliminates two exceptional elements. The number of duplicating machines in the respective cells depends upon the total machining time of the machine processing parts.
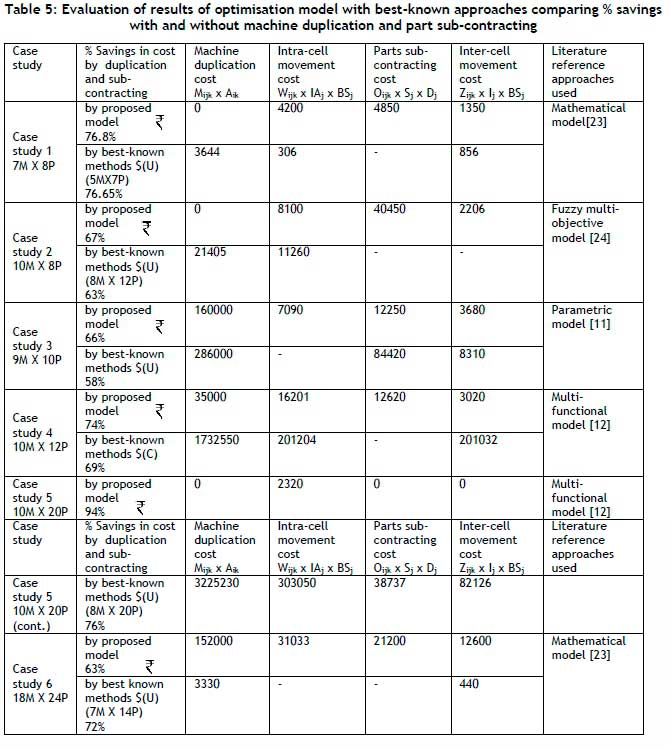
In evaluating the performance of the linear programming optimisation model against recently used approaches, the solutions to smaller problems are almost the same, but the proposed model yields good results for medium and large problems, particularly for duplication and sub-contracting.
Several inter- and intra-cellular movements; the number of parts to be contracted is given. In this proposed model, once the duplication of machines has been completed without sub-contracting parts, there is no need to calculate the inter-cell movements' costs and sub-contracting costs.
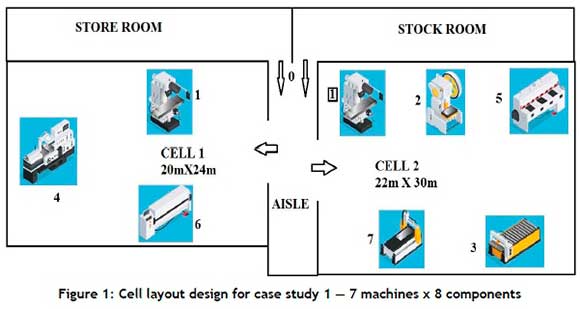
5 CELL LAYOUT DESIGN
The location of cells in a manufacturing industry considers the volume of the part supplied to each cell and the volume of the part allotted to each machine in the respective cell. The strategies followed in facility design are flexibility, optimum space use, and minimum capital investment. The part volume to be processed plays a vital role in locating the machinery within the cell and locating the cell within the shop floor, according to the determined preference order.
The aisle can be between 0.9m and 1.5m for small and medium-size layouts, and between 1.5m and 1.8m for larger layouts, depending on the available floor area. But for effective material handling and supervision, the minimum lengths of aisles - 0.9m and 1.5m - are preferred. In all of these case studies, the machines' width is assumed to be 1.2m for all the machines in smaller and medium-size cellular layouts.
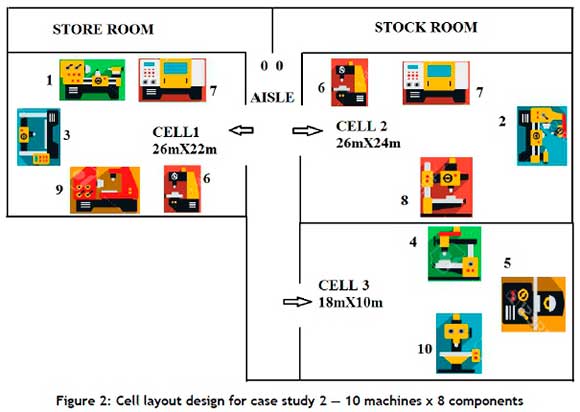
5.1 Number of machines in the cell (Mk)
The machines are arranged in a U-shaped layout to enable effective intra-movements of materials, tools, labour, and supervision over the entire cell. The machines are divided into three equal sets; the first two full sets of machines are arranged along the right side, lengthwise, and the remaining machines are arranged along the left side of the cell, starting from the point of entry.
5.2 Discussion of results
The cell layout design is prepared as a 2D shop floor plan, using a suitable scale to have easy measuring lengths. All of these cells and machines are located in relation to the storeroom and the stock room, with an adjacent entry as the starting point namely origin 0 x 0. The cell and machine locations can be measured as rectilinear from the origin for an easy plotting of the shop floor. The aisles of the cells, machines, and partitions are considered in line with the problem size. The outcomes obtained from this layout design are the floor area required by each cell and savings in the floor area compared with the traditional process layout, and the distances travelled by each job in and between cells and the savings in distances travelled compared with the process layout. The savings in floor area and movement length are not related to the case study size, but depend solely on the types of machinery provided and the part volumes handled.
6 CONCLUSIONS
The best clusters of machine cells and part families are achieved simultaneously, compared with recent mathematical approaches to using the floor area saving, to reduce human movements and manufacturing costs. The results of the optimisation mathematical model are the costs of EE, while the estimation of the costs of duplication, sub-contracting, and inter- and intra-movements seriously considered the budgetary constraints of duplication and the economic trade-off of parts sub-contracting.
The performance evaluation proves the sustainability of the proposed PARI model, and that it is suitable for small and medium-size formation case studies, yielding greater grouping efficiency and working much better for large formation case studies with a lower percentage of exceptional elements than other mathematical approaches. In this proposed model, once the duplication of machines is done without subcontracting the parts, there is no need to calculate the inter-cell movement's costs and the sub-contracting costs. Significance will be given in cases when there are both inter- and intra-cell movement costs if duplication or sub-contracting arises. Because of management's investment policy, increases in machine duplication will be restricted owing to budgetary constraints; and this will tend to increase the subcontracting of parts.
In future, the proposed mathematical approach could be extended for scheduling as well as line balancing through heuristic clustering by considering simulation on the shop floors of warehouses and storerooms, as well as inventory for raw materials - all being a work-in-process.
REFERENCES
[1] Dixit, A.R. and Mishra, P.K. 2010. Ex-CLASS: Extended cell formation and layout selection considering production parameters with sequence data. International Journal of Product Development, 10(1/2/3), pp. 180-200. DOI: 10.1504/IJPD.2010.029992 [ Links ]
[2] Albadawi, Z., Bashir, H.A. & Chen, M. 2005. A mathematical approach for the formation of manufacturing cell. Computers and Industrial Engineering, 48, pp. 3-21. https://mpra.ub.uni-muenchen.de/id/eprint/3975 [ Links ]
[3] Garbie, I.H., Parsaei, H.R. & Leep, H.R. 2008. Machine cell formation based on a new similarity coefficient. Journal of Industrial Systems Engineering, 1(4), pp. 318-344. https://www.researchgate.net/deref/http%3A%2F%2Fdx.doi.org%2F10.1080%2F00207540412331270432 [ Links ]
[4] Kumar, S. & Sharma, R.K. 2014. Cell formation heuristic procedure considering production data. International Journal of Production Management Engineering, 2(2), pp. 75-84. DOI:10.4995/ijpme.2014.2078 [ Links ]
[5] Arunagiri, A., Marimuthu, U., Gopalakrishnan, P., Slota, A., Jerzy Zajac, J. & Paula, M.P. 2018. Sustainability formation of machine cells in group technology systems using modified artificial bee colony algorithm. Sustainability, 10, 42. DOI: 10.3390/su10010042 [ Links ]
[6] Rabbani, M., Farrokhi-Asl, H. & Ravanbakhsh, M. 2019. Dynamic cellular manufacturing system considering machine failure and workload balance. Journal of Industrial Engineering International, 15, pp. 25-40. https://doi.org/10.1007/s40092-018-0261-y-012345 [ Links ]
[7] Ayough, A. & Khorshidvand, B. 2019. Design a manufacturing cell system by assigning workforce. Journal of Industrial Engineering and Management, 12(1), pp. 13-26. https://doi.org/10.3926/jiem.2547 [ Links ]
[8] Golmohammadia, A.-M., Asadib, A., Amiric, Z.A. & Behzad, M. 2018. Design of a facility layout problem in cellular manufacturing systems with stochastic demands. Management Science Letters, 8, pp. 1133-1148. DOI: 10.5267/j.msl.2018.8.010 [ Links ]
[9] Car, Z. & Mikac, T. 2006. Evolutionary approach for solving cell-formation: Case study in cell manufacturing. Advanced Engineering Informatics, 20, pp. 227-232. https://www.bib.irb.hr/274636 [ Links ]
[10] Hachicha, W., Masmoudi, F. & Haddar, M. 2007. An improvement of a cellular manufacturing system design using simulation analysis. International Journal of Simulation Model, 4, pp. 193-205. DOI: 10.2507/IJSIMM06 (4)1.089 [ Links ]
[11] Arikan, F. & Gungor, Z. 2005. A parametric model for cell formation and exceptional elements' problems with fuzzy parameters. Journal of Intelligent Manufacturing, 16, pp. 103-114. https://www.researchgate.net/deref/http%3A%2F%2Fdx.doi.org%2F10.1007%2Fs10845-005-4827-3 [ Links ]
[12] Tsai, C.-C. & Lee, C.-Y. 2010. Optimization of manufacturing cell formation with a multi-functional mathematical programming model. International Journal of Advanced Manufacturing Technology, 50, pp. 1135-1144. DOI: 10.1007/s00170-005-0056-3 [ Links ]
[13] Mahdavi, I., Shirazi, B. & Paydar, M.M. 2008. A flow matrix-based heuristic algorithm for cell formation and layout design in cellular manufacturing system. International Journal of Advanced Manufacturing Technology, 39, pp. 943-953. https://doi.org/10.1007/s00170-007-1274-7 [ Links ]
[14] Zhang, X., Zhou, H. & Zhao, D. 2018. Layout optimization of flexible manufacturing cells based on fuzzy demand and machine flexibility. Mathematical Problems in Engineering, Article ID 4018628, https://doi.org/10.1155/2018/4018628 [ Links ]
[15] Chip, W.-T., Low, S.-N. & Kamaruddin, S. 2016. Application of re-layout approach for cellular layout in manual assembly process. International Journal of Services and Operations Management, 24(2), https://www.researchgate.net/deref/http%3A%2F%2Fdx.doi.org%2F10.1504%2FIJSOM.2016.076502 [ Links ]
[16] Gopalakrishnan, B., Weng, L. & Gupta, D.P. 2003. Facilities design using a split departmental layout configuration. Facilities, 21(3/4), pp. 66-73. https://doi.org/10.1108/02632770310469370 [ Links ]
[17] Low, S.P., Gao, S. & Tiong, K.L. 2015. Applying lean production principles to facilities design of ramp-up factories. Facilities, 33(5/6), pp. 280-301. https://doi.org/10.1108/F-11-2013-0086 [ Links ]
[18] Petrillo, A., De Felice, F., Silvestri, A. & Falcone, D. 2016. Lay-out optimization through an integrated approach based on material flow and operations mapping using a commercial software. International Journal of Services and Operations Management, 23(1), pp. 113-134. http://www.inderscience.com/link.php?id=73294 [ Links ]
[19] Tasadduq, I., Imam, M. & Ahmad, A. 2015. A hybrid algorithm for optimizing facility layout. South African Journal of Industrial Engineering, 26(1), pp. 120-134. https://www.researchgate.net/publication/279854255 [ Links ]
[20] Murugan, M. & Selladurai, V. 2007. Optimization and implementation of the cellular manufacturing system in a pump industry using three cell formation algorithms. International Journal of Advanced Manufacturing Technology, 35, pp. 135-149. DOI: 10.1007/s00170-006-0710-4 [ Links ]
[21] Chalapathi, P.V. 2012. Complete design of cellular manufacturing systems. International Journal of Advanced Engineering Technology, III (III), pp. 67-71. https://www.technicaljournalsonline.com/ijeat/VOL%20III/IJAET%20VOL%20III%20ISSUE%20III%20JULY%20SEPTEMBER%202012/Article%2015%20Vol%20III%20issue%20III%202012.pdf [ Links ]
[22] Nair, G.J. & Narendran, T.T. 1998. Case study: A clustering algorithm for cell formation with sequence data. International Journal of Production Research, 36, pp. 157-179. https://doi.org/10.1080/002075498193985 [ Links ]
[23] Mahdavi, I., Paydar, M., Solimanpur, M. & Saidi-Mehrabad, M. 2010. A mathematical model for integrating cell formation case study with machine layout. International Journal of Industrial Engineering & Production Research, 21(2), pp. 61-70. https://www.researchgate.net/publication/49591578 [ Links ]
[24] Masmoudi, F., Haddar, M. & Hachicha, W. 2008. Formation of machine groups and part families in cellular manufacturing systems using a correlation analysis approach. International Journal of Advanced Manufacturing Technology, 36, pp. 1157-1169. https://doi.org/10.1007/s00170-007-0928-9 [ Links ]
[25] Nunkaew, W. & Phruksaphanrat B. 2013. Effective fuzzy multi-objective model based on perfect grouping for manufacturing cell formation with setup cost constrained of machine duplication. Songklanakarin Journal of Science and Technology, 35(6), pp. 715-726. [ Links ]
Submitted by authors 13 Mar 2020
Accepted for publication 8 Jun 2021
Available online 31 Aug 2021
* Corresponding author: mechanicarambharathi77@rediffmail.com

