


Services on Demand
Article
 English (pdf)
 Article in xml format
 Article references
Indicators

Related links
-
 Cited by Google
 -
 Similars in Google
Share

 Permalink
South African Journal of Industrial Engineering
On-line version ISSN 2224-7890
Print version ISSN 1012-277X
S. Afr. J. Ind. Eng. vol.32 n.1 Pretoria May. 2021
http://dx.doi.org/10.7166/32-1-2368
CASE STUDIES
Cost value-stream mapping as a lean assessment tool in a surgical glove manufacturing company
Rajesh Menon B.I, *; P.R. ShalijII; P. SajeeshI; G. TomIII; Pramod V.R.I
IDepartment of Mechanical Engineering, NSS College of Engineering, APJ Abdul Kalam Technological University, India. Rajesh Menon.B: https://orcid.org/0000-0002-0569-5804; P. Sajeesh: https://orcid.org/0000-0002-3728-0718; Pramod V.R.: https://orcid.org/0000-0003-4400-9317
IIDepartment of Production Engineering, Government Engineering College, APJ Abdul Kalam Technological University, India. P.R. Shalij: https://orcid.org/0000-0002-3649-6752
IIISanrea Healthcare Products Private Limited, India. G. Tom: https://orcid.org/0000-0001-6014-1161
ABSTRACT
The development of cost-integrated value-stream mapping (CVSM) as a lean assessment tool for identifying wastage in the production process is presented in this article. In conventional VSM, the time involved in various processes is mapped without tracking the accumulation of direct and indirect costs. In the proposed CVSM, the cost of production is also accounted for, along with the time domain of conventional value-stream mapping. The time investment of the cost is also incorporated in CVSM. Value-added and non-value-added costs can thus be easily recognised in the time scale. This novel method helps to calculate the value addition in monetary terms, and thus the actual production cost of the processes is acknowledged accurately. Since the wastage is quantified in the cost domain, the processes in which lean tools need to be implemented can be identified. The details of establishing CVSM are presented along with a study of its implementation in a glove manufacturing industry.
OPSOMMING
Hierdie artikel bied die ontwikkeling van koste-geïntegreerde waardestroom kartering (CVSM) aan as 'n lenige assesseringstegniek om vermorsing in die vervaardigingsproses te identifiseer. Met konvensionele waardestroom kartering word die tyd benodig vir verskeie prosesse gekarteer sonder om tred te hou van die akkumulasie van direkte en indirekte onkostes. In die voorgestelde CVSM word die koste van produksie ook in ag geneem saam met die tyd domein van konvensionele waardestroom kartering. Die tyd investering van die onkostes is ook in ag geneem. Toegevoegde waarde- en geen-toegevoegde waarde onkostes kan dus maklik verreken word in die tyddomein. Hierdie nuwe metode dra by tot die waarde toevoeging in monetêre terme en bereken dus akkurate, ware produksie onkostes. Omdat vermorsing gekwantifiseer word in die koste domein kan die prosesse waar lenige tegnieke benodig word identifiseer word. Die details om CVSM te vestig word aangebied saam met n gevallestudie in 'n handskoenvervaardigingsnywerheid.
1 INTRODUCTION
Fierce competition in globalised markets necessitates the adoption of manufacturing strategies that help to improve competitiveness. The implementation of lean practices is one such approach to improve the production process. Initiatives from the Toyota production system (TPS), which has since been referred to as 'lean manufacturing', were applied to redesign manufacturing systems to reduce wastages in production and to improve the quality of the product [1]-[3]. The term 'wastage' in an organisation includes extra inventory, defects, inadequate processing, waiting, over-production, unnecessary movements and avoidable transportation. Various lean tools used in this context are quality function deployment, Total Productive Maintenance, Total Quality Management, 5S, Kanban, Kaizen, and Value Stream Mapping [4], [5]. Among all these lean tools, VSM is a pictorial representation of the flow of material and information through the various stages in a system that can be easily understood by both the top management and the workers in an organisation. VSM also includes all the information about the manufacturing process, the suppliers, and the customers to whom the products are distributed [4].
VSM is used as a lean tool in various industries, including automotive [1], [6], camshaft manufacturing [7], plastic products fabrication [8], casting industry [9], pharmaceuticals [10], coffee [11], aircraft [12], construction [13], biodiesel production [14], steel [15], and electronics [16]. Various studies on improving the performance of the service sector, including healthcare [17], education, auditing, service business process [18], supply chain management [19], logistics [20], maintenance services [21]-[23], and government services [24] were also reported in the literature. Although VSM is widely demonstrated in the components assembly based industry, it was reported that VSM can also be applied in the process industrial sector [15]. By implementing VSM, there will be a reduction in total cycle time, total lead time, rejection rate of the product, work in process inventory, and improvement in uptime [25]. With the implementation of lean manufacturing tools using VSM, the efficiency of operations and resources in respect of machines, workers, and inventory can be improved, space utilisation can be made more effective, and thus the financial status of the company can be improved [26].
VSM is difficult to apply when the manufacturing process is complex, with value streams merging in a line and when the production process is dynamic [27]. Traditionally VSM was applied only to linear production systems and systems having a non-variability in data during the processes [28]. Several additions were suggested by researchers to overcome these shortcomings of VSM. VSM has been combined with fuzzy set theory [29] or discrete event simulation (DES) [30] to overcome the limitations of conventional VSM. Improved VSM with simulation can handle complex systems by finding the critical production path using an improved programme evaluation and review technique (PERT) and statistical tools to change the production process [31]. A dynamic modelling system can be used with VSM to enhance the current-state map when the changes required in the process are in line with lean policies and resource requirements [32]. These improved VSM methods identify the wastages associated with the value-addition process, and help to implement the lean manufacturing tools suitable for reducing all categories of waste.
In sustainable value-stream mapping (Sus-VSM), an energy-related matrix is added to VSM to redesign the operation to develop green and sustainable production [33]. Similarly, energy wastes can be mapped in VSM to plot an energy value-stream map (EVSM) to accomplish lean manufacturing [34]. In green modified VSM (GMVSM), time, energy, material, and transportation information between the various production processes is mapped from the perspective of lean tools, and is converted into carbon traces and carbon-efficiency terms to produce the future-state map [35]. In another study, energy and cost matrices are associated with VSM to improve the production process [14]. The effect of combining the VSM with overall equipment effectiveness (OEE) to find the correct approach that can negatively affect the production process is also reported in the literature [36].
Different types of costing practices are adopted by organisations to ascertain the costs incurred in manufacturing and selling products. In traditional methods of costing, the accumulation of direct costs is considered to quantify the cost of the product. The traditional costing method does not account for the support costs, which results in errors when calculating the actual production cost. Although an activity-based costing (ABC) method provides a better costing than traditional costing methods, frequent updating of ABC is not possible. This can lead to an incorrect estimation of product cost.
Value-stream costing (VSC), proposed by Ruiz-de-Arbulo-Lopez [37], helps to identify various costs, including the support cost and those of labour, equipment, facilities, maintenance, and materials. These costs can be displayed as the cost line in traditional VSM. VSC can be implemented in those organisations that have already adopted lean production practices. However VSC is less accurate than other costing systems such as ABC [13], [16]. VSC does not distinguish between direct costs, indirect costs, and costs outside the value streams. In the VSC method, all categories of cost are considered equal, which works well for short-term decision-making. Thus the product cost indicated by the VSC is less accurate than that given by ABC [37]. In another study, VSM is added to the cost deployment (CD) tool to quantify the losses in the current-state map and to rectify these losses in the prioritised process in future-state maps.
A cost-time profile (CTP), as proposed in the literature, helps to calculate the accumulated total cost of the product through time, and finally to evaluate the improvements in the production process after implementing lean tools [38]. It also quantifies the cost-time investment (CTI), which is a measure of the money invested in the manufacturing process and the time required to recover that money through sales. In another literature report, the VSM tool is integrated with the activity costs and target costs to find the cost of the product. The target cost of the product is the cost that can be incurred while earning the proposed profit. Indirect costing owing to the cost of the resources and the cost involved during the work-in-process inventory are not included in these costing methods [39].
In conventional VSM, the time involved in the processes is mapped without tracking the accumulation of direct and indirect costs. Various costing methods and CTP methods are unable to calculate the actual cost of the product. VSM can be modified to account for the cost aspect of production along with the time domain of conventional value-stream mapping. The time investment of cost can also be incorporated into this new method. In CVSM, value-added and non-value-added costs are combined with the time scale. By applying the lean tools as proposed in the future-state map, wastages in production can be minimised. This novel method calculates the value addition in monetary terms, and thus the actual production cost is estimated accurately.
2 PRINCIPLE OF COST-VALUE-STREAM MAP (CVSM)
The methodology adopted for the implementation of a CVSM is described in Figure 1. A team of engineers and managers is formed to implement the CVSM. Data and an on-process flow diagram, information transactions such as sales and purchase forecasts and orders, material flow, and cycle-time waiting time between the process, the uptime, and the number of operators are collected for each process. Various costs - including those for operator, resource, material, machine depreciation, maintenance, and activity - are collected for all the selected activities. A CTP of all the activities is also plotted. Cost-time investment (CTI), which can be used to find the non-value-added cost incurred, is prepared using CTP. Time data from the VSM and CTI data from the CTP are used to plot the current-state CVSM. Along with the time line, the cost line is also presented in the current-state CVSM. Non-value-added activities have to be identified, and the current-state CVSM is modified by applying suitable lean tools. Most of the non-value-added activities are eliminated from the current-state CVSM to get a future-state CVSM. The detailed description of the methodology of CVSM is given in the case study conducted in a hand glove manufacturing industry.

3 MATHEMATICAL MODEL - COST ANALYSIS OF CVSM
In cost analysis, the activity cost rate is the sum of the operator cost rate and the various resource cost rates. The operator cost rate can be found from the annual emoluments given to the employees. While calculating the resource cost rate, the machine depreciation cost and the machine maintenance cost have to be considered. The depreciation cost of individual equipment is calculated by dividing the capital cost of equipment by the total usage time in a year. The maintenance cost is the ratio of the yearly maintenance cost of a machine and the time duration for which the machine is used in a year. The resource cost for each activity is the sum of the depreciation cost rate and the maintenance cost rate of the machines involved in the activity. The activity cost rate can be calculated by adding the resource cost rate to the operator cost rate.

where the subscripts t, and k indicate the various activities, materials, and machines involved in the production. The total activity cost for each activity is thus calculated by multiplying the activity cost rate by the cycle time for each activity.

The total direct cost, accounting for rejection after inspection during each process, is calculated using equation (1).

The indirect cost for a product includes the utility cost and the fixed cost incurred by the organisation. The cost-time profile (CTP) for this product is also plotted. In CTP, the time accumulated for various value-added and non-value-added activities is mapped on the x-axis. The total accumulated cost for both value-added and non-value-added activities is mapped on the y-axis. The measure of the cost for the production and the time period required to recover the investment is termed the 'cost-time investment' (CTI). This is calculated by multiplying the area of the CTP profile by the internal rate of return (IRR). From the plotted CTP, the annual cost-time investment (CTI) can be calculated using equation (2):

where t£and C;are the accumulated time and cost after a process i, as mentioned in the CTP. The subscripts i - 1 and i + 1 denote the process before and the process after process i respectively. From this cost investment, the non-value-added cost for the product can be determined. Finally, the total production cost can be found by adding the direct cost, the indirect cost, and the non-value-added cost.
4 CASE STUDY OF CVSM IN GLOVES MANUFACTURING COMPANY
4.1 Company details
A company manufacturing sterile latex examination gloves situated at KINFRA Integrated Industrial and Textile Park, Palakkad, Kerala, India was selected for the test implementation of the CVSM. This small-scale export-oriented industry was started in 2013 with an initial investment of USD 817,004, with their products and quality standards following ISO13485:2016. This company employs around 116 workers and supervisors and 10 supporting staff. The company works in three shifts of eight hours each and a general shift of eight-and-a-half hours, with a 60-minute unpaid break per day. At present the company produces 150,000 gloves per day. Fierce competition from producers around the world forced the company to reduce its prices to rock-bottom, and it lost its profit margin. This situation made the company think about identifying the wastages in the production flow and taking remedial measures to bring down the non-value-added expenses involved in the production stream line.
4.2 Process flow chart
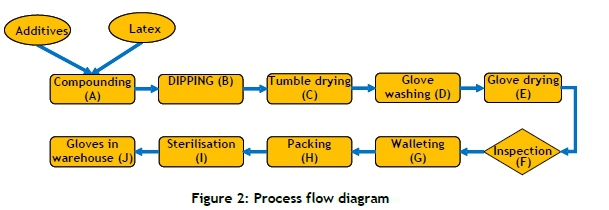
Concentrated latex of 60% DRC is the major raw material for manufacturing the gloves. Chemicals including sulphur, zinc diethyldithiocarbamate and zinc mercaptobenzthiazole, zinc oxide, wingstay L, and potassium hydroxide are added as curing agents, accelerators, activators, antioxidants, and stabilisers respectively to the concentrated latex. The process flow diagram for manufacturing the gloves is shown in Figure 2. As shown, the chemicals are ground in a ball mill before being added to the concentrated latex. This preparation process is called compounding (A). The compound latex is allowed to mature for 60 hours. After maturation, the latex is fed into a coagulant dipping section, where formers are dipped into the latex to make gloves. Calcium nitrate, with a suitable wetting agent, is used as the coagulant bath before dipping the formers into the latex. The latex film over the formers is gelled in an oven, and then the product proceeds to the edge rollers where the film is rolled at the cuff to aid in gripping the gloves during the former donning process. Excess chemicals in the latex film are removed by the pre-curing process called leaching.A vulcanisation process, which cross-links the latex to form the glove, is carried out in an oven. A post-leaching process removes the residual protein in the gloves. These formers with film are then dried in another oven and dipped in corn-starch slurry. On drying, this acts as donning powder for the gloves when they are stripped from the formers. These stages of the process after compounding are termed the dipping and curing processes (B).
The next stage in the manufacturing stage is tumble drying (C), where excess moisture and powder carried by the gloves during the earlier stages are removed. Glove washing (D) and drying (E) with water reduces the surface tackiness of latex, and is done to enable non-sticky wearing of gloves. The G-1 single sampling method is used to inspect (F) the gloves in a lot. After this, one pair of gloves is walleted (G) in paper, 50 such wallets are packed (H) into the inner cartons, and then eight inner cartons are packed into a master carton. Based on customer requirements, the gloves are then sterilised (I) with ethylene oxide before being dispatched (J) to the warehouse.
4.3 Identification of the product
The company manufactures sterilised, beaded examination gloves, both powdered and powder-free, in seven different palm sizes, ranging from 6 to 9 inches, with differences of 0.5 inches between sizes. From the matrix of products, the powder-free 7.5-inch surgical glove was selected for the case study. This product undergoes all the manufacturing processes, and has contributed to major sales revenue over the last 10 years.
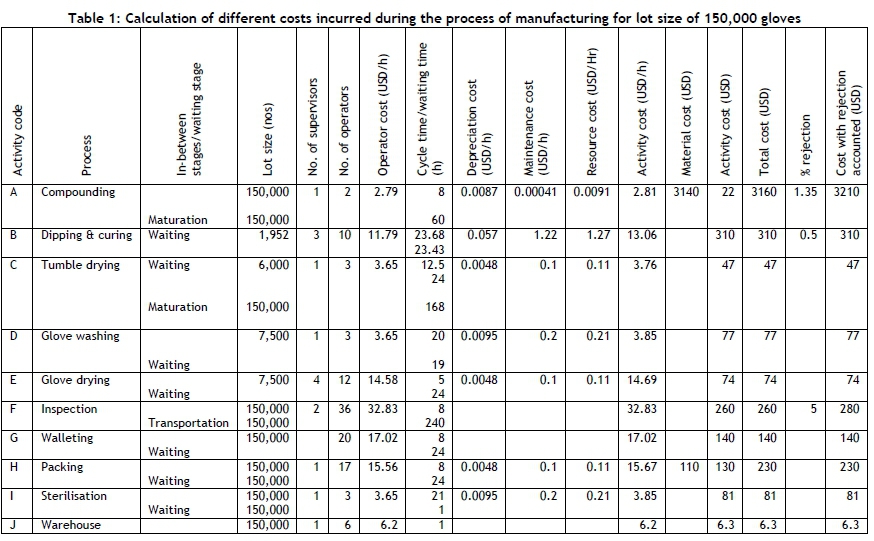
A team comprising the head of operations, the marketing manager, the HR manager, the manager (accounts), the head of quality control, the production supervisor, and the inspection manager was formed to implement the CVSM. Information related to the production parameters - including the lot size for an activity, cycle time, available time, uptime, number of operators and supervisors, distance between work stations, percentage of rejections, and activity and waiting periods for the various production processes from A to J - was recorded by the selected team, and is shown in Table 1. The cycle time, uptime, changeover time, work-in-process inventory, and the number of operators is entered with the corresponding symbols in the prepared VSM, which is shown in Figure 3.

The cost details of the individual operations are calculated and included in the VSM as the next step. The details of the calculations are shown in Table 1. In order to construct the CVSM, the different costs incurred in the time domain need to be established. Thus, the different costs incurred every hour for carrying out the different processes are calculated.
For the total number of 150,000 gloves produced in a three-shift day, the material and packing costs incurred are USD 3,141.37 and USD 106.21 respectively. The hourly costs of the operator and the supervisor are USD 0.85 and USD 1.09 respectively. The depreciation cost of the individual items of equipment is calculated by dividing the capital cost of the equipment by the total usage time in a year. The maintenance cost is the ratio of the yearly maintenance cost of the machine and the time duration for which the machine is used in a year. The resource cost for each process is the sum of the depreciation cost rate and the maintenance cost of the machines involved in the process. The activity cost for the various processes involved is found by adding the resource cost and the operator cost. The total activity cost for each activity from A to J is calculated by multiplying the activity cost by the cycle time for each process. The total direct cost, accounting for rejection after inspection during each process, is calculated using equation (3) (repeated here for continuity):

where the subscripts i, j, and k indicate the various activities, materials, and machines involved in the production. The total direct cost, accounting for the rejection rate, is USD 4,445.87 for a lot size of 150,000 gloves. The indirect cost for each glove has to be included to arrive at the total cost of production. According to the information collected from the company, USD 0.011 and USD 0.0099 are the utility cost and the fixed cost respectively for each glove. The indirect cost for the lot size of 150,000 gloves is USD 3,84.19. So, the total value-added cost for the lot size is USD 7,530.06, with the total manufacturing cost for one glove being USD 0.05.
4.4 Cost analysis for preparing CVSM
In the cost-time profile (CTP), the time accumulated for various value-added and non-value-added activities from A to J is mapped on the x-axis, and the total accumulated cost for both value-added and non-value-added activities is mapped on the y-axis, as shown in Figure 4.
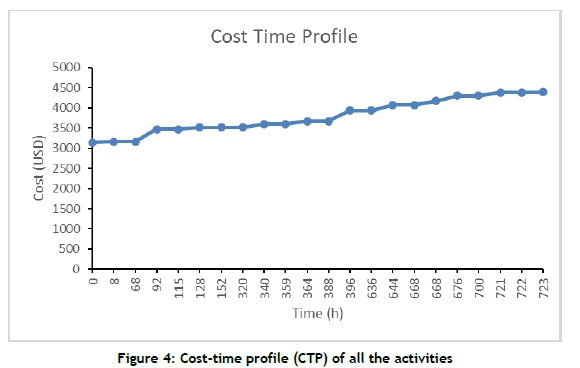
The measure of the cost for the production and the time period required to recover the investment is termed 'cost-time investment' (CTI). This is calculated by multiplying the area of the CTP profile by the internal rate of return (IRR). From the plotted CTP, the annual CTI can be calculated using equation (2):

where ti and Ci are the accumulated time and cost after a process i , as mentioned in the CTP. The subscripts i - 1 and i + 1 denote the process before and and the process after process i respectively. The activity code, the various processes in the CTP, and their area under each process are shown in Table 2. Various processes - including the activities (from A to J), material addition, waiting time for the unprocessed and processed lots, and waiting between the various activities - are mapped in the CTP. The total area of the CTP is 2682528.77 USD hours. In equation (2), IRR is 13.75%, which is determined from the sales and the cost of investments of the company. The cost investment for a daily lot size of 150,000 gloves is USD 4,210.58, which makes an additional non-value-added cost of USD 0.028. This makes the total production cost of each glove USD 0.078.

4.5 Preparation of current-state CVSM
As observed from the current-state VSM, the total lead time for a lot size is 722.62 h. The value-added time for the manufacturing process is only 390.62 h. The current-state CVSM can be plotted by adding the cost of production to the time domain in conventional VSM. The cost line is added below the time line of VSM. Various value-added and non-value-added costs accounted into the CVSM are shown in Figure 5. As explained, the total manufacturing cost, including the direct and indirect value-added cost for one glove, is 0.078 USD. Considering the non-value-added costs, the final production cost of one glove is 0.05 USD.
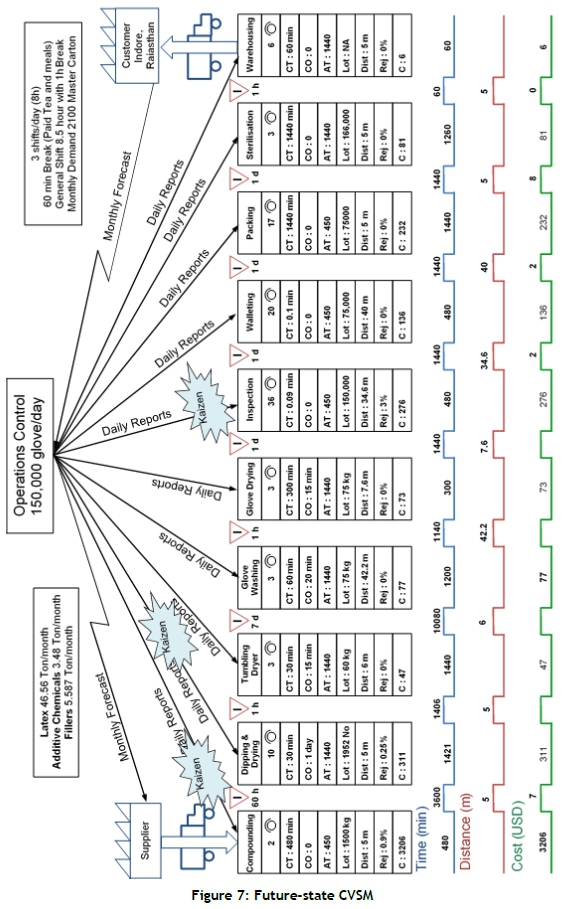
4.6 Preparation of future-state CVSM
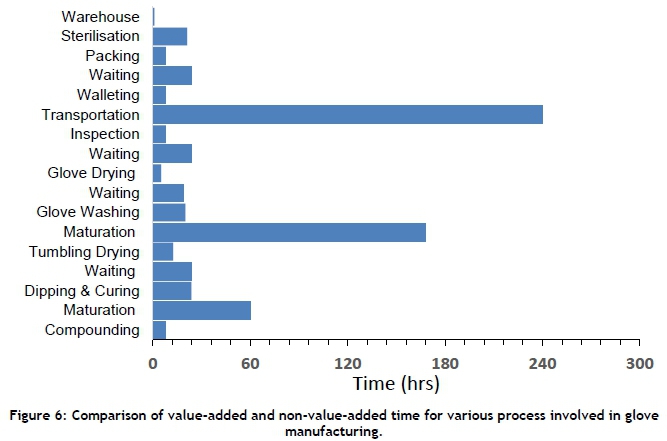
The time required for various value-added and non-value-added activities is shown in Figure 6. Transportation from the manufacturing facility to the walleting and packing facility and the maturation process are the major time-consuming processes, requiring 240 h and 168 h respectively. The maturation process is an inevitable one in glove manufacturing. Introducing 'distance travelled' as a parameter in the traditional VSM, the wastage occurring owing to unwanted transportation can be identified. The processes up to inspection are carried out at a manufacturing facility, and the rest of the operations are completed at another location 150 km away. This forces the company to wait for the completion of an entire truckload of products before transporting them to the packaging facility. This is the major contributor towards the total loss of the company, considering the cost of production. Installing the walleting, packing, and sterilisation facility at the place of manufacture would substantially reduce the cost of production. By installing an in-house walleting and packing facility, the total production cost (including the non-value-added cost) would be 0.068 USD per glove. The initial investment cost required to establish such a facility in the company is USD 74,891.07. This new facility could produce an annual saving of around USD 14,901.96 for the company; so, the payback period for this investment would be nearly five years.
From the current CVSM, the wastages in production in their order of importance and value can be identified. They are (i) rejections at the inspection station, which account for 5%, (ii) reconfiguration of the thermic fluid heater (wood-fired), and (iii) installation of a water recycling system. Some defective products not conforming to the pre-specified quality occur at each processing station. The percentage of rejections is recorded at every processing station in the CVSM.
Measures to reduce rejection at inspection stations are (i) to introduce KAIZEN trials at the dipping and curing stations; (ii) to introduce 5S in the tumble drying, and at washing and inspection; and (iii) to display Standard Operating Procedure at each inspection station. By adopting the above measures, the rejection rate could be reduced to 2.25% from the present 5%. It would be possible to enhance the maximum capacity of the existing company to 175,000 gloves/day from the present 150,000 by enhancing the capacity of the thermic fluid heater. This facility would need an investment of USD 47,657.95. At the same time, it would reduce the production cost for a glove by 25%. Thus, the annual saving to the company would be nearly USD 1,150,939.54.
The production process requires 12,000 l of water every day. Considering the cost of water according to the current commercial rate of water in Kerala for industrial use (USD 544.66/l), it is advisable to have a recycling plant so that a considerable amount of water can be reused, not only because of economic considerations, but also for the sake of sustainability. This facility would have an installation cost of USD 27,233. An estimated annual saving of USD 12,254.90 could be accrued by installing an in-house water recycling plant, with a payback period of two years and three months. After applying the above lean tools, the future-state CVSM is shown in Figure 7.
5 CONCLUSION
An improved method, the cost-value-stream map (CVSM), to address the implementation of lean manufacturing is proposed in this study. This method takes advantage of both VSM and conventional CTP methods. The methodology of CVSM is demonstrated by conducting a case study in a hand-glove manufacturing unit. By constructing the current CVSM, the wastages in production in their order of importance and value are identified. Methods of reducing the manufacturing cost and the manufacturing cycle time are proposed and detailed in the future-state CVSM. This proposed cost-value-stream map helps to identify the major non-value-added activities and their cost investment in an organisation.
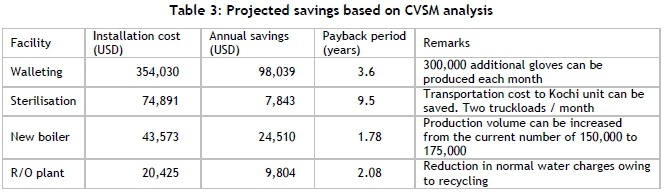
The cost saving derived from the CVSM analysis conducted in this study is summarised in Table 3. The savings and the payback period in each investment are also determined annually.
The CVSM gives a direct opportunity to identify waste in the production line in respect of cost. This enables everyone, irrespective of their hierarchical position in the company, to quantify the wastages in production in cost terms. The identification of 'muda' and the selection of the suitable lean tool to eliminate it is made easy by implementing the CVSM.
REFERENCES
[1] Seth, D. & Gupta, V. 2005. Application of value stream mapping for lean operations and cycle time reduction: An Indian case study. Production Planning and Control, 16(1), pp. 44-59. [ Links ]
[2] Vinodh, S., Somanaathan, M. & Arvind, K.R. 2013. Development of value stream map for achieving leanness in a manufacturing organization. Journal of Engineering, Design and Technology, 11(2), pp. 129-141. [ Links ]
[3] Van der Merwe, J.J. & Pieterse, K.R. 2014. The development of a theoretical lean culture causal framework to support the effective implementation of lean in automotive component manufacturers. The South African Journal of Industrial Engineering, 25(1), pp. 131 -144. [ Links ]
[4] Singh, B., Garg, S.K. & Sharma, S.K. 2011. Value stream mapping: Literature review and implications for Indian industry. International Journal of Advanced Manufacturing Technology, 53(8), pp. 799-809. [ Links ]
[5] Singh, B. & Sharma, S.K. 2009. Value stream mapping as a versatile tool for lean implementation: An Indian case study of a manufacturing firm. Measuring Business Excellence, 13(3), pp. 58-68. [ Links ]
[6] Kumar, S., Dhingra, A.K. & Singh, B. 2018. Process improvement through Lean-Kaizen using value stream map: A case study in India. The International Journal of Advanced Manufacturing Technology, 96(5), pp. 2687-2698. [ Links ]
[7] Vinodh, S., Arvind, K.R. & Somanaathan, M. 2010. Application of value stream mapping in an Indian camshaft manufacturing organisation. Journal of Manufacturing Technology Management, 21(7), pp. 888-900. [ Links ]
[8] Rohac, T. & Januska, M. 2015. Value stream mapping demonstration on real case study. Procedia Engineering, 100(1), pp. 520-529. [ Links ]
[9] Singh, J., Singh, H., Singh, D. & Singh, K. 2017. Evaluating lean thinking using value stream mapping in manufacturing industry: A case study. International Journal of Productivity and Quality Management, 22(1), pp. 101-116. [ Links ]
[10] Chowdary, B.V. & George, D. 2011. Improvement of manufacturing operations at a pharmaceutical company: A lean manufacturing approach. Journal of Manufacturing Technology Management, 23(1), pp. 56-75. [ Links ]
[11] Parthanadee, P. & Buddhakulsomsiri, J. 2014. Production efficiency improvement in batch production system using value stream mapping and simulation: A case study of the roasted and ground coffee industry. Production Planning and Control, 25(5), pp. 425-446. [ Links ]
[12] Luciana, L. & Lestari, Y.D. 2015. Application value stream mapping to minimize waste in aircraft industry. Journal of Business and Management, 4(10), pp. 1119-1131. [ Links ]
[13] Gunduz, M. & Naser, A.F. 2017. Cost based value stream mapping as a sustainable construction tool for underground pipeline construction projects. Sustainability (Switzerland), 9(12), pp. 2184-2204. [ Links ]
[14] Chatterjee, R., Sharma, V., Mukherjee, S. & Kumar, S. 2014. Value stream mapping based on energy and cost system for biodiesel production. International Journal of Sustainable Manufacturing, 3(2), pp. 95-115. [ Links ]
[15] Abdulmalek, F.A. & Rajgopal, J. 2007. Analyzing the benefits of lean manufacturing and value stream mapping via simulation: A process sector case study. International Journal of Production Economics, 107(1), pp. 223-236. [ Links ]
[16] Chiu, M.-C. & Lin, Y.-H. 2016. Industrial management & data systems article information. Industrial Management & Data Systems, 116(2), pp. 322-348. [ Links ]
[17] Teichgräber, U.K. & De Bucourt, M. 2012. Applying value stream mapping techniques to eliminate non-value-added waste for the procurement of endovascular stents. European Journal of Radiology, 81(1), pp. e47-e52. [ Links ]
[18] Stec, M.L. & Emiliani D.J. 2004. Using value-stream maps to improve leadership. Frontiers in Human Neuroscience, 25(8), pp. 662-645. [ Links ]
[19] Suarez-Barraza, M.F., Miguel-Davila, J. & Vasquez-García, C.F. 2016. Supply chain value stream mapping: A new tool of operation management. International Journal of Quality and Reliability Management, 33(4), pp. 518-534. [ Links ]
[20] Villarreal, B. 2012. The transportation value stream map (TVSM). European Journal of Industrial Engineering, 6(2), pp. 216-233. [ Links ]
[21] Stadnicka, D. & Ratnayake, R.M.C. 2017. Enhancing aircraft maintenance services: A VSM based case study. Procedia Engineering, 182, pp. 665-672. [ Links ]
[22] En-Nhaili, A., Meddaoui, A. & Bouami, D. 2015. A new tool for maintenance performance measurement using value stream mapping and time-driven activity-based costing. International Journal of Process Management and Benchmarking, 5(2), pp. 171-193. [ Links ]
[23] Tyagi, S., Choudhary, A., Cai, X. & Yang, K. 2015. Value stream mapping to reduce the lead-time of a product development process. International Journal of Production Economics, 160 pp. 202-212. [ Links ]
[24] Andreadis, E., Garza-Reyes, J.A. & Kumar, V. 2017. Towards a conceptual framework for value stream mapping (VSM) implementation: An investigation of managerial factors. International Journal of Production Research, 55(23), pp. 7073-7095. [ Links ]
[25] Vinodh, S., Arvind, K.R. & Somanaathan, M. 2010. Application of value stream mapping in an Indian camshaft manufacturing organisation. Journal of Manufacturing Technology Management, 21(7), pp. 888-900. [ Links ]
[26] Belokar, R.M., Kharb, S.S. & Kumar, V. 2012. An application of value stream mapping in automobile industry: A case study. International Journal of Innovative Technology and Exploring Engineering, 1 (2), pp. 231 -236. [ Links ]
[27] Braglia, M., Carmignani, G. & Zammori, F. 2006. A new value stream mapping approach for complex production systems. International Journal of Production Research, 44(18-19), pp. 3929-3952. [ Links ]
[28] Braglia, M., Frosolini, M. & Zammori, F. 2009. Uncertainty in value stream mapping analysis. International Journal of Logistics Research and Applications, 12(6), pp. 435-453. [ Links ]
[29] Seyedhosseini, S.M., Taleghani, A.E., Makui, A. & Ghoreyshi, S.M. 2013. Fuzzy value stream mapping in multiple production streams : A case study in a parts manufacturing company. International Journal of Management Science and Engineering Management, 8(1), pp. 37-41. [ Links ]
[30] Schmidtke, D., Heiser, U. & Hinrichsen, O. 2014. A simulation-enhanced value stream mapping approach for optimisation of complex production environments. International Journal of Production Research, 52(20), pp. 61466160. [ Links ]
[31] Andrade, P.F., Pereira, V.G. & Del Conte, E.G. 2016. Value stream mapping and lean simulation: A case study in automotive company. International Journal of Advanced Manufacturing Technology, 85(1-4), pp. 547-555. [ Links ]
[32] Agyapong-Kodua, K., Ajaefobi, J.O. & Weston, R.H. 2009. Modelling dynamic value streams in support of process design and evaluation. International Journal of Computer Integrated Manufacturing, 22(5), pp. 411-427. [ Links ]
[33] Carmignani, G. 2017. Scrap value stream mapping (S-VSM): A new approach to improve the supply scrap management process. International Journal of Production Research, 55(6), pp. 3559-3576. [ Links ]
[34] Rezaeian, J., Parviziomran, I. & Mahdavi, I. 2018. Increasing energy productivity in lean production system with energy oriented value-stream mapping. International Journal of Productivity and Quality Management, 24(4), pp. 495-506. [ Links ]
[35] Zhu, X.Y., Zhang, H. & Jiang, Z.G. 2020. Application of green-modified value stream mapping to integrate and implement lean and green practices: A case study. International Journal of Computer Integrated Manufacturing, 33(7), pp. 716-731. [ Links ]
[36] Dadashnejad, A.A. & Valmohammadi, C. 2019. Investigating the effect of value stream mapping on overall equipment effectiveness: A case study. Total Quality Management and Business Excellence, 30(3-4), pp. 466-482. [ Links ]
[37] Ruiz-de-Arbulo-Lopez, P., Fortuny-Santos, J. & Cuatrecasas-Arbós, L. 2013. Lean manufacturing: Costing the value stream. Industrial Management & Data Systems, 113(5), pp. 647-668. [ Links ]
[38] Rivera, L. & Chen, F.F. 2007. Measuring the impact of Lean tools on the cost-time investment of a product using cost-time profiles. Robotics and Computer-Integrated Manufacturing, 23(6), pp. 684-689. [ Links ]
[39] Seyedhosseini, S.M. & Ebrahimi-Taleghani, A. 2015. A stochastic analysis approach on the cost-time profile for selecting the best future-state map. The South African Journal of Industrial Engineering, 26(1), pp. 267-291. [ Links ]
Submitted by authors 26 May 2020
Accepted for publication 18 Jan 2021
Available online 28 May 2021
* Corresponding author: rajeshmenon@nssce.ac.in

