


Services on Demand
Article
 English (pdf)
 Article in xml format
 Article references
Indicators

Related links
-
 Cited by Google
 -
 Similars in Google
Share

 Permalink
South African Journal of Industrial Engineering
On-line version ISSN 2224-7890
Print version ISSN 1012-277X
S. Afr. J. Ind. Eng. vol.32 n.1 Pretoria May. 2021
http://dx.doi.org/10.7166/32-1-2438
GENERAL ARTICLES
Pre-positioning of a relief chain in humanitarian logistics under uncertainty in road accidents: a real-case study
F. HoseininezhadI, #; A. MakuiII, *; R. Tavakkoli-MoghaddamIII
IDepartment of Industrial Engineering, Science and Research Branch, Islamic Azad University, Tehran, Iran. https://orcid.org/0000-0001-6843-5412
IISchool of Industrial Engineering, Iran University of Science and Technology, Tehran, Iran. https://orcid.org/0000-0001-6249-530X
IIISchool of Industrial Engineering, College of Engineering, University of Tehran, Tehran, Iran. https://orcid.org/0000-0002-6757-926X
ABSTRACT
Road accidents, as one of the causes of mortality in human societies, have many adverse social and economic consequences. Various measures can improve the safety of travel. One of them is to find appropriate location of relief infrastructures. The proper pre-positioning of relief chains locations can decrease road users' fatalities. Thus this paper presents a multi-objective mathematical model to the pre-positioning of a relief chain for road accidents. Then the model is solved by a non-dominated sorting genetic algorithm. Factors that affect the location of relief chains are identified using a multi-attribute decision-making method. Finally, potential locations are proposed for the relief chain locations.
OPSOMMING
Padongelukke is een van die oorsake van dood in die samelewing en het 'n verskeidenheid maatskaplike en ekonomiese gevolge. Verskeie maatstawwe kan padveiligheid verbeter. Een maatstaf is die identifisering van gepaste liggings vir verligtingsinfrastruktuur. Die ordentlike posisionering van verligtingstasies kan die aantal padsterftes verminder. Hierdie artikel bied 'n meerdoelige wiskundige model aan om hierdie liggings vooraf te identifiseer. Die model is opgelos deur 'n nie-gedomineerde sorterings genetiese algoritme. Faktore wat die ligging van verligtingstasie beïnvloed is identifiseer deur 'n multi-eienskap besluitnemingsmetode. Laastens is moontlike liggings vir verligtingstasies voorgestel.
1 INTRODUCTION
Iran is a vast country with different kinds of roads and vehicles. Along with the economic and welfare benefits, the country faces difficulties caused by this volume of traffic, such as an increased number of traffic accidents and their related costs. The safety issues associated with transportation and social responsibility have always been addressed. However, in the two past decades, because of the increase in the number of accidents and their corresponding costs, safety issues have gained more importance. Accidents are one of the great problems that endanger human health worldwide. The injuries caused by these events are so extensive that the siutation is referred to as 'the war on the roads' [1] and is one of the main causes of death and disability in developing countries [2, 3]. According to World Health Organization (WHO) statistics, about 1.35 million people die in road accidents globally every year, and Between 20 and 50 million are injured. [4]. A survey in Iran has shown that road accidents are the primary cause of death in those aged below 40 years [5]. However, no adequate studies have been done on what factors are important in determining suitable locations for a road relief chain.
This paper attempts to locate a relief chain on the arterial road network in Semnan province, such that the responsible organisations (as beneficiaries of government) can help with accident injuries at the least cost and in the shortest time. To do this, the appropriate factors are selected by experts. What is considered is that injured people (as beneficiaries of society) want relief hubs to serve them with the maximum capacity. This makes the deviation of existing capacity and budgets inevitable; but the model tries to minimise this deviation. Thus a model is developed to represent the requirements of the government and the needs of road users as those who experience road accidents. Finally, data from Semnan province are entered into the model, and the potential location of a relief chain is suggested.
2 LITERATURE REVIEW
The location of a relief chain is one of the new issues that have become prominent in the context of location problems in recent decades. Natural and unnatural disasters occur in different parts of the world every year. Since disasters are increasing for several reasons (e.g., population growth, climate change, and the widespread use of mechanisation), it is predicted that existing relief measures may not be sufficient [6]. On the other hand, the nature of the disasters is such that they must be responded to quickly, and responders must transfer injured people from affected areas to predetermined centres [7]. The unpredictable nature of disasters make it necessary to provide comprehensive plans to reduce the danger of the events. One effective measure to reduce delays is to pre-position and store relief facilities near to an affected region. Pre-positioning facilities not only leads to a more rapid response, but also gives rise to better and more sustainable planning and lower associated costs. For these reasons the issue has been addressed by disaster management researchers.
Akkihal [7] proposed a model for locating a disaster management warehouse to manage the distribution of relief goods. Balcik and Beamon [8] proposed a location model to identify the optimal location, the capacity of relief centres, and the time needed to provide relief. This model considered budget constraints before and after a disaster. Brotcorne, Laporte and Semet [9] categorised location models for ambulances and other emergency vehicles into three groups (i.e., deterministic, stochastic, and dynamic models). Ukkusuri and Yushimito [10] created a model to select the best locations so that the ability of demand points to be in touch when a transportation network was disrupted was maximised. Salmeron and Apte [11] considered the budget allocation for the location of a relief chain, and developed a two-stage stochastic model.
Considering the different types of emergencies and their corresponding relief requirements, Duran, Gutierrez and Keskinocak [12] proposed a model to evaluate the effect of pre-positioning on a relief organisation's average emergency reaction time. Their model considered the constraints of capacity, supply, demand, and number of warehouses. Doyen, Aras and Barbarosoglu [13] proposed two-step two-level stochastic programming, in which decisions are made about the location of local and regional relief centres. Bozorgi-Amiri, Jabalameli and Al-e-Hashem [14] proposed a two-stage stochastic multi-objective method for a relief logistics network to identify the location of relief centres and the assignment of relief goods, considering specified constraints. Rezaei-Malek and Tavakkoli-Moghaddam [15] presented a two-objective mathematical model for network design by simultaneously minimising the response time and the total cost. By identifying the urban areas against the earthquake based on the results of loss estimation of risk evaluation software, Barzinpour and Esmaeili [16] contributed to literature of this context
Ahmadi, Seifi and Tootooni [17] presented a two-stage multi-depot location-routing model that considered travel times, different applications of vehicles, and standard relief time. Rezaei-Malek, Tavakkoli-Moghaddam, Zahiri and Bozorgi-Amiri [18] proposed a multi-objective mathematical model to design a relief logistics network. Caunhye, Zhang, Li and Nie [19] proposed a two-stage location-routing model with capacity for integrated preparedness and response planning under uncertainty for pre-positioning and distributing emergency supplies. Bai [20] presented a new class of a fuzzy pre-positioning emergency supplies model for a three-echelon humanitarian logistics network, in which the post-disaster acquisition and transportation costs, the suppliers' supply, and the affected areas' requirements were uncertain. Tavana et al. [21] proposed a humanitarian logistics network that considered the inventory of perishable products in the pre-disaster phase and routing relief vehicles in the post-disaster phase.
Gharib, Bozorgi-Amiri, Tavakkoli-Moghaddam and Najafi [22] considered relief distribution and emergency transportation using a three-stage approach. In the first stage, pre-processing of model inputs was done through an artificial neural fuzzy inference system, followed by investigating the safest route for each cluster. In the second stage, a heterogeneous multi-depots multi-mode vehicle routing problem was formulated. Finally, two multi-objective meta-heuristic algorithms were proposed to obtain a near-optimal solution. Veysmoradi, Vahdani, Sartangi and Mousavi [23] investigated the response phase in the management of natural disasters, and offered a mixed-integer nonlinear open location-routing model in conditions of uncertainty.
Bai, Gao and Liu [24] studied the pre-positioning problem by using a robust parametric optimisation method. The transportation cost, supply, demand, and capacity are unknown before the extraordinary event, which is represented as fuzzy parameters with variable possibility distributions. Torabi, Shokr, Tofighi and Heydari [25] proposed a novel two-stage scenario-based mixed fuzzy-stochastic programming model for integrated relief pre-positioning and procurement planning, based on a Quantity-flexiblecontract under a mixture of uncertain data. Chen, Liang and Yao [26] considered a relief agent that required stockpiling multiple products for responding to multiple potential disaster events. By employing the multi-product newsvendor approach, they established a storage model for multiple relief materials. Velasquez, Mayorga and Cruz [27] developed a multi-agency pre-positioning model under uncertainty, in which the pre-positioning strategy developed by a major aid agency or a local government considered sharing resources with other aid agencies. The proposed model considered multiple relief item types, storage capacity, and budgetary and equity constraints while integrating supplier selection, inventory, and facility location decisions. Uncertainty was modelled using robust optimisation.
Aslan and Celik [28] focused on the design of a multi-echelon humanitarian response network, in which the pre-disaster decisions of warehouse location and item pre-positioning were subject to uncertainties in relief item demand and the vulnerability of roads and facilities following the disaster. Once the disaster strikes, relief transportation is accompanied by the repair of blocked roads, which delays the transportation process, but gradually increases the connectivity of the network at the same time. A two-stage stochastic programming model was formulated for this system, and a sample average approximation scheme was proposed for its heuristic solution. Hosseininezhad, Makui and Tavakkoli-Moghaddam [29] presented a model for pre-positioning a relief chain based on the needs of road users, in which minimising the transfer time and maximising the capacity of relief centres were considered to be what road users would need.
Boonmee and Kasemset [30] proposed a multi-objective fuzzy mathematical programming model for humanitarian relief logistics. They presented an integrated facility location problem, an inventory problem, and a distribution problem in humanitarian relief logistics when considering the inherent uncertainty of the input parameters. Sharifi-Sedeh et al. [31] showed that a wide range of personal, managerial, professional, structural, environmental, and sociopolitical factors can affect the pre-positioning of relief items. Uncertainties about disasters, shortages of human, financial, and structural resources, lack of inter-organisational agreements and collaboration, lack of clear protocols and guidelines and, most importantly, lack of thorough risk assessment studies were among the main factors behind pre-positioning the relief items.
In the logistics literature, different methods address multi-objective mathematical models such as stochastic programming or fuzzy-based methods. There are two basic drawbacks of stochastic optimisation. 1) In many real problems, there is insufficient historical data for the uncertain parameters; thus the true and real distribution of the undetermined parameters can rarely be specified. 2) In most previous work in the context of relief logistics, the uncertainty of the parameters was modelled by scenario-based stochastic programming. Here, the large number of scenarios for explaining the uncertainty can result in computational problems and challenges [32]. As an alternative, the fuzzy set theory can provide a framework to capture different types of uncertainties, including uncertainty in fuzzy coefficients owing to a shortage of knowledge, along with flexibility in constraints and objectives. This theory can formulate many of the concepts, variables, and systems that are uncertain and vague, and provide background for reasoning, inference, control, and decision-making under uncertainty. In systems with a high degree of uncertainty and complexity, fuzzy logic is a suitable approach modelling [33].
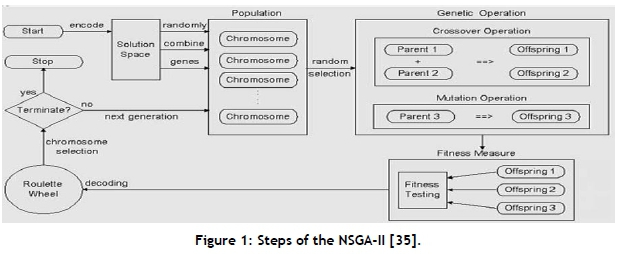
Facility location has an NP-hard nature. For this reason, meta-heuristic algorithms apply for tackling these problems. A genetic algorithm (GA) is one of the earliest methods of meta-modelling based on modelling natural behavior. The non-dominated sorting genetic algorithm (NSGA-II) is a common method for solving multi-objective problems based on genetic algorithms. This algorithm is an efficient way to solve problems with several objective functions, but it also has weaknesses. For this reason, a modified method called NSGA-II is developed. This method works better than the original NSGA-II, and it is one of the most popular multi-objective optimisation algorithms with three special characteristics: a fast non-dominated sorting approach, a fast crowded distance estimation procedure, and a simple crowded comparison operator [34].
Figure 1 shows the main steps of NSGA-II. The NSGA-II starts with the initialisation step, in which an initial population is generated. After this step, obtained solutions are improved using crossover and mutation operators. Then a fitness function is calculated as a critical and important factor in evolutionary algorithms [35].
3 PROPOSED METHOD
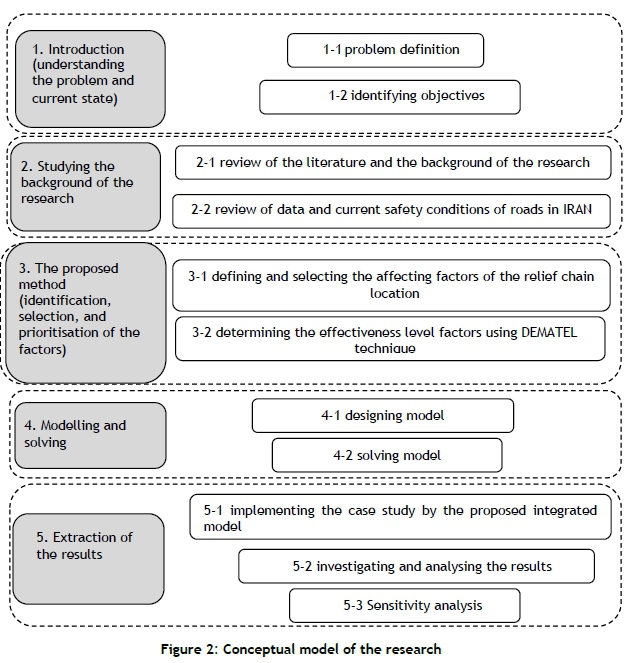
After explaining the current state, a review of the literature and the background of the research have been presented. As mentioned, Hosseininezhad et al. [29] presented a model for pre-positioning a relief chain based on the needs of road users, in which minimising the transferring time and maximising the capacity of relief centres were considered to be what road users would need. They considered the transferring time as a fuzzy uncertainty. However, their proposed model considered only the needs of road users, while - in addition to the needs of road users - government requirements for the construction and development of these sites also need to be considered. For this reason, we attempt to develop that model according to the requirements of both the government and road users. Then the models are solved and their results are presented. The steps taken in five main phases are shown in the conceptual model (Figure 2).
3.1 Defining and selecting the factors that affect relief chain location
First, by reviewing the related literature, fairly complete information is collected on the nature of the activity. To extract the factors that affect relief chain location in the arterial network in Semnan Province, interviews are carried out with experts on safety issues. Then, by combining the results of the interviews, the literature review, and the characteristics of the investigated area, the factors that affect relief chain location are identified. This section will be fully described in Section 5.
3.2 Determining the effectiveness factors using the DEMATEL method
After selecting the factors, it is required to prioritise them and to identify the degree of their effectiveness. In these methods, using the decision-makers' knowledge, the current factors are compared and prioritised according to a decision-making method. In this research, because of the impact of the factors on each other, the DEMATEL method is used to identify the importance of each factor. In Section 5, a table presents the weights of the factors affecting the location of relief chains.
4 MODELLING AND SOLVING METHOD
By using the knowledge acquired in the previous phases, in Phase 4 a model is presented with which the potential location of relief chains in the arterial network in Semnan Province can be suggested. Using this model, the organisations responsible for road relief, as beneficiaries of government, can help the injured at the least cost and in the quickest time by using different transportation modes and, by immediately transferring victims, reduce possible losses.
4.1 Designing the integrated model
In this section, the sets applied in this model are described first. Then the input parameters of the model are outlined and its variables are explained. Finally, the model is presented.
Sets of indices:
N: Set of demand points (n=1, N)
H: Set of points at which relief chains can be located (h=1, H)
G: Set of points considered as urban hospitals (g=1, G)
S: Set of transportation modes (s=1, S)
K: Set of factors affecting the location of relief chains (k=1, K)
Parameters:
On: Capacity of the location of relief chain h to accept injured people
Vg: Capacity to accept injured people at urban hospital g
Ph: Construction cost of the location of relief chain h
Cihs: Transferring cost of injured person i to the location of relief chain h using the transportation mode s
C'hgs: Transferring cost of injured from the location of relief chain h to urban hospital g using transportation mode s
tihs : Transferring time of injured person i to the location of relief chain h using transportation mode s
t'hgs : Transferring time of injured from the location of relief chain h to urban hospital g using transportation mode s
B: Maximum available budget to establish the location of relief chains
Wg: Penalty for deviation from the capacity of urban hospital g
Wb: Penalty for deviation from the budget
Γ k'- Impact rate of factor k
Rkh'- Impact of factor k for the location of relief chain h
Variables:
xihs: 1 if injured person i is transferred to the location of relief chain h by transportation mode s, 0; otherwise
Lh: 1 if the h location is selected, 0; otherwise
Zihgs: 1 if relief chain h transfers injured person i to urban hospital g by transportation mode s, 0; otherwise
yi: 1 if injury i is an emergency, 0; otherwise
Sg: Amount of deviation from the capacity of urban hospital g
Sb: Amount of deviation from the budget
Mathematical model:
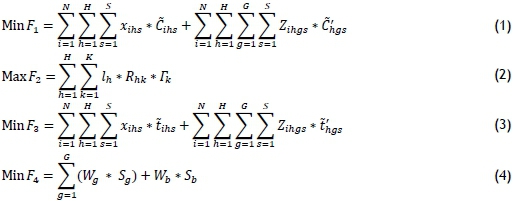
Subject to


Since the cost of transferring injured people is uncertain, and if injured person i is an emergency case, the relief chain should transfer them to an urban hospital, objective function (1) tries to reduce the cost of transferring injured person i from the location of relief chain h and the cost of transferring injured person i from the location of relief chain h to urban hospital g using the transportation modes. Objective function (2) attempts to maximise the impact of factor k on the location of relief chain h. It has already been argued that affecting factors must be taken into account by the responsible organisations (e.g., government beneficiaries) to determine the proper location of the road relief chain. Like objective function (1) - that is, if injured person i is an emergency case, the relief chain should transfer them to the urban hospital - objective function (3) tries to reduce the time of transferring injured person i from the location of relief chain h and the time of transferring injured person i from the location of relief chain h to urban hospital g using the transportation modes. The time needed to transfer the injured people is uncertain. Objective function (4) intends to control the deviation of the capacity of urban hospital g and the budget to establish the location of relief chains. (See Hosseininezhad et al. [29] for more details about objective functions (3) and (4).)
Constraint (5) shows that the injured person i can be transferred only to one relief chain location. Constraint (6) implies that the injured person i go from relief chain location h to urban hospital g only if injured person i is an emergency case. Constraint (7) ensures that injured person i goes from relief chain location h to urban hospital g if relief chain location h is open. Constraint (8) identifies that the sum of the fixed cost of establishing the relief chain location cannot exceed the available budget and its deviation. Constraint (9) is about the number of injured people who are transferred to a relief chain location, which must be less than its capacity. Constraint (10) accepts injured people up to the capacity of the hospital and its deviation. Constraints (11) to (14) identify the types of variable.
4.2 Solving the proposed model
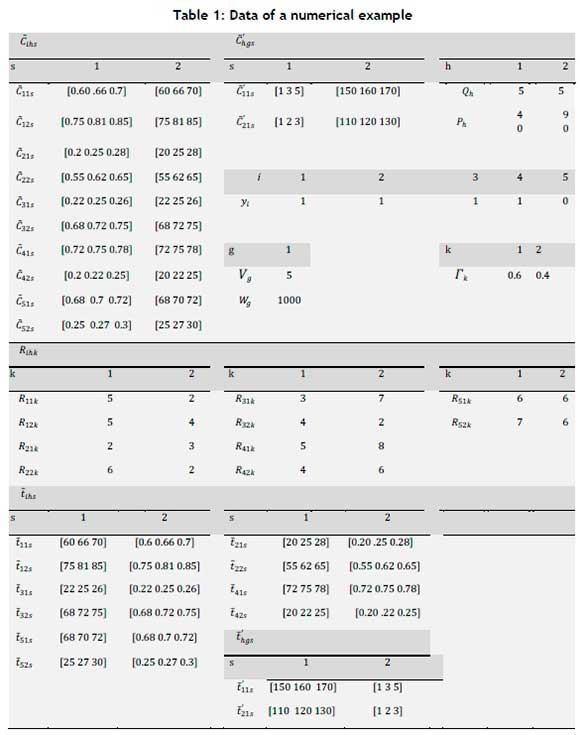
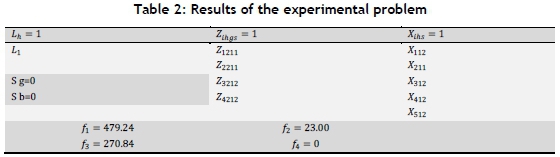
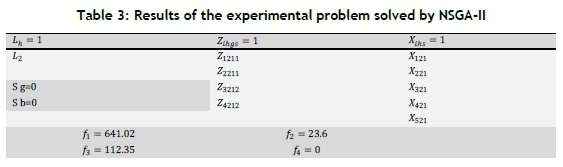
To solve the model, a numerical example, presented in Table 1, is first solved using mathematical optimisation software and NSGA-II. This problem has five points: the location of the injured, two relief chain locations, one urban hospital, two modes of transferring injured people, and two effective location factors. Also, the maximum value of the budget (B) for constructing relief chain locations is set to 100, and the penalty for a deviation from the budget is set as Wb = 500. The problem is solved using the branch-and-cut method, and the results are shown in Table 2. Then the model is solved by NSGA-II, whose results are shown in Table 3. The outputs of mathematical optimisation and NSGA-II are non-dominated relative to each other, and so have no superiority one over the other. That is, the decision-maker can select either solution.
In this study, the initial solution of NSGA-II is expressed as a numerical string. Figure 3 shows the chromosomes of this problem. In this case, we have the following descriptions: the first chromosome, which has two rows, indicates which injured person is transferred to which of the relief chains. The length of this chromosome is the same as the number of injured people. The second chromosome, which has two rows, represents the injured people transferred from a relief chain to an urban hospital with a length that is equal to the number of relief chain locations. Based on the current population, the next population is obtained through selection, crossover, and mutation operators. The selection operator, using the tournament strategy, selects items that have the potential to move from the current population. First, two members of the population are randomly selected, and then, if the rank of the two members selected is not the same, the member with the lowest rank wins; otherwise, the member with the largest distance is selected.

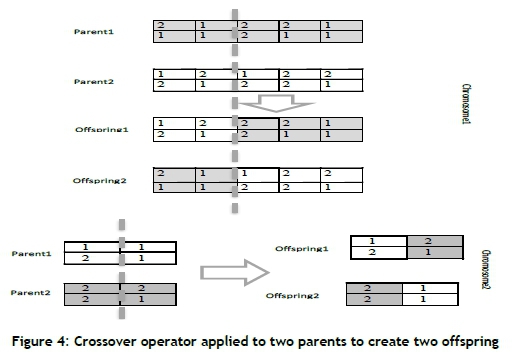
The crossover operator is then applied to either the first or the second chromosome or to both parents. Therefore three strategies are considered; and for this purpose, a random number from 1 to 3 is considered. Now, if the random number is 1, the crossover operator is done on the first chromosome; and if the random number is 2, the crossover operator is done on the second chromosome; and if the random number is 3, the crossover operation is done separately on both chromosomes (Figure 4). The mutation occurs on the first chromosome when the random number 1 is selected, and on the second chromosome when the random number is 2, and mutations occur in both chromosomes if the random number is 3. That is, after the chromosome is selected for the mutation, a random number is selected between the upper and lower bounds, and then the replacement is performed (Figure 5).

In small issues, the outputs of mathematical optimisation and NSGA-II are non-dominated relative to each other. Consequently, there is no superiority of one over the other. That is, the decision-maker can select either solution. However, in the larger problem, the exact solution fails to reach the Pareto-optimal solutions in a reasonable time, while NSGA-II can easily obtain the Pareto-optimal solutions.
5 RESULTS
It has been mentioned that factors that are important to government beneficiaries need to be considered in the model design. According to Sections 3-1 and 3-2, the factors of the government beneficiaries are obtained from interviews with experts and inserted into the model. One of the important steps of the location model is to determine the factors that affect the location. Since the conditions of the location problem are different for various objectives, a particular method cannot be defined to specify the factors. In this paper, by using interviews with specialists and literature review, the factors affecting the location are identified. According to the specialists, the length of the road, the volume of traffic , the number of accidents, the number of victims, the response time, the intensity of accidents, the number of events, the volume of traffic, the population, budget limitations, construction and maintenance costs, service level improvement, low operating costs, reduction of the general travel cost, crossing residential areas, crossing tourist areas, not crossing environmental zones, membership in transit and international roads, land acquisition, and ideal access to other roads that are covered are factors that affect the location of relief chain on the roads.
Based on our survey, we extract 'safety' factors, including the distance from intersections, the distance from curves and U-turn points, distance from the technical buildings of roads, allowable gradients and the existence of residential centres; the factor of 'infrastructural facilities', including power transmission lines, water supplies, gas and oil supply stations, telecom lines, and rest areas; the 'land usage and production value' factor, including residential usage or industrial usage, and high production value land (items such as farms, gardens, forests).
Table 4 shows the final factors, with their abbreviations, used to choose the relief chain locations in the arterial road network. At this stage, road safety managers are consulted about the factors collected from literature reviews and the opinions of experts, and the approved factors are selected as the final factors. After finalising the evaluation factors, a matrix corresponding to Table 5 is designed, and the experts are asked to rate the impact of each criterion on the others, as shown in Table 6. A simple average of the opinions is used, and the direct relation matrix M is formed, as shown in Table 7.


Then the relative intensity matrix that exists among the direct relationships of matrix axM is used to normalise the direct relation matrix. To do this, the sums of all the rows and columns are calculated, and then the inverse of the highest element in each row and column is multiplied by all the elements of the matrix to get the mutual relation matrix. Tables 8 and 9 show the stages of calculating of the relative ratio of indirect relationships.

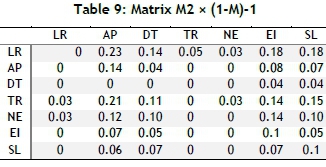
Figure 7 shows a diagram of the relative ratio of indirect relationships. According to this figure, the factors 'number of accident points', 'service level', and 'existence of infrastructure' have a self-loop, and these factors affect themselves. Also, the factor 'number of accidental points' does not directly affect the factor 'existence of infrastructure'; however, there is an indirect relationship with a relative intensity of 0.14. Also, there is no direct relationship with 'existence of infrastructure', but the indirect relationship has a relative intensity of 0.04.

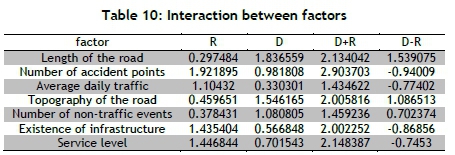
The sum of the elements of column D for each factor identifies the effect of that factor on the others. The sum of the elements of column R for each factor identifies the rate of being influenced by other factors. Column D-R represents the position of a factor along the width of the latitudes in the final hierarchy of direct and indirect relationships. In this situation, if the element of column D-R is positive, it is an effective factor; and if it is negative, it is an influential factor. The value of column D+R also indicates the interaction between the factors. When the sum of column D+R is higher, that factor has more interaction with and effect on the other factor, which includes the effect and influence of that factor. The contribution of each factor is shown in Table 11.

5.1 Implementation of the proposed integrated model
At this stage, the data for Semnan Province are extracted from the Road and Transportation Organization database. The exact time and cost data of transferring the injured people are not available, so the data is fuzzily entered into the model. As mentioned earlier, since budget constraints are among the limitations of this model, the researcher has attempted to incorporate existing roadside facilities as potential locations because they have a primary infrastructure. Thus there are 27 potential locations along the road from which to select the most appropriate locations. The number of accident points is 54, and the number of urban hospitals is six. The cost of construction, the required capacity of the relief chain location, and the capacity of the urban hospital are selected and entered into the model ,based on the previous experience of the experts. Finally, the proposed model is solved using the real data from Semnan Province, using NSGA-II; and, according to Table 6, points 2, 3, 4, 6, 7, 10, 12, 13, 14, 17, 18, 20, 23, 24 and 26 are proposed to become the locations of the relief chain (Table 12).

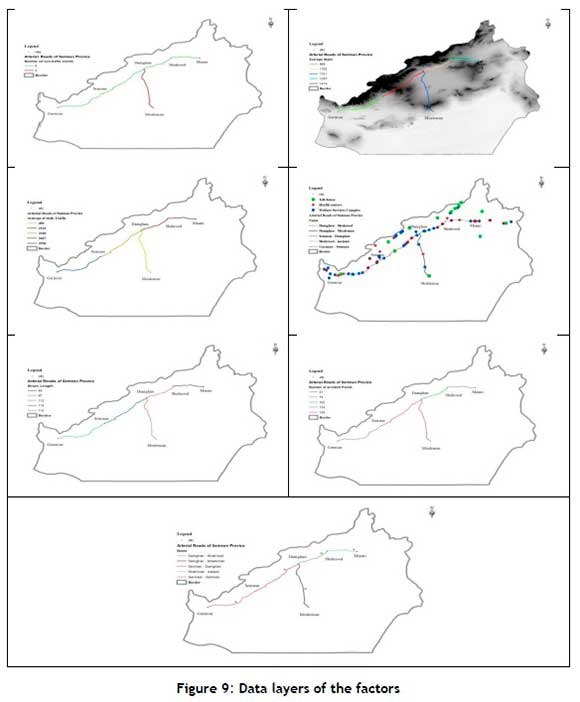
5.2 Results validated by using GIS software
To validate the results of the model, GIS software is used, and the data layers of the factors are prepared. The study area of this research was arterial roads in Semnan Province that are longer than 60 km. Therefore the roads studied in Semnan Province are the Garmsar-Semnan road, the Semnan-Damghan road, the Damghan-Shahroud road, the Shahroud-Miami road, and the Damghan-Moaleman road. Figure 9 shows the layers of some of the factors. Then, by combining the data layers for each factor, the priority of the roads is determined. As shown in Figure 10, the Semnan-Damghan road has the highest priority in establishing a relief chain; the Damghan-Moaleman road has second priority, followed by the Garmsar-Semnan road, the Damghan-Shahrood road, and the Shahrood-Miami road in third to fifth places respectively. With a maximum of 20 minutes to reach each relief station, and an average speed of 75 km/h for all roads, the distance of 25 km from the cities is excluded from the selected research area. Thus Figure 11 is a set of suggested focus points for locating relief chains.


A comparison of the results of the model with the results of the GIS show that 85% of the points are the same.
5.3 Sensitivity analysis
To determine how some independent variables impact the output of the model, a sensitivity analysis is used. Figure 12 shows the sensitivity analysis of the capacity of relief chain (Qh). As shown in this figure, the second and fourth functions (F1 and F4) are constant as the capacity of relief chain (Qh). changes. But the third function (F3) increases, and the first function (F1) decreases. Figure 13 shows the sensitivity analysis of the capacity of urban hospital (Vg). This figure shows that the second function (F2) is constant as the capacity of urban hospital (Vg) changes. However, the first function (F1) increases, and the third and fourth functions (F3 and F4) decrease. Changes in the fourth function (F4) show that, if the capacity of the hospital increases, the penalty for deviation from the capacity of urban hospital (Vg) moves to zero.

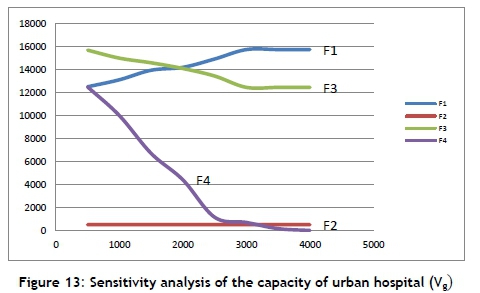
Figure 14 shows the sensitivity analysis of the budget to establish relief chains (B). This figure shows that the second and third functions (F2 and F3) are constant as the penalty for deviation from the budget changes. However, the first and fourth functions (F1 and F4) decrease. Changes in the fourth function (F4) show that, if the budget to establish relief chains increases, the penalty for deviation from the budget moves to zero.

6 CONCLUSION
Road accidents are among the unnatural (man-made) disasters that human societies face as the use of car expands. The destructive effects of road accidents on the economy, society, and people's health have made it a serious disaster. Various measures can be taken to manage the disaster caused by road accidents and to reduce the resulting casualties. This article has attempted to consider the pre-positioning of a relief chain as a strategy for disaster management in the face of road accidents in Semnan Province. Thus a multi-objective model with different modes of transportation was provided. The explored objectives were: i) minimising transferring costs, ii) maximising the value of the factor of the relief chain location, iii) minimising the transferring time, and iv) maximising the penalty to control the deviation of capacity and budget. These objectives conflict with one another. Also, the model is nonlinear; and by increasing the problem sizes, the computational time to solve the model increases exponentially and makes this problem hard. Thus solving these problems using an optimal solution is not possible. The population-based approach of the NSGA-II algorithm makes it very suitable for multi-objective problems; so that this method was used to solve the model ;and the uncertainty of transferring time and its cost was also considered using a fuzzy approach.
Government stakeholder reviews in the field of road traffic accidents, designing effective factors for relief chain locations based on interviews with experts, using the DEMATEL method to measure the factors' contribution, applying the factors in solving the model, and finally validating the model by using GIS software - these were the innovative aspects of this research. In this paper, the length of the road being considered, the number of accident points, the average daily traffic, the topography of the road, the number of non-traffic events, the existence of infrastructure, and levels of service were the factors identified by experts in the field of safety. Then the impact of each of them was calculated and applied in solving the model.
This paper studied the arterial roads of Semnan Province. Future research could address this issue on a larger scale, focusing on all the roads in the country. The best combination of transportation systems and relief equipment could also be explored in future research. Measuring the risk of transferring injured people from the location of an accident to the relief chain's location and, if needed, relocating the injured from the relief chain to an urban hospital, and investigating risk reduction strategies could be the ways to continue this research. A fine might also be imposed to change the mode of transport and so reduce the likelihood of road accident injuries.
REFERENCES
[1] Monsef, V., and Asadi, P. 2015. Mortality due to road traffic injuries in Guilan province in 2011-2012. Safety Promotion and Injury Prevention, 3(2), 97-102. [ Links ]
[2] Murray, C.J., and Lopez, A. D. 1997. Global mortality, disability, and the contribution of risk factors: Global burden of disease study. The Lancet, 349(9063), 1436-1442. [ Links ]
[3] Mobaleghy, M., and Molanaie, N. 2002. Deaths from motor vehicle crashes in patients admitted to hospital accident in 2001 in Sanandaj. Sci J Kurdistan Univ Med Sci 2002; 20 (5): 60-5. Text in Persian [ Links ]
[4] World Health Organization. (2018). Global status report on road safety 2018: Summary (No. WHO/NMH/NVI/18.20). World Health Organization. [ Links ]
[5] Akbari, M.E., Naghavi, M., and Soori, H. 2006. Epidemiology of deaths from injuries in the Islamic Republic of Iran. Eastern Mediterranean Health Journal, 12(3/4), 382-390. [ Links ]
[6] Aslanzadeh, M., Rostami, E. A., and Kardar, L. 2009. Logistics management and SCM in disasters. In Supply chain and logistics in national, international and governmental environment (pp. 221-252). Physica-Verlag HD. [ Links ]
[7] Akkihal, A.R. 2006. Inventory prepositioning for humanitarian operations. Doctoral dissertation, Massachusetts Institute of Technology. [ Links ]
[8] Balcik, B., and Beamon, B.M. 2008. Facility location in humanitarian relief. International Journal of Logistics, 11(2), 101-121. [ Links ]
[9] Brotcorne, L., Laporte, G., and Semet, F. 2003. Ambulance location and relocation models. European Journal of Operational Research, 147(3), 451-463. [ Links ]
[10] Ukkusuri, S., and Yushimito, W. 2008. Location routing approach for the humanitarian prepositioning problem. Transportation Research Record: Journal of the Transportation Research Board, (2089), 18-25. [ Links ]
[11] Salmerón, J., and Apte, A. 2010. Stochastic optimization for natural disaster asset prepositioning. Production and Operations Management, 19(5), 561-574. [ Links ]
[12] Duran, S., Gutierrez, M.A., and Keskinocak, P. 2011. Prepositioning of emergency items for CARE international. Interfaces, 41(3), 223-237. [ Links ]
[13] Doyen, A., Aras, N., and Barbarosoglu, G. 2012. A two-echelon stochastic facility location model for humanitarian relief logistics. Optimization Letters, 6(6), 1123-1145. [ Links ]
[14] Bozorgi-Amiri, A., Jabalameli, M.S., and Al-e-Hashem, S.M. 2013. A multi-objective robust stochastic programming model for disaster relief logistics under uncertainty. OR Spectrum, 35(4), 905-933. [ Links ]
[15] Rezaei-Malek, M., and Tavakkoli-Moghaddam, R. 2014. Robust humanitarian relief logistics network planning. Uncertain Supply Chain Management, 2(2), 73-96. [ Links ]
[16] Barzinpour, F., and Esmaeili, V. 2014. A multi-objective relief chain location distribution model for urban disaster management. The International Journal of Advanced Manufacturing Technology, 70(5-8), 1291-1302. [ Links ]
[17] Ahmadi, M., Seifi, A., and Tootooni, B. 2015. A humanitarian logistics model for disaster relief operation considering network failure and standard relief time: A case study on San Francisco district. Transportation Research Part E: Logistics and Transportation Review, 75, 145-163. [ Links ]
[18] Rezaei-Malek, M., Tavakkoli-Moghaddam, R., Zahiri, B., and Bozorgi-Amiri, A. 2016. An interactive approach for designing a robust disaster relief logistics network with perishable commodities. Computers and Industrial Engineering, 94, 201-215. [ Links ]
[19] Caunhye, A.M., Zhang, Y., Li, M., and Nie, X. 2016. A location-routing model for prepositioning and distributing emergency supplies. Transportation Research Part E: Logistics and Transportation Rreview, 90, 161-176. [ Links ]
[20] Bai, X. 2016. Optimal decisions for prepositioning emergency supplies problem with type-2 fuzzy variables. Discrete Dynamics in Nature and Society, 2016, 1-17. [ Links ]
[21] Tavana, M., Abtahi, A.R., Di Caprio, D., Hashemi, R., and Yousefi-Zenouz, R. 2018. An integrated location-inventory-routing humanitarian supply chain network with pre-and post-disaster management considerations. Socio-Economic Planning Sciences, 64, 21-37. [ Links ]
[22] Gharib, Z., Bozorgi-Amiri, A., Tavakkoli-Moghaddam, R., and Najafi, E. 2018. A cluster-based emergency vehicle routing problem in disaster with reliability. Scientia Iranica: Transaction E, Industrial Engineering, 25(4), 23122330. [ Links ]
[23] Veysmoradi, D., Vahdani, B., Sartangi, M.F., and Mousavi, S.M. 2018. Multi-objective open location-routing model for relief distribution networks with split delivery and multi-mode transportation under uncertainty. Scientia Iranica: Transaction E, Industrial Engineering, 25(6), 3635-3653. [ Links ]
[24] Bai, X., Gao, J., and Liu, Y. 2018. Prepositioning emergency supplies under uncertainty: A parametric optimization method. Engineering Optimization, 50(7), 1114-1133. [ Links ]
[25] Torabi, S.A., Shokr, I., Tofighi, S., and Heydari, J. 2018. Integrated relief prepositioning and procurement planning in humanitarian supply chains. Transportation Research Part E: Logistics and Transportation Review, 113, 123-146. [ Links ]
[26] Chen, J., Liang, L., and Yao, D.Q. 2018. Prepositioning of relief inventories: A multi-product newsvendor approach. International Journal of Production Research, 56(4), 1-20. [ Links ]
[27] Velasquez, G.A., Mayorga, M.E., and Cruz, E.A. 2019. Prepositioning inventory for disasters: A robust and equitable model. OR Spectrum, 41(3), 757-785. [ Links ]
[28] Aslan, E., and Çelik, M. 2019. Prepositioning of relief items under road/facility vulnerability with concurrent restoration and relief transportation. IISE Transactions, 51(8), 847-868. [ Links ]
[29] Hosseininezhad, F., Makui, A., and Tavakkoli-Moghaddam, R. 2018. Hub location modeling of the relief chain in emergency management based on the needs of the injured of road accidents. Transportation Research, 15(3), 321335. [ Links ]
[30] Boonmee, C., and Kasemset, C. 2020. The multi-objective fuzzy mathematical programming model for humanitarian relief logistics. Industrial Engineering and Management Systems, 19(1), 197-210. [ Links ]
[31] Sharifi-Sedeh, M., Ardalan, A., Torabi, S.A., Allahbakhshi, K., and Khorasani-Zavareh, D. 2020. Factors affecting the prepositioning of relief items for natural disasters: A systematic review. Iranian Red Crescent Medical Journal, 22(1). [ Links ]
[32] Pishvaee, M.S., and Torabi, S.A. 2010. A possibilistic programming approach for closed-loop supply chain network design under uncertainty. Fuzzy Sets and Systems, 161(20), 2668-2683. [ Links ]
[33] Zimmermann, H.J. 1978. Fuzzy programming and linear programming with several objective functions. Fuzzy Sets and Systems, 1(1), 45-55. [ Links ]
[34] Yusoff, Y., Ngadiman, M.S., and Zain, A.M. 2011. Overview of NSGA-II for optimizing machining process parameters. Procedia Engineering, 15, 3978-3983. [ Links ]
[35] Amiri, M., and Khajeh, M. 2016. Developing a bi-objective optimization model for solving the availability allocation problem in repairable series-parallel systems by NSGA II. Journal of Industrial Engineering International, 12(1), 61-69. [ Links ]
Submitted by authors 2 Oct 2020
Accepted for publication 29 Mar 2021
Available online 28 /May 2021
# The author was enrolled for a Ph.D. degree in the Department of Industrial Engineering, Science and Research Branch, Islamic Azad University, Iran
* Corresponding author: amakui@iust.ac.ir

