


Services on Demand
Article
 English (pdf)
 Article in xml format
 Article references
Indicators

Related links
-
 Cited by Google
 -
 Similars in Google
Share

 Permalink
South African Journal of Industrial Engineering
On-line version ISSN 2224-7890
Print version ISSN 1012-277X
S. Afr. J. Ind. Eng. vol.31 n.4 Pretoria Dec. 2020
http://dx.doi.org/10.7166/31-4-2363
CASE STUDIES
Improving quality by implementing lean manufacturing, SPC, and HACCP in the food industry:
J.L. Cabrera; O.A. Corpus; F. Maradiegue; J.C. Álvarez*
Engineering Faculty, Universidad Peruana de Ciencias Aplicadas, Lima, Peru; J.L. Cabrera: https://orcid.org/0000-0001-6878-3572; O.A. Corpus: https://orcid.org/0000-0002-9177-3214; F. Maradiegue: https://orcid.org/0000-0003-0966-4666; J.C. Álvarez: http://orcid.org/0000-0002-2459-9236
ABSTRACT
Interest in ensuring the safety of food for human consumption has grown considerably owing to the economic impact of returns on products that do not meet the organoleptic characteristics that customers require. The presence of pollutants and reduced shelf life are the most common problems affecting food quality. This research applied the improving quality to a food SME company belonging to the 'fourth range' sub-sector based on lean manufacturing tools, statistical process control (SPC), and the Hazard Analysis and Critical Control Points (HACCP) system. The Lean tools that were applied are value stream map and 5s. The value stream maps (VSMs) to identify the operations most at risk of cross-contamination in the supply chain, and use 5S to prevent the contamination and decomposition of products in work areas. The statistical process control allows the variability of products to be controlled with respect to consumer quality parameters; and HACCP insures food safety through the control of critical points of contamination risk. A pilot project was carried out for two months, which resulted in a reduction of product returns by 89.2%.
OPSOMMING
Belangstelling in die versekering van voedselveiligheid vir menslike verbruik het noemenswaardig toegeneem as gevolg van die ekonomiese impak van produkte wat nie aan die standaarde wat verbruikers verwag voldoen nie. Die teenwoordigheid van besoedeling en verminderde rakleeftyd is van die mees algemene probleme wat voedselgehalte negatief beïnvloed. Hierdie navorsing het die voedselgehalte van 'n klein maatskappy verbeter deur lenige vervaardiging, statistiese prosesbeheer en gevaar-analise en kritieke beheerpunte toe te pas. Die lenige werktuie wat toegepas is, is die waardestroomkaart en 5S. Die waardestroomkaarte is gebruik om die bedrywighede wat die hoogste risiko vir kruis-kontaminasie inhou te identifiseer en 5S is gebruik om die kontaminasie en ontbinding van die produkte in werk areas te voorkom. Die statistiese prosesbeheer verseker dat die variasie van produkte binne verbruiker gehalte parameters gehandhaaf word. Die gevaar-analise en kritieke beheerpunte verseker voedselveiligheid deur kritieke punte met hoë kontaminasie risiko te beheer. n Proefprojek is vir twee maande uitgevoer en die resultaat daarvan was 'n vermindering van verwerpte produkte van 89,2%.
1 INTRODUCTION
In the first half of 2018, the Peruvian food sector, exports in the fruit and vegetable sub-sector grew according to the Association of Agricultural Producers Guilds of Peru (AGAP), reaching US$ 1,389 million, which represented 26 per cent of all exports. Fresh fruit grew by 29 per cent or $1,236 million in the first half of this year, compared with the previous year. In addition, the fresh vegetable sub-sector grew by seven per cent in the first six months of the year 2018. The most important ones were fresh asparagus, at US$ 127 million, an increase of six per cent; fresh onion, at US$ 17 million, and increase of 62 per cent; and fresh peas, at US$ 3 million, equivalent to a 109 per cent increase over the previous period [1].
The quality of processed and ready-to-eat plant products is often the result of a combination of attributes. The relevant attributes of organoleptic quality include appearance, texture, smell, and taste, along with others relating to nutritional quality and food safety. Symptoms of deterioration of these products include changes in colour, and the appearance of oxidative browning on cut surfaces [2]. These factors influence the quality compliance and quality assurance of finished food products that are perishable and need to be consumed without delay.
2 PROBLEM
The case study was carried out in a food SME of the 'fourth range' located in Lima. The products in the fourth range are those that are processed as fresh, clean, chopped, and packaged vegetables and fruits for consumption. Their largest commercial market is through the HORECA (hotels, restaurants, and casinos) channel.
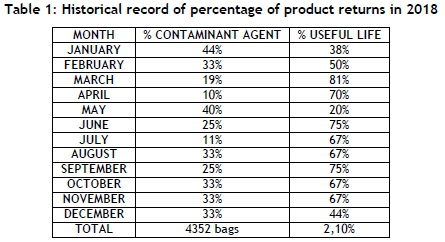
The importance of this sub-sector lies in ensuring and providing quality products to the consumer. That is why the information obtained from the historical data of claims and/or returns of products by customers during 2018 was analysed. As a result of the analysis, it was concluded that the return rate of products completed in 2018 was 2.1 per cent of total production, representing a total amount of 4,352 defective bags per year. In addition, the main economic causes and consequences were identified, representing nine per cent of the total turnover in economic losses.
The Ishikawa diagram of this case study is shown in Figure 1.
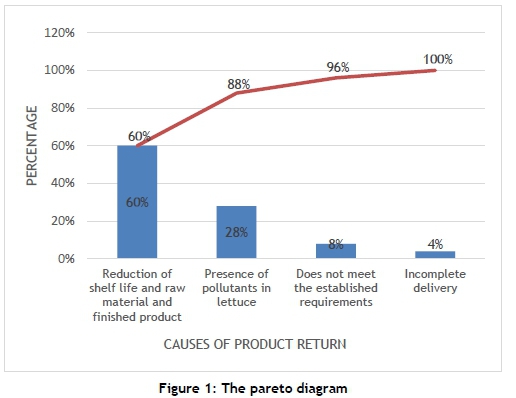
Table 1 indicates the percentage of products returned, based on the type of problem presented for each month in 2018. It can be seen that 4,352 bags of products were returned, representing 2.10 per cent of the production in that year.
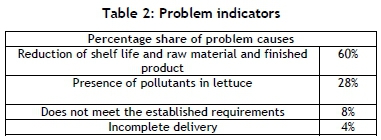
An analysis of the Pareto diagram was carried out to identify the main causes of product returns, and it was found that more than 80 per cent of the cause were the reduction in shelf life and the presence of contaminants in lettuce, as shown in Table 2. Once the main causes of the problem has been identified, the tools and/or methods that could address the causes of the identified problem were identified.
3 BACKGROUND
A review of the literature states that the implementation of lean manufacturing solves the problems of the food industry in relation product quality, to avoid reduced shelf life and cross-contamination. In addition, there is a structured framework that serves as a guide in the implementation of lean production for food industry companies, and that describes in detail the procedures to be followed to understand the contextual factors and to achieve the company's maximum potential [4]. The literature also suggests adding KPIs and support from external exchange agents to control the progress of results in process improvement [5].
Managing a lean implementation programme involves working in teams and measuring the final implementation of KPIs, which suggests that control measurements should be performed in the input, production, and output processes. In addition, it shows that the use of upstream performance reports and non-financial rewards are indispensable to the performance of lean manufacturing implementation [6].
One of the most widely used tools by food companies to identify cross-contamination risks [7] and the critical points of food loss and waste in the supply chain [8] is value stream maps (VSMs). Another of the most commonly used tools is the 5S technique, in which a culture of cleanliness is established in organisations in order to ensure the reduction of food waste that is caused by pollution and decomposition [7], as well as inventory levels [9].
The main barriers to the implementation of strict manufacturing practices are sequential cleaning time, long preparation time between product types, and high product perishability. Most of the significant barriers indicated by respondents are specific to the nature of the food processing industry, including lack of knowledge, lack of availability of resources, and poor employee participation [10]. Weak business culture, poor leadership, and resistance to change should also be considered barriers. However, Vlachos [11] uses the get the knowledge to train senior managers in how to apply lean tools.
The authors of several articles suggest that the SPC tool for quality control is indispensable in the food industry, because it determines an SPC roadmap that serves as a guide for the successful implementation of statistical process control in the food industry. This roadmap has five stages that must be developed by senior management, the steering committee, and the action team. This roadmap will reflect the overall movement of food manufacturing practices in respect of continuous improvement learning [12]. The -R and -S charts are the most used by these industries. In addition, the SPC tool defines as limitations to implementation the lack of knowledge of the Statistical Process Control, the lack of training related to quality improvement, and the lack of statistical knowledge and skills. Its application allows for reduced waste, fewer customer complaints, and lower defect and reprocessing rates [10] [13].
It should be mentioned that other authors propose the implementation of the Hazard Analysis and Critical Control Points system to ensure food safety by monitoring the critical limits of the checkpoints identified on the production line.
Based on the above, it is proposed that the implementation of lean tools, statistical process control, and the HACCP system in the food industry provides a solid framework to ensure the quality and safety of the products of this sector for their flexibility and adaptation to different contexts and needs, depending on the nature of the product, the process, and the design of the plant [14]. For proper implementation, certain barriers identified by some authors, such as the lack of knowledge, the lack of available resources, low employee participation [11][15], lack of experience, lack of education, and inadequate training in the lean application [16] should be considered.
4 INNOVATIVE PROPOSAL
To deal with the identified causes, the following tools will be implemented: the HACCP system and the lean manufacturing methodology, along with two specific tools, value stream maps and 5S; and finally, statistical process control. Implementation will be carried out through a pilot plan over a two-month trial period.
4.1 HACCP system
The implementation of HACCP will allow us to ensure food safety by controlling critical points of contamination risk, from the acquisition of the raw material to the delivery of the product to the customer. This methodology is developed under the principles of Codex Alimentarius [17]. These principles ensure effective control of food safety at every stage of the production process. The seven principles of Codex Alimentarius [18] are as follows:

The following are the steps that were used to implement HACCP.
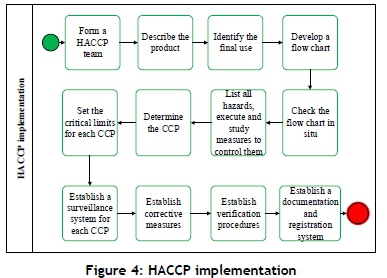
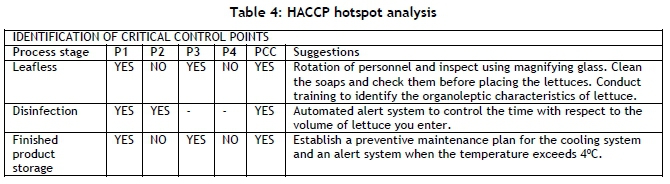
The HACCP implementation group consisted of four people: the quality manager, the quality supervisor, the warehouse manager, and the production engineer. The HACCP group carried out an analysis of the production process of American lettuce, in which for each stage of the process the hazards and their origin are identified, and then an assessment is carried out if the risk is significant. This made it possible to identify critical checkpoints.
Subsequently a monitoring system was performed for each critical control point to be executed in each respective area.
The team coordinator will verify compliance with the procedures and records carried out by those responsible for each checkpoint.
4.2 Lean manufacturing tools
4.2.1 Value stream map (VSM)
The value chain map allowed us to identify value-added activities and detect where cross-contamination and waste occur in productive activities. The six steps in the figure below were followed for implementation.
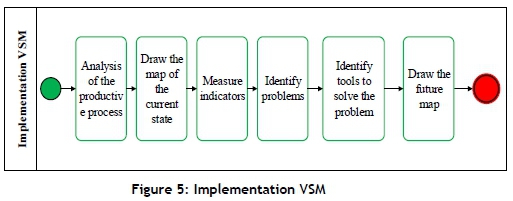
Cycle time, value-added time, number of operators, time available to work, and priority risk number were also placed in the VSM. After obtaining the numerical data, the time spent on value-added (VA) and non-value-added (VAN) times was calculated, and as a percentage. All this identified the hotspots and chose the best tool to solve the problem identified in the process [19,][20]. Finally, the future VSM was charged with the results that would be obtained after the implementation of the solution proposal.
4.2.2 5S
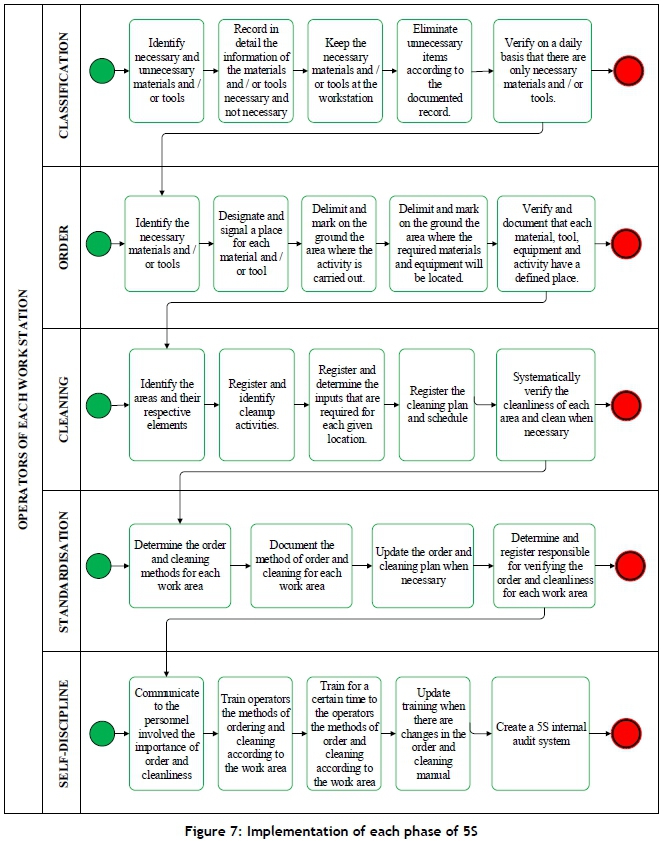
Implementing the 5S would allow us to reduce the factors that trigger the cross-contamination and oxidation of products through classification, ordering, cleaning, standardisation, and self-discipline. In addition, this tool would create a culture of safety and hygiene, which is important in the food industry to ensure the quality of products. The figure below shows the steps that were executed for deployment:
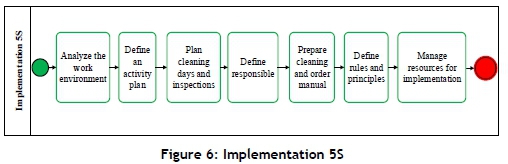
The first step in the implementation of the 5S was to analyse the work environment of each production process to identify the activities to be carried out. An activity plan was then defined based on the results of each workspace. In each identified area, a number of activities were carried out that correspond to the phases of the 5S, which include the classification of necessary and unidentified materials and/or equipment, the order of the necessary materials, and the cleaning and inspection of the materials and of their work area. Finally, the habit of activities was created until a 5S culture was established in the workers [21].
4.2.3 Control de procesos estadísticos
Statistical process control will allow us to analyse the variability of processes to identify common and special causes to stabilise and control them through control charts, for the case study the P chart will be used. The application of statistical process control follows five steps.
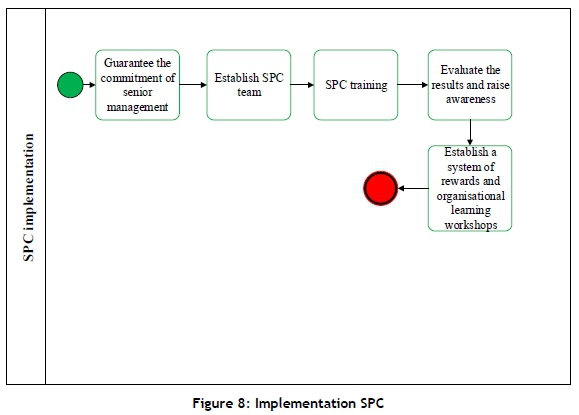
To facilitate the implementation of the lean manufacturing and SPC tools, a roadmap was adapted that allowed us to establish indicators and track the phases of implementation to verify compliance.
Phase A: KNOWLEDGE
This phase marks the beginning of the implementation of the new management model. Senior management was informed about the diagnosis and the benefits of implementing lean manufacturing and SPC tools. Values would be created, and the commitment of senior management would be guaranteed.
TRAINING IN LEAN MANUFACTURING AND SPC:
Training was conducted on VSM, 5S and SPC in order to increase knowledge of lean manufacturing and SPC, reduce resistance to change, direct internal experience towards the implementation of the new management model, support the sustainability of the application, and establish a culture of continuous learning in the company.
Phase B: PREPARATION
In this phase the committee was created that would be responsible for the planning and training of the action team that would execute the VSM, 5S and SPC. Functions were designated.
Phase C: INITIATION
This phase was in the hands of the action team. The first group of action teams prioritised critical process stages and their control through the p-card. The second action team group was responsible for performing the VSM and 5S application in each workspace. Its application was developed progressively.
Phase D: INSTITUTIONALISATION
At this stage, the communication of the results was essential to raise awareness of the importance of maintaining this management model to improve the quality of the products. Senior management was responsible for communicating the results, and the committee was responsible for continuing the training to all the workers in the company.
THE STEERING COMMITTEE OF LEAN MANUFACTURING AND SPC
In this phase, continuous monitoring of the performance of key processes was developed under the PDCA methodology.
Phase E: SUSTAINABILITY
Senior management applied a reward system for positive results, to motivate its workers to comply with the established procedures and continually to raise awareness of the benefits of implementing the new management model, with long-term projections. These efforts included maintaining knowledge in the company. The main objective of this phase is to ensure the knowledge and other benefits generated through the implementation of the management model [12].
At each stage, indicators were established to monitor their progress.
5 RESULTS
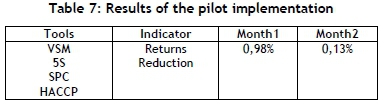
The results were obtained from the two-month pilot implementation (August and September 2019), in which a progressive reduction in the rate of returns of finished products was observed, as shown in Table 7:
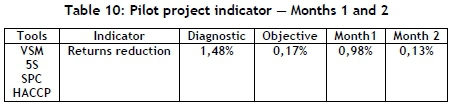
In addition, the values of the indicators developed in the application of each lean manufacturing and SPC tool were improved, as shown in Table 8:
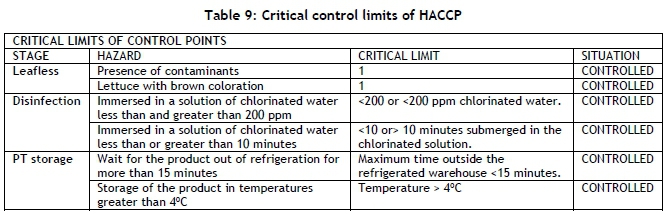
The critical limits of the production process were obtained through the application of the HACCP system. It was observed that the areas for clearing, disinfection, and storage of finished products were critical control points where corrective measures must be applied to keep them under control and ensure food quality.
6 ANALYSIS OF RESULTS
The results of the pilot implementation were satisfactory because there was an 89.2 per cent reduction in returns over the previous year; but this value was obtained only in the second month of implementation because, in month 1, workers were in the process of adapting to the new activities.
The economic impact of the pilot project compared with the previous year increased cash flow by 35.6 per cent. Depending on the cash flow of the project, it was observed how the revenue per kilogram of lettuce increased each quarter owing to the reduced number of product returns.
In addition, there was a nine per cent increase in revenues based on cash flow through the third quarter of 2019, compared with the previous year. Likewise, better results were projected because the improvement was progressive. It is important to maintain good practices and follow procedures, so that the improvement is constant.
7 CONCLUSION
The implementation of VSM, 5S, SPC, and the HACCP system reduces the returns of a food company's fourth range products. The HACCP system allowed it to establish the control limits that determined the monitoring system, corrective measures, and procedures that ensure the safety of the products. The interest and support of management in the training period was relevant, owing to their commitment to the project.
The operators' resistance to the change in working method was present, as changes were made in their usual way of working, such as the use of mandatory Personal Protective Equipment(PPE), respecting the assigned jobs in the leaf-stripping area and the correct use of crates according to colour and function. The result obtained by the reduction in the number of returns increased the company's cash flow by 35.6 per cent compared with the previous year.
There was also a nine per cent increase in the third quarter of 2019, compared with the previous year. A further increase in revenue was expected, because the improvement was progressive. It was also important to maintain good practices and to follow procedures so that improvement was constant.
The results of the pilot project are expected to motivate researchers to apply these tools to SMEs in the food industry. It also highlighted the importance of working with suppliers using tight agriculture to ensure that raw material enters under the required conditions. This new system has not been studied in our research; other researchers are expected to address this problem.
REFERENCES
[1] COMERCIO. 2018. Exportaciones agrarias crecieron 19% impulsadas por frutas y hortalizas. Available at: https://elcomercio.pe/economia/peru/frutas-hortalizas-impulsaron-crecimiento-19-exportaciones-agrarias-noticia-544462 [Accessed on 28 April 2019]. [ Links ]
[2] Belén, D.I. 2016. Control de Calidad de Productos de IV gama. Available at: http://oa.upm.es/45649/1/INVE_MEM_2016_248062.pdf [Accessed on 28 April 2018]. [ Links ]
[3] Chavarrías, M. 2010. What are the food ranges? Eroski Consumer. Available at: https://www.consumer.es/seguridad-alimentaria/que-son-las-gamas-alimentarias.html [Accessed on 30 April 2019]. [ Links ]
[4] Dora, M. & Gellynck, X. 2015. House of lean for food processing SMEs. Trends in Food Science and Technology, 44(2), pp. 272-281. https://doi.org/10.1016Aj.tifs.2015.03.008 [ Links ]
[5] McGovern, T., Small, A. & Hicks, C. 2017. Diffusion of process improvement methods in European SMEs. International Journal of Operations & Production Management, 37(5), pp. 607-629. https://doi.org/10.1108/IJOPM-11-2015-0694 [ Links ]
[6] Netland, T.H., Schloetzer, J.D. & Ferdows, K. 2015. Implementing corporate lean programs: The effect of management control practices. Journal of Operations Management, 36(1), pp. 90-102. https://doi.org/10.1016/jj.jjom.2015.03.005 [ Links ]
[7] De Steur, H., Wesana, J., Dora, M.K., Pearce, D. & Gellynck, X. 2016. Applying value stream mapping to reduce food losses and wastes in supply chains: A systematic review. Waste Management, 58, pp. 359-368. https://doi.org/10.1016/jj.wasman.2016.08 [ Links ]
[8] Psomas, E., Antony, J. & Bouranta, N. 2018. Assessing lean adoption in food SMEs: Evidence from Greece. International Journal of Quality and Reliability Management, 35(1), pp. 64-81. https://doi.org/10.1108/IJQRM-05-2016-0061 [ Links ]
[9] Borges Lopez, R., Freitas, F. & Sousa, I. 2015. Application of lean manufacturing tools in the food and beverage industries. Journal of Technology Management & Innovation, 10(3), pp. 120-130. https://dx.doi.org/10.4067/S0718-27242015000300013 [ Links ]
[10] Dora, M., Van Goubergen, D., Kumar, M., Molnar, A. & Gellynck, X. 2014. Aplicación de prácticas lean en pequeñas y medianas empresas alimentarias. British Food Journal, 116(1), pp. 125-141. doi: 10.1108 / bfj-05-2012-0107 [ Links ]
[11] Vlachos, I. 2015. Applying lean thinking in the food supply chains: A case study. Production Planning and Control, 26(16), pp. 1351-1367. https://doi.org/10.1080/09537287.2015.1049238 [ Links ]
[12] Abdul Halim Lim, S., Antony, J., Garza-Reyes, J.A. & Arshed, N. 2015. Towards a conceptual roadmap for statistical process control implementation in the food industry. Tendencias en Ciencia y Tecnología de Alimentos, 44(1), pp. 117-129. doi: 10.1016/j.tifs.2015.03.002 [ Links ]
[13] Abdul Halim Lim, S., Antony, J., He, Z. & Arshed, N. 2017. Observaciones críticas sobre la implementación del control de procesos estadísticos en la industria alimentaria del Reino Unido. Revista Internacional de Gestión de Calidad y Fiabilidad, 34(5), pp. 684-700. doi: 10.1108/ijqrm-03-2015-0035 [ Links ]
[14] Bamford, D., Forrester, P., Dehe, B. & Leese, R.G. 2015. Partial and iterative lean implementation: Two case studies. International Journal of Operations & Production Management, 35(5), pp. 702-727. https://doi.org/10.1108/IJOPM-07-2013-0329 [ Links ]
[15] Dora, M., Kumar, M. & Gellynck, X. 2016. Determinants and barriers to lean implementation in food-processing SMEs - A multiple case analysis. Production Planning and Control, 27(1), pp. 1-23. https://doi.org/10.1080/09537287.2015.1050477 [ Links ]
[16] Panwar, A., Jain, R. & Rathore, A.P.S. 2015. Implementación esbelta en las industrias de procesos indias: Alguna evidencia empírica. Journal of Manufacturing Technology Management, 26(1), pp. 131 -160. doi: 10.1108/jmtm-05-2013-0049 [ Links ]
[17] Djekic, I., Kuzmanovic, J., Andelkovic, A., Saracevic, M., Stojanovic, M.M. & Tomasevic, I. 2016. Effects of HACCP on process hygiene in different types of Serbian food establishments. Food Control, 60, pp. 131 - 137. doi: 10.1016/j.foodcont.2015.07.028 [ Links ]
[18] Przystupa, K. 2019. The methods analysis of hazards and product defects in food processing. Czech J. Food Sci., 37, pp. 44-50. https://doi.org/10.17221/44/2018-CJFS [ Links ]
[19] Panwar, A., Nepal, B., Jain, R., Rathore, A.P.S. & Lyons, A. 2017. Understanding the linkages between lean practices and performance improvements in Indian process industries. Industrial Management and Data Systems, 117(2), pp. 346-364. https://doi.org/10.1108/IMDS-01-2016-0035 [ Links ]
[20] Kapelko, M., Lansink A.O. & Stefanou S.E. 2015. Effect of food regulation on the Spanish food processing industry: A dynamic productivity analysis. PLoSONE, 10(6), e0128217. doi:10.1371/ journal. pone.0128217 [ Links ]
[21] Fercoq, A., Lamouri, S. & Carbone, V. 2016. Lean/green integration focused on waste reduction techniques. Journal of Cleaner Production, 137, pp. 567-578. doi: 10.1016/j.jclepro.2016.07.107 [ Links ]
Submitted by authors 17 May 2020
Accepted for publication 18 Nov 2020
Available online 14 Dec 2020
* Corresponding author: pciijalv@upc.edu.pe

