


Services on Demand
Article
 English (pdf)
 Article in xml format
 Article references
Indicators

Related links
-
 Cited by Google
 -
 Similars in Google
Share

 Permalink
South African Journal of Industrial Engineering
On-line version ISSN 2224-7890
Print version ISSN 1012-277X
S. Afr. J. Ind. Eng. vol.31 n.4 Pretoria Dec. 2020
http://dx.doi.org/10.7166/31-4-2328
CASE STUDIES
Minimising electricity costs by developing an effective combination of alternative energy sources
V.S.S. Yadavalli*; J. Steyl
Department of Industrial and Systems, Engineering, University of Pretoria, South Africa. V.S.S. Yadavalli: https://orcid.org/0000-0002-3035-8906; J. Steyl: https://orcid.org/0000-0001-6209-2463
ABSTRACT
This study evaluates the high electricity costs faced at a carpet manufacturing company. Research was conducted by focusing on the supply and availability of electricity in South Africa and alternative energy sources. Modelling methods were investigated to determine an appropriate approach to solving the high-cost problem at the company to ensure that the model could be reused for similar scenarios. The findings provide an electricity minimisation solution that requires the installation of a solar system. Using generated solar energy, and consuming generator power to maintain optimal monthly municipal thresholds, electricity costs would be reduced by over R100 000 monthly.
OPSOMMING
Hierdie studie evalueer die hoè kostes van elektrisiteit by 'n matvervaardigingsmaatskappy. Navorsing het gefokus op die verskaffing en beskikbaarheid van elektrisiteit in Suid-Afrika en alternatiewe energiebronne. Modelleringsmetodes is ondersoek om 'n gepaste benadering te identifiseer om die hoè-koste probleem by die maatskappy op te los. Die bevindinge verskaf n elektrisiteit minimering oplossing wat die installasie van 'n sonpaneel stelsel vereis. Deur sonenergie op te wek, en deur dieselgenerator krag te gebruik om die optimale maandelikse munisipale drempels te handhaaf, kan maandelikse energiekostebesparings van meer as R100 000 gerealiseer word.
1 INTRODUCTION
The cost and consumption of electricity is a major challenge that manufacturing companies face in South Africa. Because of inflation, a failure to meet electricity demand, and poor planning, this challenge is increasing. For manufacturing companies to remain competitive in national and international markets, optimal electricity consumption planning is needed. Businesses are adopting environmental innovations with the goal of reducing costs. A leading carpet manufacturing company finds it necessary to solve this problem. This project was executed at MONN Pty (Ltd), with the aim of minimising electricity costs by developing an effective combination of alternative energy sources.
MONN is a manufacturer of exceptional quality custom-woven carpets for hospitality use. The company also manufactures commercial carpet tiles for offices and banks and custom-designed carpets for residential purposes. Carpet manufacturing processes require significant amounts of energy, given that the company has 1MW of machinery installed.
Owing to the high-energy consumption in manufacturing operations, MONN incurs high electricity costs. An underlying problem at MONN is that the local town, Harrismith, experiences frequent unexpected power disruptions, in addition to load-shedding. This is because the municipality owes Eskom R2.8 billion [1]. Given the power disruptions in the region, an element of uncertainty is present in the problem.
Electricity expenses can be reduced by decreasing the amount of municipal electricity required. This can be achieved by installing alternative energy sources and managing energy use effectively. By installing alternative energy sources, the factory would be slightly less dependent on the municipality's energy supply; and by using renewable energy sources, the company would reduce the power demand from the grid and conserve energy.
2 RESEARCH PROBLEM
2.1 The supply and availability of electricity in South Africa
As mentioned in the National Energy Regulator of South Africa's (NERSA) annual reports since 2008, government and Eskom regularly increase tariffs as a way to prevent load-shedding. Eskom's requests for price increases became frequent over the past decade, to the point where electricity tariff increases outpaced inflation [2]. Over the past decade, Eskom's electricity prices have increased four times faster than inflation [3].
In the early 2000s, South Africa was considered to have among the lowest electricity costs in the world [3]. An investigation that benchmarked South Africa's electricity costs against those in the rest of the world in 2017 discovered that South Africa was in the middle of the range of residential electricity tariffs per country [3]. A more realistic investigation involved considering the relative affordability of electricity in each country. This study showed that, in terms of relative affordability as a percentage of median income, electricity is most affordable in developed countries and least affordable in African countries. While this study shows that electricity is more affordable in South Africa than in several other African countries, the affordability of electricity in South Africa is continually decreasing [3].
South African manufacturing industries suffer the consequences of increased tariffs owing to the copious amounts of energy required to power machinery [2]. For industries to act to reduce electricity costs, one solution would be to reduce energy demand. This would be possible if energy efficiency were implemented. By installing alternative energy sources and managing energy use effectively, MONN's energy demand would be reduced, decreasing the amount of municipal electricity required.
3 LITERATURE REVIEW
Potential solution methods under uncertainty are investigated, based on what engineers have used to solve similar problems in the past. The following topics were investigated:
• industrial engineering methods of optimising electricity consumption;
• alternative energy sources;
• net-metering; and
• clean-energy tax incentives.
3.1 Stochastic modelling
Stochastic modelling is a scientific approach, involving mathematical models, to decision-making that will solve the optimal design of a defined system to achieve a goal [4]. A mathematical model is a mathematical representation of a real situation that is used to make informed decisions or to understand an actual situation better [4]. Stochastic modelling is mathematical modelling that uses ranges of values for variables in the form of probability distributions. This is suitable for solving problems in situations where there are elements of uncertainty.
Recourse programming is a method that is used to deal with uncertain data. In the case of uncertain parameters, one can use expected value mathematical programming. This method entails inserting 'expected' deterministic equivalents of uncertain parameters into the model (Kall and Wallace 1994). In a research project with the goal of cost minimisation under uncertain conditions, the proposed approach is to perform energy scheduling optimisation based on a stochastic programming model [6].
Based on a research article on optimising a photovoltaic (PV) storage hybrid unit in a household, the method used is multi-stage stochastic optimisation [7]. In this paper, a strategy is developed for a smart house that integrates solar power and a storage device, while taking the uncertainty in PV generation into consideration. A stochastic dual dynamic programming (SDDP) algorithm is used in this paper, and applied to stochastic solar PV generation and deterministic energy demand.
LINGO is an optimisation modelling software that can be used to solve stochastic models. It is a tool designed to solve, among other things, linear, nonlinear, and stochastic models efficiently [8].
In considering stochastic programming as a potential industrial engineering technique to optimise energy efficiency, the most appropriate method, owing to uncertainty in data, is recourse modelling.
3.2 Simulation modelling
An alternative way of solving a problem under uncertainty is to perform scenario analysis, also referred to as simulation modelling (Kall and Wallace 1994). Simulation modelling is the reproduction of a real-world process that serves as a risk-free environment to test experiments without making real-world changes. This is when a virtual 'prototype' model is built that represents actual activities, and scenarios are tested on this model to find the best scenario or a good combination of scenarios. The advantages of simulation modelling include risk-avoidance, saving money and time, visualisation, insight into dynamics, increased accuracy, and handling uncertainty [9]. A disadvantage of simulation modelling is that the proposed solution will not necessarily be the optimal one.
AnyLogic is simulation software that uses three types of simulation: discrete event modelling, agent-based modelling, and system dynamics modelling [9]. Discrete event modelling is used for systems that are naturally described as a sequence of processes. Entities undergo changes as they move through a sequence of operations [9]. In considering simulation as a potential technique to solve the problem of this project, the simulation type best suited to MONN's energy consumption activities is discrete event modelling.
The proposed best method is stochastic programming, because the solution generated is the optimal solution, whereas with simulation modelling, the solution is limited to the scenarios tested. Because several uncertainties are present in this project, it is unknown which of the two proposed methods is the most appropriate for minimising costs. The optimal solution generated in the stochastic model may not be the most realistic solution. Ultimately, for this reason, it was decided that both methods will be used, tested, and compared in order to achieve the most accurate results.
3.3 Alternative energy sources
Different types of alternative energy sources, in terms of suitability for the region and effectiveness in generating energy, need to be investigated. These investigated include solar power, industrial batteries, and diesel generators.
A solar energy consulting company, SOLA Future Energy Pty Ltd, compiled a feasibility study for MONN that consisted of a complete analysis of the suitability of installing a PV system. PV panels convert solar energy into an electrical direct current. A solar inverter converts the direct current into alternating current that is used as electricity [10]. According to a website article by Ecotrades [10], PV panels work effectively even in poor weather conditions. In a document compiled by SOLA [11], a suggested combination of alternative energy sources includes a PV system and chargeable industrial batteries. The proposed system size, according to the SOLA document, is based on the available roof space, maximising yields, expected structural integrity, and expected energy demand on the site. This document provides evidence that the installation of a PV system would generate sufficient energy.
The system in Figure 1 has the goal of 'peak shaving', which simply means reducing load energy peaks to reduce electricity costs. Batteries are charged when energy is cheapest, and battery power is consumed when energy is the most expensive. A research paper by Hafiz et al. [7] also suggests the combination of PV power and energy storage. Energy storage using batteries improves the use of PV power. Electricity consumption costs can be reduced by using an optimal scheduling algorithm [7]. Li-ion batteries are highly efficient, with a 99% charge efficiency and small discharge loss. Battery power is suitable for any region and, in conjunction with PV power, is an effective energy source to consider for this project.

Diesel generators are used to power manufacturing operations at MONN in times of power disruptions. This energy source has proven effective for power generation and in its suitability for the region.
Based on the above research, energy sources such as PV energy, battery power, and diesel generators proved to be both suitable for the region and effective in generating energy. Technical specifications for the installation of the proposed solutions containing PV energy, battery power, and diesel generators are stipulated in Tables 2 and 3.

3.4 Net-metering
Net-metering allows residential, commercial, or industrial customers who generate their own energy through PV systems or other renewable energy sources to sell excess energy back into the grid [12]. During the day, a solar system may generate more energy than the customer requires. With a net-metered system, a customer will receive credits as the meter runs backwards when excess energy is generated. In South Africa, this concept is known as small scale embedded generation (SSEG).
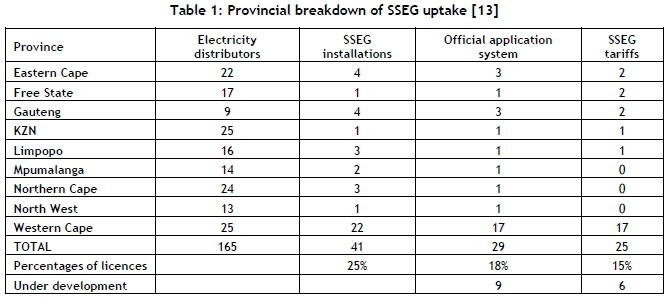
Certain municipalities allow the installation of SSEG. There are, however, many regulations in place where licences are required. NERSA has established specific tariffs for customers who are actively involved in SSEG [13]. Table 1 shows the provincial breakdown of SSEG uptake. The province with the highest SSEG uptake is the Western Cape, with 22 municipalities allowing the installation of SSEG. The Free State, however, only has four municipalities that allow the installation of SSEG; Maluti-a-Phofung, Harrismith municipality, is not one of them. This means that the installation of SSEG cannot be considered at MONN yet.
3.5 Clean energy tax incentives
According to an article on the Western Cape government website (2017), there are two tax incentive additions to the Income Tax Act: the energy efficiency income tax incentive (Section 12L) and the renewable energy tax incentive (Section 12B).
The energy efficiency income tax incentive allows for tax deductions on all energy reduction measures taken, except for renewable energy sources. Section 12L of the Income Tax Act became official in 2013, and the amendment made in 2015 includes co-generation [14]. Deductions can be made under the following conditions: businesses can claim deductions of 95 cents per kilowatt-hour of energy savings made in a year. Savings can be claimed from cogeneration for combined heat and power if the conversion efficiency of the captive power plan is greater than 35 per cent. In order to claim deductions, businesses are required to register energy efficiency schemes with the South African National Energy Development Institute (SANEDI) [14].
Section 12B of the Income Tax Act accounts for capital invested in purchasing assets used in producing renewable energy. This tax incentive is put in place to encourage the installation of renewable energy systems. The deduction falls under the capital allowances for property, plant, and equipment. The amendment of the allowance in the 2015 tax year served as an incentive for the use of solar power rather than fossil fuel to generate energy for equipment. The assets that allow deductions to be claimed include assets used to generate the following: wind power, solar energy, photovoltaic solar energy, concentrated solar energy, hydropower of no more than 30 megawatts, and biomass [15]. For all photovoltaic assets that do not exceed one megawatt, a 100% allowance deduction of the cost of the asset is granted. The integration of renewable energy is encouraged by the government owing to the reduced demand for electricity on the national electricity grid [15].
4 MODEL DEVELOPMENT
4.1 System representation
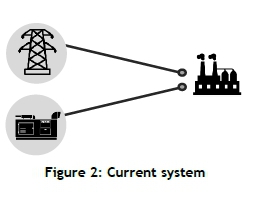
The current energy system representation shown in Figure 2 consists of municipal power and a generator. Power is received from the municipal grid to satisfy the factory load. The generator generates power to satisfy the energy demand when there are electricity outages.
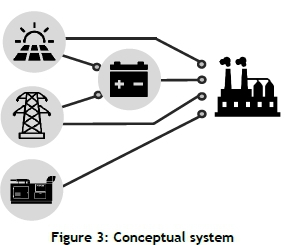
The conceptual power system is shown in Figure 3. The model development is based on this concept with the objective of achieving peak shaving. In this system, the factory load is connected to solar panels, an energy storage system, the municipal grid, and a generator. These four energy sources can power the factory directly. The battery system can be charged either by the PV system or the municipal grid.
4.2 Data analysis
Data required for the execution of the models includes the following:
• NERSA's monthly electricity charge setup
• NERSA's published tariffs for 2018/19
• Generator cost and specifications
• MONN's hourly energy consumption for one year
• Load-shedding data
• Hourly operating costs of alternative energy sources
• Initial installation costs for alternative energy system
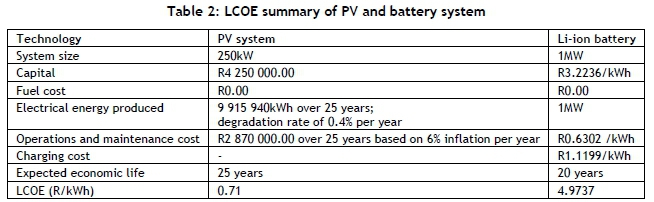
A well-suited metric for a cost comparison of different alternative energies is the levelised cost of energy (LCOE) [16]. This metric allows for a comparison between technologies that have distinctive sizes, lifetimes, and profiles of expenditure [16]. For this project, it is necessary that the models compare the costing components of the different energy sources fairly. For this reason, the LCOE metric is used to complete the data-costing component of the project to be added to the models. This metric is used to determine the cost per kWh of both solar power and battery power. The LCOE metric is described as:

It: investment expenditure in year t
Mt: operations and maintenance expenditure in year t
Ft: fuel expenditure in year t
Et: electrical energy generated in year t
r: discount rate
n: expected lifetime of system
The LCOE for solar power is calculated at R0.71 /kWh, as shown in Table 2, using equation (1). Lithium-ion battery costs retrieved from research are displayed in Table 2. Table 3 displays a summary of the system parameters used in both the stochastic model and the simulation model.
4.3 Assumptions
In the system being considered, the PV unit does not supply power to the grid. The assumption made about the battery system installed is that the C-rate for the lithium-ion battery is 1. For the purpose of this project, the assumed power factor of MONN is 1. Power disruptions are not considered in the stochastic model. This is because of the lack of data and the great uncertainty about the topic. The simulation model also assumes that there is no load-shedding. In one scenario, however, the effect of power disruptions on the energy cost is tested in the simulation model.
4.4 Stochastic model
First, the model including the addition of alternative energy sources is formulated, after which the specific scenarios tested are described.
Let: T be the time in hours {T = 1,2,...,744}, where i = 1 represents the hour from midnight to 01:00.
Ei = given energy demand at time i (kVA)
sgi = given solar energy generated at time i (kVA)
sc = given cost of solar energy installation (R/kWh)
mci = given cost of municipal energy at time i (c/kWh)
ge = given cost of generator energy (R/kVA)
be = given cost of battery energy (R/kWh)
bsocmln = given minimum state of charge of the battery system (%)
bsocmax = given maximum state of charge of the battery system (%)
r¡ch = given efficiency of the charger for charging the battery system (%)
Idisch = given efficiency of the charger for discharging the battery system (%)
bk = given capacity of battery (kWh)
de = given monthly demand charge for season (R/kVA)
bas = given monthly basic charge (R)
mi = municipal energy consumption at time i (kVA)
mdi = municipal energy consumed directly by the factory at time i (kVA)
bchmi = municipal energy used to charge the battery at time i (kVA)
si = solar energy consumption at time i (kVA)
sdi = solar energy consumed directly by the factory at time i (kVA)
bchsi = solar energy used to charge the battery at time i (kVA)
ssurpi = surplus of solar energy generated at time i (kVA)
bi = battery energy consumption at time i (kVA)
bchi = amount of energy used to charge the battery at time i (kVA)
bsoci = state of charge of battery at time i (%)
gi = generator energy consumption at time i (kVA)
maxm = maximum variable mt(kVA)
Objective function:

Subject to:
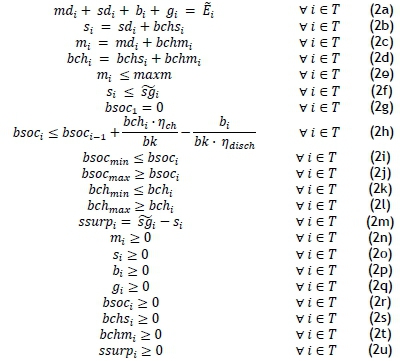
In this formulation, the objective function (2) minimises the monthly cost of electricity. The electricity cost equation considers the energy consumption variables of the four energy sources considered in this project (in kVA). These variables are multiplied by the cost component of each energy source (in R/kVA) consumed in time T. Time is an important factor, as the energy load of the factory and the solar generation of the solar system change per hour in a 24h day. With reference to equation (2a), the demand load must be met each hour. The uncertain parameter in this equation is the energy demand per hour.
Total energy consumption for solar and municipal energy is defined as the energy used to power the factory directly, and the energy used to charge the battery system. This is shown in equations (2b) and (2c). The total energy used to charge the battery system is calculated in equation (2d). Equation (2e) constrains municipal consumption. Solar energy consumption cannot be larger than the uncertain parameter, solar generation. This is constrained in equation (2f).
The battery's state of charge is defined in (2g) to (2l). With specific reference to equation (2h), the battery system's state of charge is constrained by considering the charging and discharging efficiencies and the storage system's capacity.
Surplus solar generation is defined when solar energy generated is larger than solar energy consumption in equation (2m). This system being considered does not allow PV-generated power to be pushed into the grid. If the solar power generated is larger than the electricity demand at a specific time, and the battery system is fully charged, then ssurptwill take care of the excess solar energy generated.
As defined in equations (2n) to (2u), the variables must be non-negative. The model can decide that an energy source must generate zero energy for a specific period. It cannot allow a variable to produce a negative amount of energy.
Scenarios modelled on the stochastic programme are based on the model formulated above. The only changes made to the model in the scenarios include running different data sets and changing specific parameters.
The scenarios tested on the stochastic model are briefly discussed:
• Stochastic Scenario 1: testing the effect of a combined solar, battery, generator, and municipal energy system on cost.
• Stochastic Scenario 2: testing the effect of a different tariff structure on the cost of the same formulated system. Where a flat rate energy charge is currently used, this scenario determines the effect of a time of use (TOU) tariff structure on energy cost.
• Stochastic Scenario 3: determining the optimal municipal energy level. The stochastic model was tested several times with different values for the maxm variable in search of the value that generates the lowest total energy cost.
4.5 Simulation model
The AnyLogic simulation model was developed. The basis of the model is to use state charts to represent every hour in the day. State charts allow a variable to have a unique value per hour, which is the case at MONN. The input data is read from an Excel spreadsheet.
The base model is a representation of MONN's energy consumption activities. This model has 24 states, each of which represents an hour: state 1 represents the hour from midnight to 01:00, and state 24 represents the hour from 23:00 to midnight. Each single state has a unique energy load that is called to a variable for the demand load used by the factory per hour. These unique hourly demand loads are read into the model from an Excel spreadsheet that holds historical data for each hour in January. A count parameter is incremented on the exit from each state, and is used to call the specific cell of the spreadsheet to be allocated to the demand parameter.
The simulation model calculates the cost components, such as the energy charge, the basic charge, and the demand charge, all of which total to the municipal electricity bill. The cost of the alternative energy components is determined by the model, which, for the base model, only consists of a generator. The total cost for the month is the sum of the municipal electricity cost and the alternative energy cost for the month.
Scenarios tested on the simulation model include the following:
• Simulation Scenario 1: determining the effect of the addition of a solar system on the energy cost.
• Simulation Scenario 2: determining the effect of the addition of solar power and battery power on the energy cost. Battery power is used to reduce the high demand usage times from 09:00 to 18:00 daily, assuming that the battery cannot be both charged and discharged during the same hour. In this model, the solar energy is consumed first, followed by a set level of battery energy; the remainder of the demand load is covered by municipal energy. The initial charging of the storage system is set to 400kWh. This gives the storage system a battery state of charge of 40 per cent. The storage system is set to generate 20kW of energy per hour for the factory between 09:00 and 18:00 in order to reduce the peak load demand during this period.
• Simulation Scenario 3: determining the effect of the addition of solar power and battery power on the energy cost with a different battery schedule. The initial charging of the storage system is set to 500kWh. This gives the storage system a battery state of charge of 50 per cent. The storage system is set to generate 150kW of energy per hour for the factory between 08:00 and 10:00 and from 16:00 to 21:00, in order to reduce the peak load demand during these time periods. The safety charge is initiated when the state of charge (SOC) is below 30 per cent. The battery system is then charged by 200kW.
• Simulation Scenario 4: determining the effect on the energy cost of a TOU tariff structure.
• Simulation Scenario 5: determining the effect of power disruptions on the energy cost. This scenario was developed to determine the most cost-effective load-shedding remedy between a solar-battery system and a solar-generator system. Four of the eight load-shedding stages were simulated on the model to determine the effect on the cost.
5 MODEL VALIDATION
5.1 Stochastic base model validation
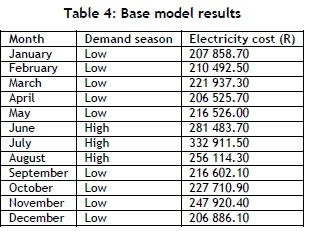
Table 4 displays a summary of the electricity costs per month as generated by the stochastic base model. This base model is run using the local municipality's tariff structure, generating an electricity bill of R207 858.70 for January. According to management, MONN's monthly electricity costs fall between R200 000.00 and R340 000.00. January typically has a low energy consumption. Running the base model for July generates an electricity bill of R332 911.50. July falls in a high demand season, so this high electricity cost is expected. The base model for October generates an electricity bill of R227 710.90. This is an expected cost for October, falling in the low demand season but with a higher energy usage than in January. From the electricity costs generated by the monthly base models, it is evident that the results fall within the expected ranges, and thus the base model is validated.
5.2 Simulation base model validation
Comparing the simulation base model with the stochastic base model, the results are identical. This is expected, as both models read the same data from the Excel spreadsheet, and calculate the electricity cost by multiplying the energy cost by the municipal energy consumption to meet the demand in the case of no power outages. This model is also validated, compared with the stochastic base model results, at the range given by MONN.
6 RESULTS
6.1 Different tariff structure
Given that the municipal tariff structure may change in the next few years, it is necessary to determine whether the solution proves to be relevant for a different structure. The current tariff structure in Harrismith is a flat rate charge. In Simulation Scenario 4, the effect of a TOU tariff structure is determined by the cost of a solar-municipal system. The TOU tariff structure included in the model is from the current tariff structure of a nearby town. The results from Simulation Scenario 4 show monthly total energy cost savings of over R6 200.00, and monthly electricity cost savings of over R30 000.00. Comparing the total energy cost results with the TOU base model results, the total cost savings would be a reality if the tariff structure changed to TOU in Harrismith in the next few years. For this reason, it is considered feasible to go ahead with installing a solar energy system.
6.2 Load-shedding remedy
Under load-shedding conditions, the remedy that generates the lowest energy costs over the course of a year is the solar-generator combination. This is represented by line B in the graph in Figure 4. The broken lines C and D, which represent the electricity costs of the load-shedding remedies, overlap almost perfectly. It is evident that the total energy cost of the solar-battery system (line A on Figure 4), with a peak in July at roughly R400 000.00, is much higher than that of the solar-generator system. Using the broken line as a reference, the solar-battery cost component is double that of the solar-generator cost component, which has its cost peak in July at R300 000.00. The more cost-effective load-shedding remedy is thus a solar- generator system.

6.3 Cost comparison
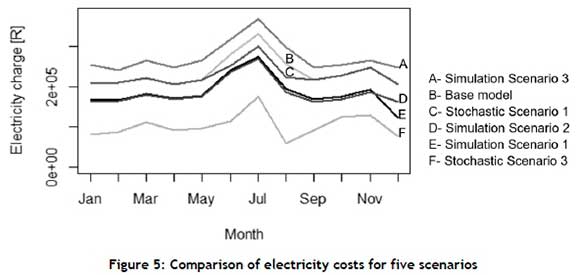
A cost comparison is conducted to visualise the difference between the base model and the scenarios tested. The costing results are plotted on one graph for relative comparison with each other and with the base model costs over one year. The scenarios with lower costs than the others are more favourable. The scenarios chosen to compare with the base model are flat rate models. The scenarios determining the effect of a TOU tariff structure and load-shedding cannot be compared with the base model in this way.
Figure 5 shows the electricity costs of the base model and five scenarios. The scenario with the lowest electricity cost is Stochastic Scenario 3, represented by line F, with a peak cost in July of under R200 000.00. This appears to be the best solution. Line D is just below line E, showing that both Simulation Scenarios 1 and 2 are potential solutions, as they fall below the base model line B. Stochastic Scenario 1, line C, overlaps with the base model for the low demand months, and falls below the base model from June to August. Simulation Scenario 3, line A, generates the highest electricity charge over the simulated period. It is not a feasible solution, because its electricity cost is higher than that of the base model. With the lowest total energy cost, Stochastic Scenario 3, is the most economically feasible scenario to implement at MONN.
6.4 Peak-shaving
The graph in Figure 6 contains the base model line A, which represents the current energy load of the factory. Line B represents the solar power generated per hour over the course of the day. Line C represents the energy generated by the generator. Line D represents the new municipal energy load. When line D is below line A, peak-shaving occurs.
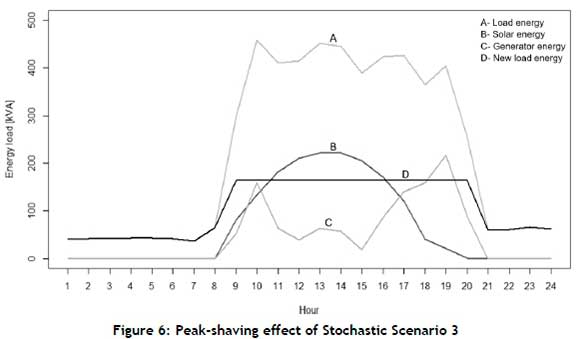
Figure 6 displays the most effective peak-shaving solution, where the peak energy load drops from 450kVA to 165kVA after consuming solar power and generator power. Stochastic Scenario 3 proves to be a feasible solution, as the aim of peak-shaving is achieved. This reduces the demand charge and energy charge components of the monthly electricity cost.
Taking all the analyses and peak-shaving results into account, Stochastic Scenario 3 proves to be the winning solution. In both the economical and practical analyses, Stochastic Scenario 3 generates the lowest total energy cost, electricity costs, and shaved peak. This system can be easily implemented, as the factory already owns a generator that can be used to reduce the peak loads. Installing a 250kVp solar system would generate a yearly income rather than being an expense.
6.5 Model comparison
The simulation model assumes the same hourly schedule for every day over a month, whereas the optimisation model generates a schedule that differs per hour over a month. The optimisation model can be more difficult to implement owing to the detailed hourly differences. In comparison, the simulation model assumes that the same schedule is applied per day over a month. This appears to be more practical in terms of implementation. In addition to this, what may make the simulation model favourable is that the user can easily test additional scenarios that would not necessarily be possible to perform on the stochastic model. An example of such a scenario is testing the effect of battery energy on the cost. In terms of cost minimisation, accuracy wins. The most appropriate model platform is the stochastic model.
7 CONCLUSIONS
7.1 Managerial implications
Management will decide whether to install a solar-generator system and the modelling platform they would like to use to test further the effect of scenarios on cost. The fact that fluctuating fuel prices play a role in the company's decision-making about using the generator means that the runner-up scenario is Simulation Scenario 1, which only requires a solar system to be installed. This demand charge of the system is not optimal, although it would be an improvement on the current system.
In the light of this study, the models it has developed could be used to solve cost minimisation for any industry, provided that the necessary data were available. The models are not limited to the situation at MONN, and could be used to minimise electricity costs at a different company or in a household in a different region.
7.2 Financial implications
Based on a cost analysis, the graph in Figure 7 was drawn up to display the financial savings of three tested systems. It is evident that, where the solar and solar-generator systems generate yearly incomes, the PV storage system costs money with relatively adequate electricity saving benefits. This is deduced by considering the broken lines C and D, where the line D overlaps with solid line E. The negative total savings make the PV-storage system unfavourable. Lines A and B show a positive total energy savings and electricity cost savings over ten years above that of the solar system. When comparing these three systems, the solar and solar-generator systems produce a yearly income. The solar-storage system costs almost R1 000 000.00 per year. It is concluded that the implementation of a solar-generator system is the most economically feasible solution.

REFERENCES
[1] Omarjee, L. 2018. The top ten municipal culprits not paying Eskom debt. [Online]. Available at: https://mg.co.za/article/2018-05-17-00-the-top-ten-municipal-culprits-not-paying-eskom-debt [Accessed 24 March 2019]. [ Links ]
[2] Wagener, R. 2017. The optimization of the Woodlam Furniture Factory with specific reference to its electricity consumption. Mini Dissertation. University of Pretoria. Available at: https://repository.up.ac.za/handle/2263/68400 [Accessed 19 March 2019]. [ Links ]
[3] Moolman, S. 2017. 350% increase in a decade: How expensive is electricity in South Africa compared to other countries? [Online]. Available at: http://www.poweroptimal.com/350-increase-decade-expensive-electricity-south-africa-compared-countries/ [Accessed 29 April 2019]. [ Links ]
[4] Winston, W.L. & Goldberg, J.B. 2004. Operations research: Applications and algorithms. Belmont, CA: Thomson/Brooks/Cole. [ Links ]
[5] Kall, P. & Wallace, S.W. 1994. Stochastic programming. Chichester: John Wiley & Sons. [ Links ]
[6] Li, H., Zang, C., Zeng, P., Yu, H. & Li, Z. 2015. A stochastic programming strategy in microgrid cyber physical energy system for energy optimal operation. IEEE/CAA Journal of Automática Sinica, 2(3), pp. 296-303. [ Links ]
[7] Hafiz, F., Anderson, R.d.Q. & Husain, I. 2017. Multi-stage stochastic optimization for a pv-storage hybrid unit in a household. 2017 IEEE Industry Applications Society Annual Meeting, pp. 1-5. [ Links ]
[8] LINDO Systems Inc. n.d. LINGO 18.0 - Optimization modeling software for linear, nonlinear, and integer programming. [Online]. Available at: https://www.lindo.com/index.php/products/lingo-and-optimization-modeling [Accessed 20 March 2019]. [ Links ]
[9] AnyLogic. n.d. Why use simulation modelling? [Online]. Available at: https://www.anylogic.com/use-of-simulation/ [Accessed 19 March 2019]. [ Links ]
[10] Ecotrades. 2016. Solar basics! [Online]. Available at: https://www.ecotrades.co.za/solar-info/ [Accessed 09 August 2019]. [ Links ]
[11] Goldstuck, D. 2018. A guide to understanding your electricity tariff. [Online]. Available at: https://www.solafuture.co.za/understanding-electricity-tarrif/ [Accessed 12 January 2019]. [ Links ]
[12] SEIA (Solar Energy Industries Association). n.d. Net metering. [Online]. Available at: https://www.seia.org/initiatives/net-metering [Accessed 1 May 2019]. [ Links ]
[13] SALGA (South African Local Government Association). 2018. Status of small scale embedded generation (SSEG) in South African Municipalities. [Online]. Available at: https://www.sseg.org.za/wp-content/uploads/2019/03/Status-of-Small-Scale-Embedded-Generation-in-Municipalities-October-2018.pdf [Accessed 1 May 2019]. [ Links ]
[14] Western Cape Government. 2017. Energy security game changer. [Online]. Available at: https://www.westerncape.gov.za/energy-security-game-changer/news/clean-energy-tax-incentives [Accessed 4 August 2019]. [ Links ]
[15] Mhuriyengwe, S. 2018. RSM South Africa: Tax incentives for saving the planet. [Online]. Available at: https://www.rsm.global/southafrica/news/tax-incentives-saving-planet [Accessed 4 August 2019]. [ Links ]
[16] De Villiers, P.J.D. 2014. Three comments on the levelized cost of energy (LCOE) calculations. Research paper. South Africa: University of Stellenbosch. [ Links ]
Submitted by authors 20 Feb 2020
Accepted for publication 16 Sep 2020
Available online 14 Dec 2020
* Corresponding author: sarma.yadavalli@up.ac.za
# The author was enrolled for a BEng degree in the Department of Industrial and Systems Engineering, University of Pretoria, South Africa

