


Services on Demand
Article
 English (pdf)
 Article in xml format
 Article references
Indicators

Related links
-
 Cited by Google
 -
 Similars in Google
Share

 Permalink
South African Journal of Industrial Engineering
On-line version ISSN 2224-7890
Print version ISSN 1012-277X
S. Afr. J. Ind. Eng. vol.31 n.3 Pretoria Nov. 2020
http://dx.doi.org/10.7166/31-3-2428
SPECIAL EDITION
Evaluating the impact of operational reports
L.A. Botes*; W. Hamer; D. Nell; P. Goosen; H.G. Brand
North-West University, CRCED-Pretoria, Pretoria, South Africa
ABSTRACT
New technological developments allow for an increase in data generation. There is a parallel increase in business intelligence systems. As a result, numerous operational reports are continuously developed to measure operational performance. Many studies state that data-driven reporting aids valuable decision-making. However, reports need to be evaluated to identify the extent of their impact on operations. This paper provides a review of current evaluation methods, which shows that user surveys are most commonly used. These surveys are limited, as they only indicate reporting quality. Little has been done to quantify the impact of reporting. In this paper, an evaluation method is developed that assesses both the qualitative and quantitative impacts of operational reports. This method is then applied to water management and energy management reporting case studies in the mining industry. The quantitative impact ranged from R0.5-million to R7.3-million and from R0.3-million to R65.0-million for the two case studies respectively.
OPSOMMING
Nuwe tegnologiese ontwikkelinge maak voorsiening vir 'n toename in die generering van data. Daar is 'n parallelle toename in sake-intelligensie stelsels. As gevolg hiervan word talle operasionele verslae deurlopend ontwikkel om bedryfsvertoning te evalueer. Baie studies noem dat data-gedrewe verslaggewing waardevolle besluitneming bevorder. Verslae moet egter evalueer word om die omvang van hul impak op bedrywighede te bepaal. Hierdie artikel gee n oorsig van huidige evalueringsmetodes, wat toon dat gebruikersopnames die meeste gebruik word. Hierdie opnames is beperk, aangesien dit slegs die gehalte van verslae aandui. Daar is min gedoen om die impak van verslaggewing te kwantifiseer. In hierdie artikel word n evalueringsmetode ontwikkel wat die kwalitatiewe en kwantitatiewe impak van operasionele verslae beoordeel. Hierdie metode word dan op gevallestudies van die bestuur van water en energie in die mynbedryf toegepas. Die kwantitatiewe impak het gewissel van R0.5 miljoen tot R7.3 miljoen en van R0.3 miljoen tot R65.0 miljoen onderskeidelik vir die twee gevallestudies.
1 BACKGROUND AND PROBLEM STATEMENT
Data is collected and used by information systems to produce data-driven reports and analyses, which in turn are used for managerial decisions [1]. There has been a rapid increase in data generation, and this trend will continue [2]. This increase is supported by the availability of various technologies that make data available from a variety of sources, allow data generation at high velocities, and so cause data to expand in volume [3]. Therefore it is expected that the development of reports to represent that data will increase too.
Vallurupalli and Bose [4] confirm the increase in performance measurement systems in recent times, and acknowledge the impact of the increased adoption of business intelligence (BI) on these systems. BI transforms raw data into valuable information [5], [6] by making use of various technologies to gather, analyse, and present data [7]. Presenting data can take place in various forms of reporting [7] (noon-reports / automated reports / dashboards and platforms) that are generally used to measure performance.
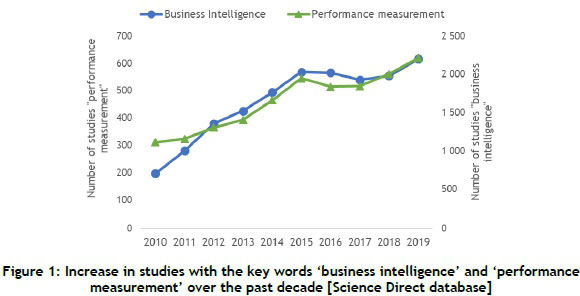
Figure 1 below shows a 99 per cent increase in studies with the key words 'business intelligence', and a 212 per cent increase in studies with the key words 'performance measurement' over the past decade. This supports the expected increase in reporting.
As data becomes more accessible, it becomes easier to compile reports (especially automated reporting and dashboards). If left unchecked, there may be multiple reporting products in an organisation without any way of evaluating whether such platforms are contributing to business objectives. It may also be difficult to determine whether reporting that is intended to achieve certain objectives is effective in doing so.
Numerous studies indicate that business advantages can be obtained by exploiting performance measurement methods [2], [8]-[12]. However, with the increase in available data and reporting measures, their impact needs to be assessed. Although many studies suggest that these measures aid in decision-making [1], [2], [10], they do not evaluate the impact of those decisions.
Mesaros et al. [1] highlight the importance of BI systems for quantitative measures such as business cost and profit. So the extent of the impact of operational reporting on operations need to be comprehensively assessed by considering both qualitative and quantitative measures. Figure 2 highlights the scope of this study in a basic reporting structure.
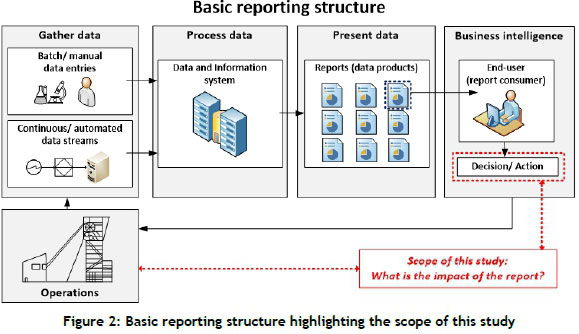
As shown in Figure 2, BI has three basic steps: gathering data, processing data, and presenting data [7]. Numerous technologies and forms of systems architecture can be applied to enable BI. The workings and design of these systems have been extensively described in the literature [13]-[15].
The scope of this study is focused on the consumer of operational reports and the actions that are enabled thereby. This paper is also focused on the mining sector, considering its importance in South Africa and its impact on the environment. Reports have been developed in several studies that are widely used for operational efficiency, including water [16] and energy management [17].
Reporting will need to have a traceable impact on operations if it is to be regarded as valuable. However, evaluating these impacts can be challenging, as described in the literature review in the next section.
This paper describes the development of a method to evaluate the impact of operational reports, based on the existing and relevant literature. The objectives of the developed method are to identify existing report evaluation methods and to combine them into a comprehensive evaluation method to gauge fully the qualitative and quantitative impact of operational reports. Finally, the evaluation method is applied to two reporting case studies to determine whether it is useful in practice.
2 RESEARCH METHODOLOGY
The problem statement was discussed in Section 1 : to evaluate the qualitative and quantitative impact of operational reports. To address this problem, this study makes use of the systematic literature review (SLR) method. An SLR is completed to obtain relevant information on how operational reports are evaluated in the literature (Section 2). The knowledge gained from the literature review is used to develop a new method to evaluate the impact of operational reports that consider both qualitative and quantitative aspects (Section 3). Last, the newly developed method is verified with real-world case studies (Section 4).
3 SYSTEMATIC LITERATURE REVIEW
A systematic literature review (SLR) is a procedural method used to identify and critically evaluate available research on a specific research topic [18]. An SLR is used in this paper to identify and assess how the impact of reports is evaluated in the literature. The knowledge gained from the SLR was then incorporated into a method to evaluate fully the impact of reports on operations (described in the next section).
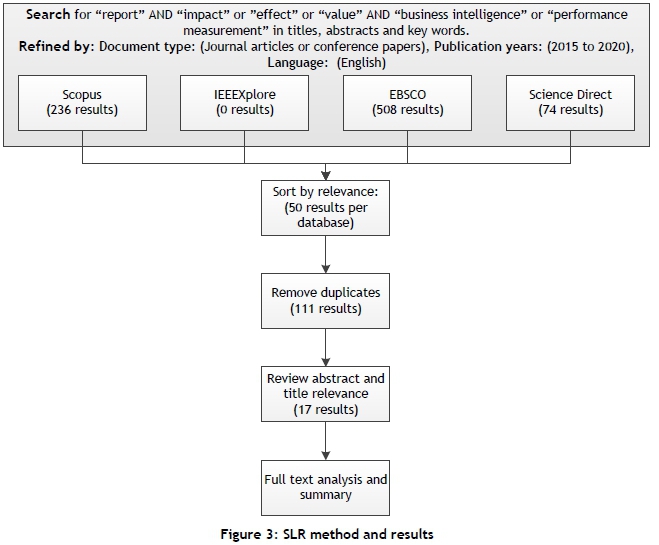
During an SLR, a step-by-step process is followed. These steps include conducting a search in databases based on relevant key words, filtering the results to ensure their relevance to the research topic, and summarising the final results [18], [19]. The SLR method followed in this paper is shown in Figure 3 and discussed thereafter.
Throughout the SLR the goal was to obtain studies relating to the impact of reports in the BI field. Therefore the chosen keywords were 'report', 'impact' or 'effect' or 'value', and 'business intelligence' or 'performance measurement'. The keywords were used to search four different credible databases (Scopus, IEEEXplore, EBSCO, and Science Direct). To ensure high-quality results, only journal articles and conference papers were considered. Results from 2015 to 2020 were considered to ensure that the latest studies were included. Last, only studies in English were included.
After the initial search, a large number of results was obtained. To refine this search to the most relevant studies, the database results were sorted according to relevance, and only the top 50 results per database were considered. Thereafter duplicate results were removed, which yielded a total of 111 results.
The title and abstract of each study were evaluated to establish their relevance before doing a full text analysis. Only studies in which a report was developed or evaluated or the impact of a BI system was evaluated were considered relevant. This delivered a total of 17 relevant studies. The low number of relevant studies indicate a gap in the evaluation of reports in the published literature.
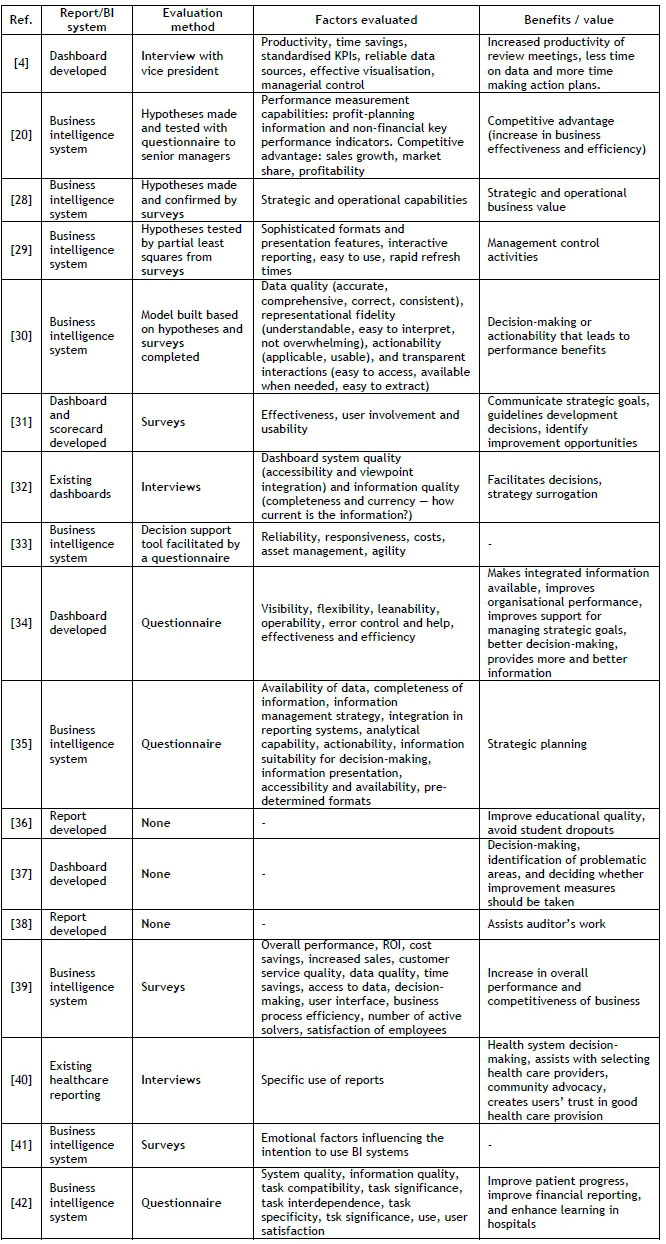
A full text analysis was done for each of the 17 relevant studies. The full text was screened to identify 1) whether a report was developed, 2) what method of evaluation was used, if any, 3) what reporting factors were considered during the evaluation, and 4) listed benefits or value achievable from the reporting / BI system. The full text analysis is shown in Appendix A, while a summary of the results is shown in Figure 4.
Of the 17 relevant studies, nine evaluated BI systems, and the remainder either developed a report or evaluated a report. While all BI systems were evaluated, not all reports were evaluated. This means that reports were developed but not evaluated afterwards. Where reports or BI systems were evaluated, the evaluation methods consisted exclusively of user surveys, questionnaires, and interviews.
Most factors considered in the evaluations were qualitative. Although some studies evaluated quantitative factors - such as time savings, profitability, and costs - they were all evaluated in a qualitative manner (e.g., whether profitability increased or decreased, without indicating by how much).
The evaluated qualitative factors can be grouped into three groups: data quality, information, and representation. Data quality factors are concerned with the quality of the data used in reports and BI systems. Information considers the relevance and actionability of the information displayed in reports. Representation factors evaluate the visualisations and interaction with the reporting measure.
Peters, M.D., Wieder, B., Sutton, S. & Wakefield, J. [20] considered quantitative factors in their evaluation, such as sales growth, market share, and profitability. However, these factors were still evaluated in a qualitative way and were not quantified. Most of the studies discuss the importance of reports to aid operational and managerial decision-making (Appendix A). However, none of these studies quantify the impact of the possible decision-making.
The reports have a direct impact on some of these decisions, such as beneficial operational changes and monitoring savings. Other impacts, such as compliance with guidelines and ensuring sustainable operations, are indirect. Thus, when quantifying the impact of operational reports, all possible decisions and benefits should be considered.
The SLR highlights that there is a need for a new report evaluation method that considers both the qualitative and the quantitative factors of reporting. In addition, quantitative factors should be quantified by considering the possible decisions and actions taken as a result of the report analysis. These evaluation aspects are necessary to gauge the impact of operational reporting fully. Such a method is developed in the next section.
4 DEVELOPMENT OF SOLUTION
The SLR showed that current evaluation methods mainly consist of user surveys. These surveys provide an indication of how useful the end-user finds the report in achieving certain objectives (i.e., the quality of a report). This study proposes the addition of quantitative evaluations to provide an indication of the actual business value of a report.
The combination of qualitative and quantitative evaluations identifies any mismatch between the two aspects of a report, and helps report developers to improve the reporting. For example, it is expected that a report that has high quantitative impact will also have a good qualitative score in order to be effective. Lower quality reports with a high quantitative impact give a clear indication of where improvements are required. Conversely, lower impact reports should have a lower priority when allocating development time and resources.
In this study, the impact of a report was evaluated with a survey, as suggested by multiple studies in the SLR. The survey was compiled to evaluate both qualitative and quantitative impacts of reports. The factors evaluated in the survey are shown in Table 1, and then discussed.
First, the survey considered the qualitative impact. In this study, 'qualitative impact' refers to the overall satisfaction of a user or consumer of a report. Questions were compiled from the qualitative factors evaluated in the literature. This included the data quality, information, and representation. A semantic differential scale was used to evaluate each qualitative factor (as proposed by Jetter, Eimecke & Rese, [21]). The scale consisted of a five-point rating scale with the direct opposites of each qualitative factor at each end.
Second, the survey evaluated the quantitative impact. In this study, 'quantitative impact' refers to a measurable benefit arising from reporting. Quantitative impacts consider time savings and impacts related to decision-making. Time savings can be a result of increased productivity or a decrease in the time spent in process analyses owing to the availability of the reports. All time savings will then be correlated with savings in wages in order to obtain a quantitative impact.
The survey also evaluated the quantitative impact of possible decisions made, or benefits obtained, as a result of the report. The possible decisions or benefits will vary for each specific report. The user was thus allowed to elaborate on these impacts in the survey, being asked to list both the direct and the indirect impacts arising from the report, and to indicate the estimated monetary impact.
Both the direct and the indirect impacts were included to obtain an indication of the cascading effects of the quantitative impact of reports. This resulted in a range of monetary impacts, from direct to indirect, associated with the report.
The method discussed in this section can be used to estimate the quantitative impacts of reports to evaluate their feasibility before they are developed. However, it can also be used after development to ensure that reports achieves their original intended purpose. An additional impact can then be added to the already-developed reports, based on actual events. This information can be used to motivate changes or expansions (or curtailment, in the case of over-reporting) to the existing reports.
In the next section, the method developed in this study is applied to case studies. This will show how the method is applied to actual situations in the South African mining industry.
5 EVALUATING THE IMPACT OF ACTUAL REPORTING CASE STUDIES
5.1 Overview of case studies
The primary sectors - such as farming, fishing, and mining - form a crucial part of the South African economy. Owing to the importance of these sectors, the case studies in this paper focus on one of them, the mining industry. The environmental impact of the mining industry, which is very resource-intensive, is undeniable [22].
In 2019, the South African mining industry contributed more than 38 per cent of the total industrial energy use [23]. According to Haggard, E.L., Sheridan, C.M. & Harding, K.G. [24], the total water consumption of the mining industry in 2010 was three per cent of all water used, and although it is not the highest consumer of water, the industry's effect on water quality is severe.
The mining industry needs to manage these resources to remain sustainable and to reduce its environmental impact. Accurate reporting can enable operations to monitor these valuable resources and identify opportunities to improve operations. Therefore the two case studies in this paper consider water management (Case study A) and energy management (Case study B).
5.2 Case study A: Water management
Water is a valuable resource, and industries need to manage it to enable sustainable use. This case study focused on an operational water reticulation report for a deep-level gold mine. In this study, water is cooled on the surface by chillers before being sent underground for various uses. These include cleaning stope faces, cooling hot air, cooling, and lubricating drilling equipment. The water is then stored and pumped back to the surface to maintain accessible and safe working conditions.
The basic reporting structure is shown in Table 2 (analogous to Figure 2). Throughout the water reticulation system, various water-flow and storage-level measurements are installed. The data is captured by the mine's supervisory control and data acquisition system (SCADA), from where the data is stored in a cloud-based database via an open platform communications (OPC) connection. An established reporting system can access the data, perform data analytics, and develop reports.
An automated PDF report was developed to monitor water use throughout the operation. The end-users receive the report daily via email. The main end-users are the shaft and services engineer, the energy management engineers, and the shaft senior engineering manager. Project engineers form part of the end-users, since they use the report to focus on the optimal and efficient operation of critical equipment that uses water.
Certain parameters are reported on, such as water usage intensity, volumes of water sent underground and back to the surface, water flow to various mining levels, water use in critical equipment, and exceeded water storage limits.
Survey results
To test the functionality of the survey, it was sent to selected main end-users - three project engineers. The qualitative survey results are shown in Figure 5, with the minimum and maximum indicated. The results show that the qualitative factors are rated high by report users. The survey questions were derived from the SLR (listed in Table 1).
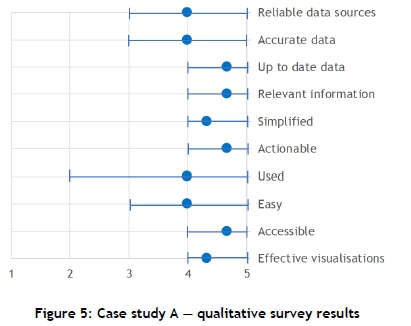
All the end-users agreed about the time saved by using the report to analyse operations and to do fault finding. The average time savings were converted to an annual monetary saving by considering the average salary of a mining engineer in South Africa. This amounted to R 0.5-million annually. Overall, the end-users gave a high rating to the report's quality, which indicated that the report likely had a time-saving impact for the users.
Using the report for fault finding had a significant direct impact on energy savings for pumping and cooling, which can be up to R 0.3-million per incident. In extreme cases, when faulty operations can lead to a loss in production shift and the report could be used to rectify the problem in time, an avoided cost of R 6.6-million per day could be obtained. The cumulative impacts are presented in Figure 6.
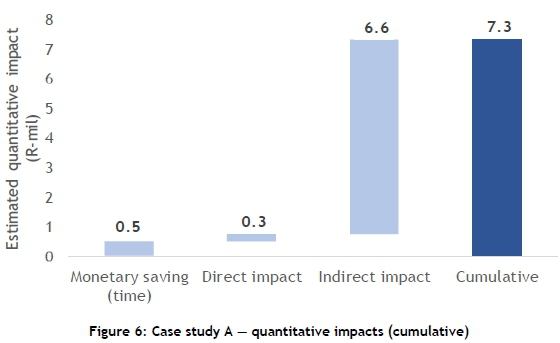
It is important to note that the values in Figure 6 are the perceived benefit from the survey's respondents. Although potentially subjective, the values are considered reliable, since the survey's respondents were relevant, qualified, and experienced personnel.
From Figure 6 it can be seen that the direct and monetary impact of the report is much lower than the indirect impact. Note that the indirect impact shown above is for extreme cases, which means that the monetary and direct impacts are more likely to be achieved on a day-to-day basis.
The high possible indirect impact motivates the continued use of the report, while the lower direct impact indicates that report usability should be improved to increase this value. This is motivated by the qualitative evaluation (Figure 5), which indicates that the report is not used as much by all the survey's respondents (the largest difference between maximum and minimum rating).
It is recommended to meet regularly with all report end-users and to discuss value-added incidents from the report to improve the report's usability in future. This is expected to lead to an increase in the direct impacts of the report.
5.3 Case study B: Energy management
South African deep-level gold mines have faced a decrease in productivity and an increase in operational costs in recent years [25], [26]. A significant contributor to the increased costs is the industry's dependence on electricity, together with increases in electricity prices [26]. This makes electricity an important resource to manage in deep-level gold mines. Case study B therefore considers energy management reporting for a range of deep-level gold mines.
The basic reporting structure is shown in Table 3 (analogous to Figure 2). Numerous electricity meters are installed to monitor the use of critical equipment. The data is captured by various electricity meters, and is ultimately stored in a cloud-based database. The database is accessible via a reporting system that is used to develop energy management reports.
As part of the reporting initiative, two types of report are automatically generated in PDF and sent to end-users via email. The first is project savings reports that are generated once a month and used to provide feedback on the performance of specific energy-saving projects. These reports include parameters such as average daily electricity profiles, daily cost savings, daily energy use, and a distribution of electricity consumption according to Eskom's time-of-use periods.
The second is month-to-date budget tracking reports that are mainly used to monitor how far under or over budget a shaft's electricity use is for each of its critical consumers. The reports are sent to end-users once a week. These reports contain electricity consumption information, which is compared with the budgets for each critical consumer of a shaft.
This reporting initiative provides end-users with an overview of the electricity consumption of their operations. The main end-users of the reports include shaft and services engineers, energy management engineers, and shaft senior engineering managers.
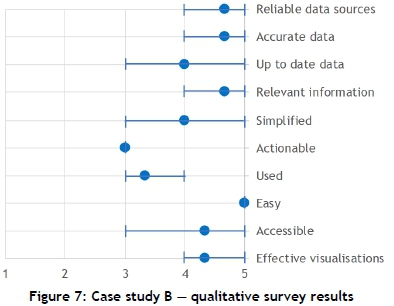
Survey results
Three energy management engineers were asked to complete the surveys in order to test their functionality. From the qualitative survey results in Figure 7 it can be seen that most of the qualitative factors were rated high. The actionability and usability of the reports received the lowest rating among the qualitative factors. This indicates that, although the reports consist of relevant information that is easily interpreted to provide energy awareness, they are not exclusively used to develop action plans or make decisions.
The survey results show that end-users indicated that the availability of reports results in time savings when gathering, processing, and analysing the energy-related data. This was converted to a monetary saving, considering the average salary of a South African mining engineer. This resulted in an estimated R 0.3-mil annual impact as a result of time savings. Although the usability of the report was not rated very high, the estimated impact owing to time savings is deemed conservative, considering that the reports go out to multiple shafts and have multiple end-users.
The survey results indicated that the weekly month-to-date performance tracking reports have been used to identify abnormal energy use so that immediate action could be taken. The reports have also been used to maintain the performance of energy-saving initiatives. This results in an annual total cost savings of R 62.5-million, and is a direct impact of the reporting.
As an indirect impact of the reports, the results have also been used to verify electrical metering anomalies - one of three systems used to track electricity consumption. In a specific case, this resulted in finding a billing mistake that, when corrected, resulted in a recovered cost of R 2.2-million. The cumulative impacts related to the energy reporting discussed in this section are shown in Figure 8.
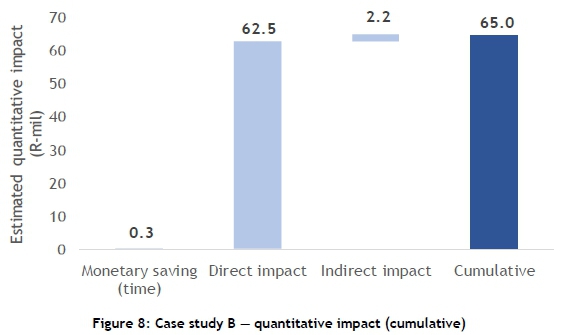
Figure 8 shows a high direct impact and lower monetary and indirect impacts. This indicates that the impacts on a day-to-day operational basis are significant for these reports. And this direct impact may be even higher when report developers aim to improve the lower qualitative rating received for report actionability (Figure 7).
Alternatively, the high direct impact indicates that development resources can be spent elsewhere instead of improving report actionability, since the direct monetary impact is already significant.
6 DISCUSSION OF RESULTS
The survey developed in this paper can easily be used by report end-users to evaluate operational reports. This method allowed the impact of a water management report and energy management reports in the mining industry to be evaluated. First, qualitative factors were evaluated, providing a clear indication of the reports' strengths and weaknesses, and allowing report developers to identify where improvements were required.
Second, quantitative impacts were also evaluated. Quantifying this impact was valuable for the stakeholders involved to help them understand the function and intended effects of the reports. And by evaluating both the qualitative and the quantitative impacts, a mismatch was identified that also indicated areas for improving the reports.
Case study A identified that report usability could be improved on, leading to increased direct monetary impacts. Case study B's results showed a low report actionability qualitative rating, but a high quantitative direct impact. This indicated that development resources could rather be spent elsewhere, since high quantitative impacts were already obtained.
It should also be noted that quantifying the impacts related to reporting is a challenging task, and impacts such as avoided costs remain subjective. In this paper, highly relevant, qualified, and experienced end-users provided these quantitative measures of impact, and so they can be seen as a sufficient indication of the quantitative impacts.
As a recommendation for further work, standardised performance quantification methods can be used to improve the objectivity of the results (which can be based on established protocols [27]). The sample size of the survey can also be increased to verify the functionality of the survey. In this study, the case study reports had very specific end-users, and only three end-users were considered per case study. More end-users should be considered to obtain more accurate results.
7 CONCLUSION
The objective of this paper was to develop a comprehensive method to evaluate the qualitative and quantitative impact of operational reports. A systematic literature review was completed to identify how the existing literature evaluates the impact of reports. It was found that surveys are the most common method of report evaluation. However, most studies focused on the qualitative factors of reports, and rarely considered the quantitative factors.
A survey was therefore developed for this paper to evaluate both the qualitative and the quantitative factors of operational reports. The survey was tested on two case studies in the South African deep-level gold mine industry. First, an underground water management report was considered. It was found that this report had highly rated qualitative factors that could be used to develop action plans and assist decision-making. This resulted in cumulative quantitative impacts ranging from R 0.5-million to R 7.3-million.
Second, the energy management reporting of multiple shafts was evaluated. The evaluation showed that most qualitative factors were rated high, with the actionability and usability of the reports obtaining an average rating. However, the quantitative evaluation indicated that, when the reports were actioned, significantly high quantitative impacts could be obtained. These impacts ranged from R 0.3-million to R 65.0-million.
In conclusion, a method was derived to evaluate both the qualitative and the quantitative impacts of operational reports. The method provides clear communication with involved stakeholders, and allows report developers to identify areas for improvement.
ACKNOWLEDGEMENTS
This work was sponsored by ETA Operations (Pty) Ltd.
ORCID® identifiers
L.A. Botes: https://orcid.org/0000-0003-3194-7224
W. Hamer: https://orcid.org/0000-0002-0481-3098
D. Nell: https://orcid.org/0000-0002-2817-9343
P. Goosen: https://orcid.org/0000-0002-5744-5268
H.G.Brand: https://orcid.org/0000-0002-2499-4287
REFERENCES
[1] Mesaros, P., Behunova, A., Mandicak, T., Behun, M. & Krajnikova, K. 2019. Impact of enterprise information systems on selected key performance indicators in construction project management: An empirical study. Wireless Network, (June), pp. 1-8. [ Links ]
[2] Mujawar, S. & Joshi, A. 2015. Data analytics types, tools and their comparison. International Journal of Advanced Research in Computer and Communication Engineering, 4(2), pp. 488-491. [ Links ]
[3] Li, Y., Thomas, M.A. & Osei-Bryson, K. 2016. A snail shell process model for knowledge discovery via data analytics. Decision Support Systems, 91, pp. 1 -12. [ Links ]
[4] Vallurupalli, V. & Bose, I. 2018. Business intelligence for performance measurement: A case based analysis. Decision Support Systems, 111, pp. 72-85. [ Links ]
[5] Larson, D. & Chang, V. 2016. A review and future direction of agile, business intelligence, analytics and data science. International Journal of Information Management, 36(5), pp. 700-710. [ Links ]
[6] Al-Hadad, Y. & Zota, R.D. 2016. Implementing business intelligence system - Case study. Database Systems Journal, VII(1), pp. 35-44. [ Links ]
[7] Burstein, F. & Holsapple, C.W. 2008. International handbook on decision support systems 2. Berlin: Springer Science & Business Media. [ Links ]
[8] Nagorny, K., Lima-Monteiro, P., Barata, J. & Colombo, A.W. 2017. Big data analysis in smart manufacturing : A review. International Journal of Communications, Network and System Sciences, 10, pp. 31-58. [ Links ]
[9] Chen, H., Chiang, R.H.L. & Storey, V.C. 2012. Business intelligence and analytics: From big data to big impact. MIS Quarterly, 36(4), pp. 1165-1188. [ Links ]
[10] Riabacke, A., Larsson, A. & Danielson, M. 2014. Business intelligence in relation to other information systems. In International Conference on Advances in ICT for Emerging Regions, Colombo, December 10-14, pp. 103-108. [ Links ]
[11] Gangadharan, G.R. & Swami, S.N. 2004. Business intelligence systems : Design and implementation strategies. In 26th International Conference of Information Technology Interfaces (ITI), Cavtat, June 7-10, pp. 139-144. [ Links ]
[12] Lautenbach, P., Johnston, K. & Adeniran-Ogundipe, T. 2017. Factors influencing business intelligence and analytics usage extent in South African organisations. South African Journal of Business Management, 48(3), pp. 23-34. [ Links ]
[13] Wu, B. & Qin, L. 2011 . Design and implementation of business-driven BI platform based on cloud computing. In IEEE International Conference on Cloud Computing and Intelligence Systems, Beijing, 2011, pp. 118-122. [ Links ]
[14] Zhang, Y., Ma, H. & Xu, Y. 2013. An intelligence gathering system for business based on cloud computing. In 2013 Sixth International Symposium on Computational Intelligence and Design, Hangzhou, October 28-29, pp. 201 -204. [ Links ]
[15] Somya, R., Manongga, D. & Pakereng, M. 2018. Service-oriented business intelligence (SoBI) for academic and financial data integration in university. In 2018 International Seminar on Application for Technology of Information and Communication, Indonesia, September 21-22, pp. 1-5. [ Links ]
[16] Ngwaku, S.R. 2019. A strategy for potable water conservation in gold mines. Master's dissertation. North-West University. [ Links ]
[17] Ferreira, A., Peach, P.F. & Van Rensburg, J. 2019. Alternative data structures for improved energy reporting and budgeting on gold mining group operations. In Proceedings of the South African Institute for Industrial Engineers Annual Conference, Port Elizabeth, 30 September - 2 October, pp. 403-417. [ Links ]
[18] Roux, R.N., van der Lingen, E. & Botha, A.P. 2019. A systematic literature review on the titanium metal product value chain. South African Journal of Industrial Engineering, 30(3), pp. 115-133. [ Links ]
[19] Jooste, A.F., de Kock, I.H. & Musango, J.K. 2019. A systematic literature review of sustainable urban planning challenges associated with developing countries. South African Journal of Industrial Engineering, 30(3), pp. 253261. [ Links ]
[20] Peters, M.D., Wieder, B., Sutton, S. & Wakefield, J. 2016. Business intelligence systems use in performance measurement capabilities: Implications for enhanced competitive advantage. International Journal of Accounting Information Systems, 21, pp. 211 -17. [ Links ]
[21] Jetter, J., Eimecke, J. & Rese, A. 2018. Augmented reality tools for industrial applications: What are potential key performance indicators and who benefits? Computers in Human Behaviour, 87(October), pp. 18-33. [ Links ]
[22] Carvalho, F.P. 2017. Mining industry and sustainable development: Time for change. Food and Energy Security, 6(2), pp. 61-77. [ Links ]
[23] South African Government News Agency. 2019. Call for mining industry to adopt energy efficiency measures. Available: https://www.sanews.gov.za/south-africa/call-mining-industry-adopt-energy-efficient-measures. [Accessed: 08-Jun-2020]. [ Links ]
[24] Haggard, E.L., Sheridan, C.M. & Harding, K.G. 2015. Quantification of water usage at a South African platinum processing plant. Water SA, 41(2), pp. 279-286. [ Links ]
[25] Nell, D. 2017. Optimising production through improving the efficiency of mine compressed air networks with limited infrastructure. Master's dissertation. North-West University. [ Links ]
[26] Peach, P.F.H. 2016. Optimising deep-level mine refrigeration control for sustainable cost savings. Master's dissertation. North-West University. [ Links ]
[27] Efficiency Valuation Organisation. 2001. International performance measurement & verification protocol: Concepts and options for determining energy and water savings, Volume 1, pp. 1-89. [ Links ]
[28] Fink, L., Yogev, N. & Even, A. 2017. Business intelligence and organizational learning: An empirical investigation of value creation processes. Information & Management, 54(1), pp. 38-56. [ Links ]
[29] Peters, M.D., Wieder, B. & Sutton, S.G. 2018. Organizational improvisation and the reduced usefulness of performance measurement BI functionalities. International Journal of Accounting Information Systems, 29(C), pp. 1 -15. [ Links ]
[30] Torres, R. & Sidorova, A. 2019. Reconceptualizing information quality as effective use in the context of business intelligence and analytics. International Journal of Information Management, 49(December), pp. 316-329. [ Links ]
[31] Lea, B., Yu, W. & Min, H. 2018. Data visualization for assessing the biofuel commercialization potential within the business intelligence framework. Journal of Cleaner Production, 188(July), pp. 921-941. [ Links ]
[32] Reinking, J., Arnold, V. & Sutton, S.G. 2020. Synthesizing enterprise data to strategically align performance: The intentionality of strategy surrogation. International Journal of Accounting Information Systems, 36(March), pp. 115. [ Links ]
[33] Peiris, K.D.A., Jung, J. & Gallupe, R.B. 2015. Building and evaluating ESET: A tool for assessing the support given by an enterprise system to supply chain management. Decision Support Systems, 77(September), pp. 41-54. [ Links ]
[34] Scholtz, B., Calitz, A. & Haupt, R. 2018. A business intelligence framework for sustainability information management in higher education. International Journal of Sustainability in Higher Education, 19(2), pp. 266-290. [ Links ]
[35] Calitz, A., Bosire, S. & Cullen, M. 2018. The role of business intelligence in sustainability reporting for South African higher education institutions. International Journal of Sustainability in Higher Education, 19(7), pp. 11851203. [ Links ]
[36] Villegas-Ch, W., Luján-Mora, S. & Buenaho-Fernandez, D. 2018. Towards the integration of business intelligence tools applied to educational data mining. In 2018 IEEE World Engineering Education Conference (EDUNINE), Buenos Aires, March 11-14, pp. 1 -5. [ Links ]
[37] Loreto, P., Fonseca, F., Morais, A., Peixoto, H., Abelha, A. & Machado, J. 2017. Improving maternity care with business intelligence. In 2017 5th International Conference on Future Internet of Things and Cloud Workshops, Prague, August 21-23, pp. 170-177. [ Links ]
[38] Che, L., Yang, X. & Jiang, F. 2017. Application and research on business intelligence in audit business. In 13th Global Congress on Manufacturing and Management, Zhengzhou, November 28-30, pp. 1-6. [ Links ]
[39] Mesaros, P., Carnicky, S., Mandicak, T., Habinakova, M., Mackova, D. & Spisakova, M. 2016. Business intelligence impact on corporate performance in Slovak enterprises - a case study. Journal of Systems Integration, 7(4), pp. 9-18. [ Links ]
[40] Johnston, S., Abelson, J., Wong, S.T., Hogel, M., Burge, F. & Hogg, W. 2019. Citizen perspectives on the use of publicly reported primary care performance information: Results from citizen-patient dialogues in three Canadian provinces. Health Expectations, 22(5), pp. 974-982. [ Links ]
[41] Chang, Y., Hsu, P. & Wu, Z. 2015. Exploring managers' intention to use business intelligence: The role of motivations. Behaviour & Information Technology, 34(3), pp. 273-285. [ Links ]
[42] Gaardboe, R. & Svejvig, P. 2018. Better and more efficient treatment: The individual and organizational impacts of business intelligence use in health care organizations. Selected papers of the IRIS, (9), pp. 1 -7. [ Links ]
* Corresponding author: lbotes@researchtoolbox.com
APPENDIX A: FULL TEXT ANALYSIS OF SLR RELEVANT STUDIES

