


Services on Demand
Article
 English (pdf)
 Article in xml format
 Article references
Indicators

Related links
-
 Cited by Google
 -
 Similars in Google
Share

 Permalink
South African Journal of Industrial Engineering
On-line version ISSN 2224-7890
Print version ISSN 1012-277X
S. Afr. J. Ind. Eng. vol.31 n.3 Pretoria Nov. 2020
http://dx.doi.org/10.7166/31-3-2425
SPECIAL EDITION
Modelling the tendencies of a residential population to conserve water
C. Searle*; V.E. Harper
Department of Industrial Engineering, University of Stellenbosch, South Africa
ABSTRACT
Water scarcity is both a global and a local phenomenon. In order to address this, investigations into water demand management strategies and the conservation tendencies of a population are imperative. This paper investigates the tendencies of a residential population in the City of Cape Town to conserve water in response to certain demand management strategies, using an agent-based simulation approach. The model allows for the population in a ward of interest to be defined by certain attributes, such as income level and access to information. The user may trigger certain demand management strategies during the simulation run, and visually explore the changes in environmental awareness and conservation tendency of the user-defined population. The model has the ability to be used as an investigative tool to explore the effect of different water demand management strategies on the tendencies of households in different wards of Cape Town to conserve water.
OPSOMMING
Water skaarsheid is beide 'n globale en lokale verskynsel. Ondersoeke na wateraanvraag bestuur strategieë en die besparingneigings van 'n populasie is belangrik om die verskynsel aan te spreek. Hierdie artikel ondersoek die tendense van 'n residensiële bevolking in die Stad van Kaapstad om water te bespaar in reaksie op n sekere aanvraag bestuurstrategie deur middel van n agent-gebaseerde simulasie benadering. Die model maak voorsienning dat die bevolking in 'n betrokke wyk gedefinieer kan word aan die hand van kenmerke soos inkomste en toegang tot informasie. Die gebruiker kan dan aanvraag bestuurstrategieë aktiveer tydens die simulasie en die veranderinge in die omgewingsbewustheid en besparingsneigings van die bevolking visueel ondersoek. Die model bied die vermoë om ondersoeke na die invloed van verskillende wateraanvraag bestuurstrategieë te ondersoek en om die neigings jeens waterbesparing van huishoudings in verskillende wyke in Kaapstad te ondersoek.
1 INTRODUCTION
A combination of rising global population, economic growth, and climate change has ensured that, in the last 50 years, global water demand has increased six-fold [1]. A rising global population, economic prosperity, and industrial growth demand more water than ever before, while climate change compounds the issue of water scarcity [2].
South Africa is classified as a semi-arid country that is becoming increasingly arid owing to the increase in temperature and the variability and decrease in rainfall. This implies that fresh water supplies are scarce, and that further management strategies, especially demand management strategies, must be investigated, optimised, and implemented [3]. Water demand management strategies, along with supply-side strategies, have been integrated and implemented in Cape Town for many years. A demand management measure may be considered as any activity, practice, technological device, law, or policy that aims to promote conservation and reduce water use [4]. Supply-side strategies cannot be wholly relied on to satisfy increasing urban demand, and therefore demand-side strategies must be investigated, optimised, and implemented to ensure the long-term availability and sustainability of water [3].
Following the implementation of augmented management policies, it is expected that people will make an effort to conserve water and demand less from limited reserves. Predicting the expected tendency of a population to conserve water would be extremely useful, although greatly challenging. When attempting to predict human intentions and behaviour, both external and internal probabilistic factors exist that lead to stochastic results. The various dispositions of households owing to geographic, economic, social, political, and cultural factors are difficult to scale, and their tendency to conserve water based on these factors requires a dynamic approach [5].
A simulation model is therefore proposed in this paper, with the aim of representing the tendency of households in any residential ward to conserve water in times of water scarcity, with a specific focus on the City of Cape Town. The proposed agent-based model will reasonably reflect rising awareness and intentions to conserve water in response to certain demand management strategies, in a user-defined population. This model is intended to be used as a tool for policy-makers and analysts to identify trends in water conservation intentions, and to explore further the effectiveness of different demand management strategies in various sets of populations.
After this introductory section, the remainder of the paper comprises a concise review of the literature in the realms of water demand and conservation, agent-based simulation modelling and existing models in this domain, a description of the proposed agent-based model and, finally, a discussion of the model's output.
2 CONCISE LITERATURE ON WATER CONSERVATION, AGENT-BASED SIMULATION MODELLING, AND EXISTING MODELS
A concise review of the literature, along with key aspects, is presented in this section. The discussion focuses on water demand and various conservation strategies particular to Cape Town; the physical and external factors that influence the water demands of people and households; agent-based computer simulation modelling; and existing models for water demand and conservation.
2.1 Water demand and conservation
In Cape Town, domestic consumption of water accounts for two-thirds of the city's water demand [6, 7]. The increasing demand, coupled with decreasing rainfall, causes Cape Town to be a water stressed city. In 2001, severe restrictions, which were expected to be repeated with increasing regularity and severity in the coming years, were placed on domestic water use [8]. In 2006 another drought period was experienced, resulting in severe restrictions and other demand management strategies. It appears that the 10 per cent curtailment measures (restrictions, tariffs, and awareness campaigns) imposed in 2001 achieved a 15 per cent decrease in water demand and, in 2006, the 20 per cent curtailment achieved a 20 per cent reduction in demand. These are, however, estimated approximations, as exact information about the restrictions' direct impact is not available [7]. The water supply and demand system is complex and constantly changing, making adequate quantitative data very difficult to accumulate and verify. The Cape Town government, nevertheless, makes significant attempts to understand the water scarcity issue, and regularly uses water conservation strategies to ensure water sustainability [8]. In 2015 dam levels reached a critical stage, and water restrictions for agriculture and domestic use were enforced [9]. This was the start of a drought that Cape Town and its surrounding area would endure for more than four years.
The water demand management strategies implemented in the urban city of Cape Town include, among others, restrictions (on outdoor and indoor activities), tariffs (that respond rapidly to supply levels), reducing leaks (decreasing treatment and distribution costs), pressure management (reducing water lost through leaks), and awareness campaigns via the media and pamphlets [6].
2.2 Human tendencies and behaviour relating to water demand and conservation
Numerous internal and external attributes affect a household's water consumption and its participants' inclination to conserve water. A household is typically made up of homogeneous individuals with similar attributes who display similar behavioural patterns, such as water use and conservation tendencies. A person's characteristics dictate their behaviour, which in turn influences their water demand [5]. Understanding consumer behaviour is considered an effective starting point for managing energy conservation and, by extension, water conservation.
The income of an individual, or the mean income of a household, plays a significant role in water consumption: high-income households tend to use considerably more water than low-income households [10, 11]. Water demand and water-use patterns are further influenced by household demographics - such as the number of individuals, the age structure, and the relationships between members - and structural attributes, such as the house size, garden size, and access to first-world sanitation, which includes bathrooms, washing machines, showers, and flushing toilets [10]. The inclination to use water efficiently is largely dependent on a household's knowledge of implemented conservation policies and practices, as well as their awareness of their own social and physical environment [12].
Apart from these extrinsic attributes, certain intrinsic factors are at play as well. A person with a propensity to care actively for things besides themselves is more likely to adopt pro-environmental behaviour [13]. According to Kollmuss and Agyeman [14], the complex of 'pro-environmental consciousness' is made up of environmental knowledge, values, attitudes, and emotional involvement. Human behaviour relative to water conservation, among other domains, is often influenced by cognitive biases and tendencies that seem irrational in the view of traditional economic models [15].
2.3 Computer simulation and agent-based modelling
Modelling is a way of solving problems that occur in the real world. It is a method for virtual experimentation on real systems, and is most valuable when real experimentation is expensive, dangerous, or highly complex [16]. The purpose of simulation modelling is to understand better the behaviour of these real-world systems. It is an indispensable problem-solving technique that serves as a tool to describe and analyse the behaviour of a system. Simulation models also provide useful information about potential implementation strategies and certain system capabilities, capacities, and behaviours without needing actual construction or implementation of a process in the real world [17].
There are three major approaches or paradigms for building a simulation model. These differ in their abstraction level and general framework. Abstraction, which refers to the complexity that a real world system is observed to have, is mapped into the model form. The discrete event paradigm has a low to mid-level abstraction, which means that small system components are investigated in detail. The system dynamics paradigm has a high level of abstraction, which means that the entire system is considered and simplified or aggregated. Finally, the agent-based paradigm is used across all levels of abstraction, meaning that agents may model objects of varying scales and natures [16].
Agent-based modelling (ABM) is a relatively new simulation modelling paradigm, developed in the early 2000s [17]. This bottom-up approach can be used in simulating dynamic processes comprising individual, autonomous, decision-making, interacting entities called 'agents' [18]. Agent-based models have the ability to capture emergent phenomena that result from multiple agent interactions over time. Even simple models in which agents are described by deterministic rules can lead to coherent group behaviour that is not explicitly programmed in the models [18].
2.4 Existing models in the context of water conservation
Numerous studies have used models to depict water demand and patterns of water usage in urban environments. Models used to forecast water demand with non-linear time series data include artificial neural networks, projection pursuit regression, multivariate adaptive regression splines, random forests, and support vector regression [19]. A simulation modelling framework is also often used to develop informative models that provide qualitative and quantitative insight into water demand and conservation behaviour [20].
A study by Olmstead and Stavins [11] used research and analysis to predict the effects of pricing and regulations on the behaviour of water consumers. Olmstead and Stavins [11] concluded that pricing strategies were the most cost-effective; however, a statistical model by Hoffman, Worthington and Higgs [21] indicated that residential water demand is mostly price inelastic. Hoffman et al. [21] found that pricing strategies may work in the short run for drought periods, but in the long term non-price strategies are more effective. These strategies may include public education campaigns, rationing, water restrictions, and subsidisation of water-efficient technologies. Interestingly, another insight gained from Hoffman's mathematical model is that water use is less than proportional to household size [21].
The system dynamics approach was used by Sahin [20] to evaluate the effect of supply-based pricing schemes on water consumption in an urban area. The model found that integrating demand and supply management strategies can efficiently provide water security in the future. In a similar study by Sahin [22], it was demonstrated that a price structure based on the inclining block tariff can lead to behavioural change and reduced water consumption in drought periods, especially in consumers who use large amounts of water. Sahin implies that adopting water restrictions would increase total water savings more than any fair pricing strategy.
A study conducted by Ali, Shafiee and Berglund [23] modelled the dynamics of urban water supply and household consumption in response to drought-induced water regulations. It is a predictive model that uses the agent-based approach to investigate the effectiveness of water regulations. It recommends prescriptive drought policies to improve the sustainability of urban water resources. It does not, however, model economic variables, household attitude towards conservation, or communication between agents.
An article by Levy, Martens and Van der Heijden [24] emphasises the value of ABM in urban dynamics and planning. It acknowledges the suitability of ABM to explain complex systems and urban change. It states that cities are not in equilibrium, and are capable of local self-organisation, from which global behaviour arises, which correlates with the purpose of ABM. A complex adaptive system, ubiquitous in large cities, is described by Ali et al. [23:p421] as "a system composed of a large network of decentralized actors without a centralized controller and with the capability to adapt to a changing environment". A prime example of a complex adaptive system would be the water supply-demand system and its beneficiaries in an urban environment. ABM is appropriate in modelling complex adaptive systems when the predisposition and behaviour of the decentralised actors are known; and therefore ABM is appropriate for modelling the inclination of households to conserve water in an urban environment.
3 AN AGENT-BASED MODEL DEPICTING THE TENDENCY OF AN URBAN POPULATION TO CONSERVE WATER
The agent-based simulation model aims to reflect the real-world tendencies of households to conserve water in response to demand management strategies. It assumes that people, and by extension households, have a particular tendency to conserve water resulting from interrelated internal characteristics and external circumstances. The model incorporates the households' environmental awareness by including it as a factor in determining whether the households actively care and conserve water. Depending on the configuration of its attributes, a household may have different levels of awareness from those of other households in their environment, the seasons, water scarcity issues, and the demand management strategies in place.
The model is designed to illustrate the dissemination of strategies and the number of households that are adequately inclined to conserve water in a user-defined ward of Cape Town. A low tendency actively to conserve water results from a configuration of attributes that are unfavourable to conservation, as well as insufficient awareness. A high tendency to conserve water results from a favourable configuration of attributes and an awareness of the environment, which means that the household is aware of any demand management strategies in place, and so may respond to them. High intentions, however, do not always translate into action, and the model is developed to represent the intentions of households actively to conserve water, and not actual water savings, although the two measures do correlate.
The design and development of the agent-based model was conducted in the AnyLogic Personal Learning Edition 8.2.3 software suite. This is a multi-method simulation modelling tool that enables modellers from many industries to gain deeper insights into complex systems and processes [25]. AnyLogic has a multifaceted set of tools that allow the development and visualisation of a complex simulation. It makes use of the Java computing language to program the details of the simulation.
3.1 Modelling assumptions and core concepts
The development of a model based on human disposition and behaviour raises many challenges and important considerations. Filtering the quantitative data and the insightful qualitative data proved to be a challenge, as was the consolidation of that data to form an understanding of the characteristics affecting water conservation tendencies. The synthesising of data from the simulation model back into real-world information requires a clear understanding of the limitations of a computer model. The assumptions considered in the simulation model relate to the aggregation of the agent, the input data, the time, and the location. The core concepts and their scope include the agent attributes and demand management strategies that were considered.
3.1.1 Household agent
The proposed model considers the active agent to be one household. A person's behaviour is aggregated into that of a household, based on the reasonable assumption that individuals who live together will have similar values and conservation behaviours. The aggregation of people into households reduces the number of agents per ward in the Cape Town region. In 2016, there were an estimated 1 264 849 households in the Cape Town region, which can be depicted as about 9 715 households per ward [26]. The model assumes that the number of households in a ward, specified by the user, is static over the simulated year.
3.1.2 Data
In the model, logical assumptions have to be made owing to the lack of available statistical data about household water consumption and behaviour in response to demand management strategies. According to Dziegielewski [4], current research programmes and data collection efforts are inadequate to support the needs of analytical tools that aim to predict water consumption behaviour and ultimately assist in the successful implementation of water demand management alternatives. Owing to the unavailability of accurate programmes that measure the savings from water conservation strategies in South Africa, certain parameters are reasonably estimated from international studies and from South African studies that partially relate to aspects of conservation behaviour.
3.1.3 Time
The model will run over a period of one simulated year. This will allow the user to examine the change in conservation tendencies and the short-term effects of the demand management strategies, as well as the influence of the different meteorological seasons. Cape Town experiences high-rainfall winters and dry summers; the drought over the summer period from 2017 to 2018 is considered in this paper. When it rains, households use less water, especially for gardening purposes; however, they are less inclined to conserve water [19]. This implies that water demand may be lower in winter owing to household needs, but the tendency to save water is also lower owing to environmental conditions acting like management strategies. This phenomenon has been addressed in the model by slightly increasing the conservation tendencies of all agents in the summer months, which for Cape Town is the months of November, December, January, February, and March.
It is assumed that, while the demand management strategies are deployed, general population awareness will increase within the first three months and then plateau. The educational campaigns strategy will have the most significant effect on raising general awareness [7]. Increased awareness and knowledge over time implies that a household will be more likely to know about the strategies in place, and thus potentially become more inclined to conserve water.
3.1.4 Location
There were 111 wards in Cape Town as of 2016, with disparate wealth levels [26]. A certain level of wealth often correlates with a certain educational level, garden size, and access to information. The user can judge the levels according to the ward with which they are concerned.
3.1.5 Agent attributes
Many personal characteristics influence a household's conservation tendencies; however, some attributes have greater effects than others. A few important attributes have been included in this model, but the complex nature of human cognition and the inter-dependence of factors that affect conservation tendencies dictate that the model will be a simplified version of reality. The household attributes considered include income, education, garden size, access to information, and inherent 'water-worry'. Inherent water-worry is an intrinsic value, defined as a household's natural disposition towards conservation. It is largely determined by a household's interrelated attitudes, motivations, values, priorities, locus of control, and knowledge [14]. It reflects a household's capacity to care about water scarcity issues, and is highly influential in the effect of demand management strategies on conservation tendency.
3.1.6 Demand management strategies
There are many demand management strategies that could be implemented in Cape Town wards; however, only four strategies are included in the model's scope. These demand management strategies have been used with varying success in many countries around the world and in South Africa. They pertain to the deployment of (i) intense standard tariffs, (ii) restrictions and fines, (iii) educational and awareness campaigns, and (iv) subsidies for water efficient appliances, tax incentives, and rebates for adopting conservation measures.
3.2 Modelling the agent population
The households considered are represented by the Household agent class developed in the simulated model to contain certain parameters, variables, and functions relating to the behaviour of a real-world household. The behaviour and states in which a household agent may reside are modelled using the statechart represented in Figure 1
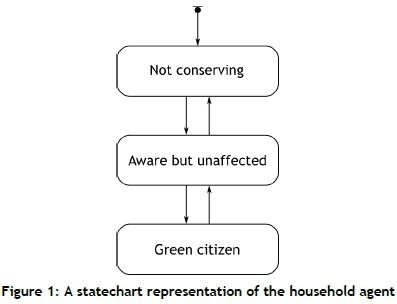
The agent can occupy one of three states: Not conserving, Aware but unaffected, and Green citizen. The Not conserving state implies that an agent has a low tendency to conserve water, while not being sufficiently aware of the circumstances. It is assumed and incorporated into the model that, in order for a household to be inclined to conserve water, it must be fully aware of its environment, including the strategies in place, the weather, and other households' conservation tendencies. An agent may, however, be in a state of sufficient awareness while not being compelled to conserve water, which is represented by the Aware but unaffected state. A household agent will only be able to achieve the state of Green citizen if both their level of awareness and their tendency to conserve water are sufficient. The transitions between these states are triggered by certain conditions pertaining to the tendency and awareness levels of an agent, as well as the associated threshold values.
3.2.1 Household agent attributes
Each agent is characterised by certain primary parameters that reflect attributes affecting a household's tendency to conserve water, as mentioned in Section 3.1.5. For the sociodemographic parameters pertaining to income, education, garden size, and water-worry level, values between 0 and 1 are assigned to each agent from a triangular distribution, where the mode is the user-specified, normalised value relative to the selected population. These individual attributes remain constant throughout a simulation run. Other key parameters included in the model characterise an agent's access to information and subsequent awareness level, as well as an agent's tendency to conserve water. Each agent has an awareness level and a conservation tendency, both of which are dynamic variables influenced by the demand management strategies. Furthermore, each agent is allocated an awareness threshold and a conservation tendency threshold, which govern the transitions between the states, as illustrated in Figure 1
3.2.2 Awareness and access to information
The awareness threshold is the value that each agent's changing awareness value must exceed in order to be considered suitably conscious of their water-stressed environment. A global normalised average of information access and subsequent information filtration speed in the ward of interest is provided by the user. An agent's awareness threshold is computed as the complement of a triangular distribution using the global user-input value as mode.
For the calculation of an agent's initial level of awareness, a stochastic value derived from the agent's awareness threshold is altered, based on the influences of each socio-demographic attribute of the agent. An agent's awareness value originates from the initial awareness value, and may be increased by external elements such as deployed strategies or the spread of information between agents. To this extent, the demand management strategies not only encourage conservation, but also serve as an awareness programme. The effect of social interactions and knowledge shared among agents is also captured.
3.2.3 Conservation tendency
An agent's tolerance for water conservation-oriented persuasions, such as deployed demand management strategies and the weather, is defined by their conservation tendency threshold. This is the threshold point that needs to be achieved by conservation tendency in order to deem a household highly likely to adopt water conservation practices. The various levels of a household's attributes determine its conservation threshold and tendency; thus two agents that are exposed to similar strategies may react differently.
To calculate an agent's tendency threshold, the complement of the agent's water-worry level serves to initialise a value that is further altered according to the specific values of the socio-demographic attributes of the agent. The model attempts to define the tendency of a household to conserve water as an empirical value. An agent's conservation tendency is derived from an array variable that represents the average effect of each of the four demand management strategies, based on the agent's socio-demographic attributes. For example, if an agent has a low income level, deploying tariffs will have a larger effect on their conservation tendency than for an agent with a mid-level or high-level income. On the other hand, if two agents have a low income level, but one has a lower level of inherent water-worry, that agent will be less inclined to conserve water owing to the tariff demand management strategy. Furthermore, the conservation tendencies of agents are equally affected by the change of seasons. During the summer months, an agent's conservation tendency will increase, as explained in Section 3.1.3.
3.2.4 Transition between states
The behaviour of an agent is governed by its statechart, as depicted in Figure 1 An agent will remain in the Not conserving state if its level of awareness is less than its awareness threshold, irrespective of the agent's conservation tendency. It is assumed that, even if the agent's conservation tendency exceeds its conservation threshold, but the agent is not sufficiently aware of the water scarcity issue, no active conservation will take place. An agent may transition from the Not conserving state to the Aware but unaffected state only if the agent's level of awareness exceeds its awareness threshold and if the agent's conservation tendency is less than its conservation tendency threshold. An agent will transition to the Green citizen state if both the awareness level and the conservation tendency surpass their respective thresholds. An agent in this state is highly likely to adopt conservation practices owing to the demand management strategies deployed, its knowledge of them and of its environment, and its particular set of attributes. An agent may transition back and forth between the states based on these conditions as time progresses.
3.3 Graphical user interface
The graphical user interface (GUI) is established to enhance the accessibility of the model, while allowing for interactive user input and informative animated output throughout the execution of a simulation run. The configuration screen of the GUI is displayed when the simulation model is initialised, and prompts the user for certain input parameters required for model execution. These user-defined parameters include the number of households considered, as well as the normalised, relative average value for the income level, education level, garden size, inherent water-worry level, and access to information as it pertains to the ward of interest. During the execution of a simulation run, the primary screen of the GUI, as illustrated in Figure 2 is displayed to the user. It contains animated charts that convey information about the shifting conservation tendencies of the households in the ward of interest, and allow the user to deploy strategies during the simulation run.
The dynamic variables labelled at (A) in Figure 2 relate to the deployment or withdrawal of the demand management strategies. The user must click in the desired check box in order to deploy a strategy or a combination of strategies simultaneously. The animated chart labelled (B) in Figure 2 represents the entire population of household agents and the respective states in which they reside. This has been included in the primary screen so that the user can observe the transitions of the households in the defined population. The user can compare the fraction of the population belonging to each state to see the effectiveness of strategies in the ward of interest.
4 MODEL OUTPUT DISCUSSION
Agent-based models are notoriously challenging to validate, and so the validation of such models by expert judgement is critical [24]. Two subject matter experts, Du Plessis [27] and Kollmuss [12], were approached to analyse the model output of hypothetical scenarios with the two-fold aim of demonstrating the model's capabilities and gaining model credibility. Both subject matter experts agreed that reasonable underlying assumptions were made in the model development process.
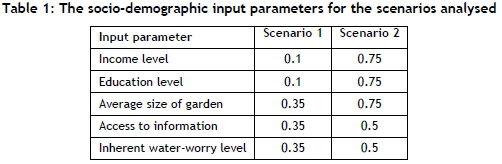
Scenario 1 is representative of a ward with extremely low income and education levels, accompanied by below average levels for garden size, access to information, and inherent water-worry. By contrast, scenario 2 portrays a ward with relatively high levels of income, education, and garden size, while the access to information and inherent water-worry levels are set in the mid-level range. A population of 1 000 households is considered; the socio-demographic input parameter values implemented for the scenario analysis are given in Table 1 A set of experiments was executed for each scenario, which included a base case where no demand management strategies were deployed, a best case scenario where all four strategies were deployed and, finally, each demand management strategy was deployed separately in a bid to determine the effect of each strategy on a given population.
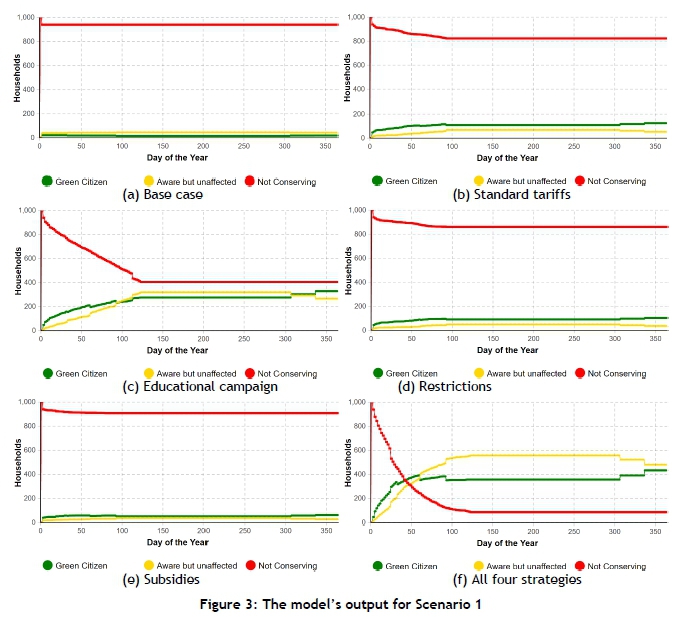
A critical outcome measurement of the model is the number of households in the Green citizen state, as these agents have the largest probability of actively conserving water and reducing the total demand. The model output for Scenarios 1 and 2 is depicted in Figures 3 and 4. As illustrated in Figure 3(a), it was found that the majority of households in Scenario 1 were in the Not conserving state, where no demand management strategies were deployed. This may be attributed to high awareness and conservation tendency thresholds accompanied by low awareness and conservation tendency levels as a result of the combination of input parameters of the ward considered in Scenario 1. The base case for Scenario 2, on the other hand, had a larger initial population in the Green citizen state, although it was still less than a quarter of the total population considered, as illustrated in Figure 4(a).
In evaluating the effect of employing different demand management strategies separately, it was evident from the model's output that educational campaigns had the greatest impact on households to adopt water conservation in both Scenarios 1 and 2, as depicted in Figures 3(c) and 4(c). The implementation of educational campaigns typically results in increased public awareness of water scarcity and the need to conserve, which may be deemed effective especially in a ward with low access to information levels, as was modelled in Scenario 1, where this strategy greatly outperformed the other strategies. Kollmuss [12] agreed with the model output, and stated that access to information directly relates to knowledge and awareness, which, among other intrinsic and extrinsic factors, significantly determine the 'willingness to act', and therefore the intention to conserve.
The evaluation of the separate implementation of different demand management strategies further revealed that households in both scenarios were least likely to adopt water conservation in response to subsidies, as shown in Figures 3(e) and 4(e). Kollmuss [12] confirmed that subsidies generally have little impact on conservation intentions, owing to the length of time it takes to adopt new technologies. In other respects, Du Plessis [27] mentioned that wards of low income and education, as modelled in Scenario 1, may be influenced by the use of standard tariffs. From Figures 3(b) and 3(d), it can be seen that the implementation of standard tarrifs affected the ward to a greater extent than the implementation of restrictions. For Scenario 2, however, the effects of implementing tariffs and restrictions were more alike, as shown in Figures 4(b) and 4(d).
It was further evident from the model's output from both scenarios that the best case is the deployment of all four demand management strategies, as illustrated in Figures 3(f) and 4(f). This may, however, not always be plausible or efficient. In Scenario 2, the effect of deploying all four strategies was similar to that of deploying only educational campaigns. It follows, therefore, that for the particular ward it may be adequate merely to implement an educational campaign that suitably influences the ward to conserve water.
The model output for Scenario 1, on the other hand, indicated that the best case (i.e., implementing all four strategies) outperformed the best single strategy for the specific ward - educational campaigns. Rather than implementing all four demand management strategies, it may be more reasonable to consider deploying education campaigns in combination with another strategy, based on a suggestion by Du Plessis [27] that communication strategies, such as educational campaigns, are highly effective and complement other strategies. Further experiments were performed for Scenario 1, where the strategy of educational campaigns was deployed with every other strategy. The model's output indicated that the combination of standard tariffs and educational campaigns was deemed to have a similar effect in attracting households of this particular ward to water conservation as that of deploying all four strategies.
5 CONCLUSION AND RECOMMENDATIONS
The ability to predict the tendency of households to conserve water in response to demand management policies may be useful for policy-makers in determining which strategies are most effective in different wards. Each ward of Cape Town is considered to have a distinctive average set of attributes such as income level, education level, property size, access to information, and inherent water-worry. The proposed model, which attempts to include the most influential attributes affecting conservation tendencies, is capable of exploring the intentions of urban households with varying characteristics to conserve water, in response to different demand management strategies. This paper may serve as a basis for future research, while the model may serve as a tool for policy-makers and analysts to identify trends in water conservation intentions and to explore the effectiveness of different demand management strategies in various population groups in Cape Town during periods of water scarcity. Recommendations for future extensions to the research include modelling the actual conservation of households based on the tendencies, employing different severity levels of demand management strategies, and incorporating a geographic information system functionality with embedded attribute data pertaining to the different wards.
ORCID® identifiers
C. Searle: https://orcid.org/0000-0003-0382-4171
V.E. Harper: https://orcid.org/0000-0002-1845-4401
REFERENCES
[1] Cosgrove, W.J. & Rijsberman, F.R. 2000. World water vision: Making water everybody's business. London: Earthscan. [ Links ]
[2] Schlosser, C.A., Strzepek, K., Gao, X., Fant, C., Blanc, É., Paltsev, S., Jacoby, H., Reilly, J. & Gueneau, A. 2014. The future of global water stress: An integrated assessment. Earth's Future, 2(8), pp. 341-361. [ Links ]
[3] Colvin, C., Muruven, D., Lindley, D., Gordon, H. & Schachtschneider, K. 2016. Water: Facts and futures. Cape Town: WWF-SA. [ Links ]
[4] Dziegielewski, B. 2003. Strategies for managing water demand. Water Resources Update, 126, pp. 29-39. [ Links ]
[5] Geustyn, L., Jacobs, H.E., Du Plessis, J.A., Fair, K. & Daniels, J. 2007. Analysis of water savings: A case study during the 2004/05 water restrictions in Cape Town. Journal of the South African Institution of Civil Engineers, 49(3), pp. 16-26. [ Links ]
[6] Mukheibir, P. & Ziervogel, G. 2007. Developing a municipal adaptation plan (MAP) for climate change: The City of Cape Town. Environment and Urbanization, 19(1), pp. 143-158. [ Links ]
[7] The City of Cape Town. 2007. Long-term water conservation and water demand management strategy. Technical report. Available from https://greencape.co.za/assets/Sector-files/water/Water-conservation-and-demand-management-WCDM/CoCT-Long-term-water-conservation-and-water-demand-management-strategy-2007.pdf. Accessed on: July 2018. [ Links ]
[8] Joubert, A., Stewart, T.J. & Eberhard, R. 2003. Evaluation of water supply augmentation and water demand management options for the City of Cape Town. Journal of Multi-Criteria Decision Analysis, 12(1), pp. 17-25. [ Links ]
[9] The Department of Water and Sanitation & The City of Cape Town. 2018. Water outlook 2018 report. Technical report, Available from: http://resource.capetown.gov.za/documentcentre/Documents/City%20research%20reports%20and%20review/Water%20Outlook%202018_Rev%2030_31%20December%202018.pdf. Accessed on: July 2018. [ Links ]
[10] Jansen, A. & Schulz, C. 2006. Water demand and the urban poor: A study of the factors influencing water consumption among households in Cape Town, South Africa. South African Journal of Economics, 74(3), pp. 593609. [ Links ]
[11] Olmstead, S.M. & Stavins, R.N. 2009. Comparing price and nonprice approaches to urban water conservation. Water Resources Research, 45(4), pp. 1-10. [ Links ]
[12] Kollmuss, A. 2018. Associate at Stockholm Environmental Institute. Personal communication. Contactable at climate@anyakollmuss.com. [ Links ]
[13] Geller, E.S. 1995. Actively caring for the environment: An integration of behaviourism and humanism. Environment and Behavior, 27(2), pp. 184-195. [ Links ]
[14] Kollmuss, A. & Agyeman, J. 2002. Mind the gap: Why do people behave environmentally and what are the barriers to pro-environmental behaviour? Environmental Education Research, 8(3), pp. 239-260. [ Links ]
[15] Frederiks, E.R., Stenner, K. & Hobman, E.V. 2015. Household energy use: Applying behavioural economics to understand consumer decision-making and behaviour. Renewable and Sustainable Energy Reviews, 41, pp. 13851394. [ Links ]
[16] Borshchev, A. & Filippov, A. 2004. From system dynamics and discrete event to practical agent based modeling: Reasons, techniques, tools. Proceedings of the 22nd International Conference of the System Dynamics Society, 22, Oxford, pp. 25-29. [ Links ]
[17] Bonabeau, E. 2002. Agent-based modeling: Methods and techniques for simulating human systems. Proceedings of the National Academy of Sciences, 99(3), Irvine, CA, pp. 7280-7287. [ Links ]
[18] Macal, C. & North, M. 2014. Introductory tutorial: Agent-based modelling and simulation. Proceedings of the 2014 Winter Simulation Conference, pp. 6-20, IEEE. [ Links ]
[19] Herrera, M., Torgo, L., Izquierdo, J. & Perez-Garcia, R. 2010. Predictive models for forecasting hourly urban water demand. Journal of Hydrology, 387(1-2), pp. 141-150. [ Links ]
[20] Sahin, O., Siems, R.S., Stewart, R.A. & Porter, M.G. 2016. Paradigm shift to enhanced water supply planning through augmented grids, scarcity pricing and adaptive factory water: A system dynamics approach. Environmental Modelling and Software, 75, pp. 348-361. [ Links ]
[21] Hoffmann, M., Worthington, A. & Higgs, H. 2006. Urban water demand with fixed volumetric charging in a large municipality: The case of Brisbane, Australia. Australian Journal of Agricultural and Resource Economics, 50(3), pp. 347-359. [ Links ]
[22] Sahin, O., Bertone, E. & Beal, C.D. 2017. A systems approach for assessing water conservation potential through demand-based water tariffs. Journal of Cleaner Production, 148, pp. 773-784. [ Links ]
[23] Ali, A.M., Shafiee, M.E. & Berglund, E.Z. 2017. Agent-based modeling to simulate the dynamics of urban water supply: Climate, population growth, and water shortages. Sustainable Cities and Society, 28, pp. 420-434. [ Links ]
[24] Levy, S., Martens, K. & Van der Heijden, R. 2016. Agent-based models and self-organisation: Addressing common criticisms and the role of agent-based modelling in urban planning. Town Planning Review, 87(3), pp. 321 -338. [ Links ]
[25] The Anylogic Company. 2016. AnyLogicsimulation. Available from https://www:anylogic:com/. Accessed on: May 2018. [ Links ]
[26] Statistics South Africa. 2016. Community survey 2016. Statistical release P0301. Technical report. Available from http://cs2016.statssa.gov.za/wp-content/uploads/2016/07/NT-30-06-2016-RELEASE-for-CS-2016-_Statistical-releas_1-July-2016.pdf. Accessed on: April 2018. [ Links ]
[27] Du Plessis, K. 2018. Professor in Hydrology and Enviromental Engineering at Stellenbosch University. Personal communication. Contactable at jadup@sun.ac.za. [ Links ]
* Corresponding author: christadk@sun.co.za

