


Services on Demand
Article
 English (pdf)
 Article in xml format
 Article references
Indicators

Related links
-
 Cited by Google
 -
 Similars in Google
Share

 Permalink
South African Journal of Industrial Engineering
On-line version ISSN 2224-7890
Print version ISSN 1012-277X
S. Afr. J. Ind. Eng. vol.31 n.3 Pretoria Nov. 2020
http://dx.doi.org/10.7166/31-3-2418
SPECIAL EDITION
Improved energy budgeting process using measurement and verification principles
C. van Aarde*; A.G.S. Gous; M. Kleingeld
Centre for Research and Continued Engineering Development (CRCED), North-West University, Pretoria, South Africa
ABSTRACT
Budgets are used to predict and measure a mine's performance. Problems arise when the budget is developed by financial resources with little focus on operational changes. The implementation of energy-saving measures, and the number of workdays or time-of-use profiles are often neglected, making the budget obsolete. Measurement and verification principles are known for their effectiveness when addressing operational changes. This paper presents a novel approach in which measurement and verification principles are altered into financial principles by developing analogies between the fields. A critical analysis of South African mines' budgets was conducted to create these analogies. The result of the analysis highlights the need for integration, and provides a relationship between well-established measurement and verification principles as an alternative solution to budgeting. The solution was applied to a gold mine complex in South Africa. The new budget could account for an additional R26.2-million (16.8%), compared with the original budget, by successfully incorporating the measurement and verification principles.
OPSOMMING
Begrotings word gebruik om 'n myn se vertoning te voorspel en te meet. Probleme ontstaan wanneer die begroting ontwikkel word deur finansiële hulpbronne met beperkte fokus op operasionele veranderinge. Die implementering van energiebesparingsmaatstawwe en die aantal werksdae of tyd-in-gebruik profiele word dikwels afgeskeep. Die gevolg is dat die begroting in onbruik val. Meet en verifieer beginsels is egter bekend vir hul doeltreffendheid om operasionele veranderinge aan te spreek. Hierdie artikel bied n nuwe benadering aan waarmee meet en verifieer beginsels aangepas word by finansiële beginsels deur die ontwikkeling van analogieë tussen die twee velde. 'n Kritiese analise van Suid-Afrikaanse myne se begrotings is geloods om die analogieë te skep. Die resultaat van die analise beklemtoon die behoefte vir integrasie en lewer 'n verwantskap tussen gevestigde meet en verifieer beginsels as n alternatiewe oplossing tot begroting. Die oplossing is toegepas in 'n goudmynkompleks in Suid-Afrika. Die nuwe begroting kon rekenskap gee van R26.2 miljoen (16.8%), teenoor die oorspronklike begroting, deur die meet en verifieer beginsels suksesvol te inkorporeer.
1 BACKGROUND
Budgets are a commonly used tool to determine the revenue and expenses of a mine [1]. They are also used to measure a mine's performance [2]. It is vital, therefore, that the budget is complete, accurate, and transparent [3]. A problem arises when budgets are drawn up by financial resources that only focus on the financial aspects of the budget. Little or no attention is given to the operational changes occurring daily throughout the mine [4].
Financial resources easily assume that the mine will operate as in the past (normal operation) [5]. Implementing energy-saving measures (ESMs), different time-of-use (TOU) profiles, and the number of working days versus weekends during a month ensure large changes in the normal operation of the mine [3]. These operational changes in turn have a large impact on the budget, since they act as the basis for the budget [5].
Neglecting the operational changes causes the budget to become obsolete within the first few months of the assessment period [6] - the period for which the budget was developed. This neglect affects the cashflow of the mine, since the operational changes now cannot be funded properly. It also affects how the mine's performance is assessed, since it is measured against the budget. These effects have drastic consequences, and can negatively impact the mine and its operations [7].
There is, therefore, a need to incorporate operational changes into mining budgets. Specific attention should be given to both operational- and finance-related changes and uncertainties. Established measurement and verification (M&V) principles are known for their unique ability to address such changes and uncertainties in normal operation. This study thus focuses on the integration of M&V principles into the budget to improve the operational forecasting of the mine and to allow for better financial planning.
2 BUDGETING AND MONITORING MINE ENERGY SYSTEMS
The aim of this section is to identify and evaluate the current budgeting structures that are used by South African mines. A survey of 63 South African mineral mine shafts was conducted to evaluate their budgeting structures. These 63 shafts operate under three of the major role-players in deep-level mining in the country. They represent 87 per cent of the deep-level mining shares in South Africa, and are therefore considered to be a representative sample.
Budgeting in its most traditional form is used for financial management purposes [8]. It is concerned with top-down planning for financial performance, is built on organisational hierarchies, and is intended as a measure of control over operational expenditures [9]. Figure 1 illustrates the general steps used by South African mines when developing their budgets. These general steps are compiled from the budgeting steps followed by the 63 shafts that participated in the survey.

STEP 1: DEVELOP A BUDGETING PLAN
Before the budget can be developed, planning must take place [8]. Budget planning involves the number of details desired in the budget, the purpose of the budget, and the uses of the budget [9]. The South African mining complexes that took part in the survey all considered the following aspects before developing the budget:
a) Measurement boundary
The budget boundary is the set of components to be considered within the budget [9]. The budget can be developed for the whole facility, or only for portions. A typical mine layout consists of business units broken down into shafts and plants, each consisting of a number of commodities (pumping systems, compressor houses, etc.) [10].
The survey done in this study showed that the budgets were compiled on a business-unit level, with the exception of three mines that developed their budgets on a shaft level. None of the mines consider budgeting on commodity levels owing to the magnitude of the data and associated errors, which would be time-consuming to convert into a reliable format to be used within the budget.
b) Measurement period and budget intervals
The measurement period represents the historical data that will be included in the budget calculations [10]. The measurement period should be representative of the normal operations of the mine, and should not include abnormal events such as industrial action [11]. The survey showed that the typical period that South African mines use for budgeting is the previous 12 months.
The budgeting intervals are the number of intervals for which the budget will be composed [10]. Typical intervals in South African mines are either monthly or quarterly. This means that the final budget will be developed to show monthly or quarterly expected total consumption. Annual budgets are not considered owing to seasonal changes.
c) Data availability
After deciding on the boundary and the measurement intervals, the data can be compiled for the decided boundary in the measurement intervals. Typical data gathered by South African mines are:
• Monthly total consumptions for each shaft, plant and business unit;
• Monthly total production data (tons hoisted for shafts and tons treated for plants);
• Existing growth and savings projects; and
• Planned growth and savings projects.
These data are usually obtained from meters implemented on the mine.
d) Adjustments
Routine adjustments are occurrences that are expected to change and that need to be accounted for [11]. The most common routine adjustments are changes in weather and production. The survey showed that South African mines account for production changes in the budgeting structure by including production forecasts. The energy associated with changes in production is calculated using energy-intensity models. No additional routine adjustments are typically considered or regularly evaluated.
e) Utility costing
The energy budgets developed for a mine need to be converted into financial budgets. This conversion requires an energy-to-cost ratio, usually depicted in R/kWh. This ratio can be obtained by identifying the TOU and comparing it with the Eskom TOU tariffs [12].
STEP 2: CREATE THE BUDGET
The budget should be an accurate representation of expected future consumption. Equation 1 and Equation 2 demonstrate how the energy and cost budgets are conventionally calculated.

The variables in both equations are:
• Historical energy: Energy for the boundary in the desired intervals; in kWh
• Production: Energy changes owing to production changes; in kWh
• Growth: Projects that increases energy consumption; in kWh
• Savings: Projects planned by the engineers to reduce energy; in kWh
• Cost ratio: The ratio obtained from Eskom tariffs; in R/kWh
• Load shifting: Savings project, but only with a cost effect; in R
Load shifting is introduced in this step to ensure that all cost effects are accounted for. Load shifting accounts for energy saving initiatives where certain mine components operate in other TOU periods. No energy savings are obtained, but the cost of the energy can be decreased by using the energy in another TOU period. Excluding load shifting projects from the budget will, therefore, not affect the energy budget, but will have an effect on the costing budget.
STEP 3: APPROVE AND SIGN-OFF THE BUDGET
The developed budget is shared with auditors and mine managers for approval. Once approval is obtained, the budget is signed-off and no further changes are made to it. Approval (or comment) is provided according to the judgement of the relevant person, and not according to any set criteria.
The existing budgeting structure discussed in this section proves to have limitations in its application. Neglecting accurate operational changes in the budget causes it to become obsolete early on in the assessment period. This article suggests incorporating established M&V principles into the budgeting process.
3 MEASUREMENT AND VERIFICATION PRINCIPLES
A literature survey was conducted on 15 recently published documents on budgeting structures (from 2015 to 2020) [4-19]. The aim of the literature survey was to identify whether M&V principles had been previously used in the budgeting structures. Of these 15 documents, only 11 considered one or two of these principles, but none considered all of the M&V principles. The inclusion of all of the M&V principles in the budgeting structures is thus a novel approach.
M&V principles are used to evaluate the ESM performance before (baseline) and after (post-installation) implementation [12]. Equation 3 shows the general equation used to determine the savings of the ESMs. Adjustments are included to allow for unplanned changes (such as increases in temperature or the number of employees) [12,13].

The variables in the equation are:
• Savings: Calculated savings; in kWh
• Baseline energy: Forecasted energy consumption; in kWh
• Post installation energy: Actual energy consumption; in kWh
• Adjustments: Expected or unplanned changes; in kWh
The baseline and performance assessment energy can be determined using one of three M&V options, labelled options A (retrofit isolation), B (whole facility), and C (calibrated simulation) [14]. The main steps used by these approaches to determine the energy savings are shown in Figure 2.

STEP 1 : DEVELOP THE M&V PLAN
The M&V plan demonstrates how the savings will be calculated and included, based on the following sections: (a) measurement boundary; (b) measurement period; (c) data availability and quality; and (c) routine and non-routine adjustments [13].
a) Measurement boundary
Savings may be determined for an entire facility or a portion of it, depending on the ESM characteristics, and on the purpose of the reporting, which determines the M&V option that will be used.
• If the purpose of reporting is to verify the savings from equipment affected by the savings programme, a measurement boundary should be drawn around that equipment; measurement requirements for the equipment within the boundary can then be determined (option A) [12-14].
• If the purpose of reporting is to verify and/or help manage total facility energy performance, the meters measuring the supply of energy to the total facility can be used to assess performance and savings. The measurement boundary in this case encompasses the whole facility (option B) [12-14].
• If the baseline or reporting period data are unreliable or unavailable, energy data from a calibrated simulation program can take the place of the missing data, for either part or all of the facility. The measurement boundary can be drawn accordingly (option C) [12-14].
b) Measurement period and baseline intervals
The measurement period represents the historical data period that will be used to develop the baseline. The baseline intervals are the frequency of the intervals included in the baseline, and include, but are not limited to, half-hourly, daily, weekly, and monthly intervals [15]. M&V principles specify that care should be taken when selecting the period and intervals, as they should [16]:
• Represent normal operating cycles;
• Include only time periods for which fixed variable energy-governing facts are known about the facility; and
• Coincide with the period immediately before the commitment to undertake the ESM.
c) Data availability and quality
The required data sets include:
• Energy carrier data (historical energy data in the case of application on a mine)
• Energy driver data (production data in the case of application on a mine)
The energy carrier and driver data undergo multiple data quality tests to ensure their accuracy, completeness, consistency, and reliability [16-18].
d) Adjustments
Routine adjustments are factors that are expected to change routinely during the assessment period, such as weather or production. Non-routine adjustments are unplanned events such as strike actions. The effect of both these adjustments is considered and accounted for in the baseline [19].
STEP 2: DEVELOP THE BASELINE
The baseline is created using a set of guidelines, such as those stipulated in the international performance measurement and verification protocol (IPMVP) [19], which guides the three M&V options. Engineering estimates or mathematical modelling are used to assess the significance of the parameters included in the baseline modelling. Models usually contain several sets of regression parameters, each valid over a defined range of conditions. In most instances several regression models are considered for difference usage periods [20].
STEP 3: INSTALL ESM(S) AND CONSTRUCT VERIFICATION ACTIVITIES
After the baseline is completed and approved, the ESM is implemented and tested. The performance assessment starts after the successful implementation of the project. Operational verification consists of a set of activities that help to ensure that the ESM is installed and commissioned and is performing its intended function [19,20]. Operational verification serves as a low-cost initial step for assessing savings potential or verifying performance over time, and should be included in the M&V plan and precede other post installation saving verification activities [21].
4 CRITICAL COMPARISON OF BUDGETING STRUCTURES AND M&V APPLICATIONS
Mine managers use the budgets to compare the actual performance of the mine against all of the projects. Research shows that the budgeting structures are effective for cash flow planning, but not the most effective way by which to measure performance of ESMs [22]. Engineers use M&V principles to develop baselines for all ESMs. The savings obtained, when compared with the baseline, are rarely seen on the budget. This raises the question of whether the budgets are correctly developed.
The M&V research shows that similar steps are taken when compiling baselines used for compiling budgets. However, project-specific M&V plans are much more comprehensive and, as a result, more accurate than budgets [23]. This section identifies the gaps in the budgeting steps that can be addressed by the M&V principles. When the gaps in the budget are addressed by M&V principles, the budget reflects similar accuracies and completeness to those observed in the project-specific baselines.
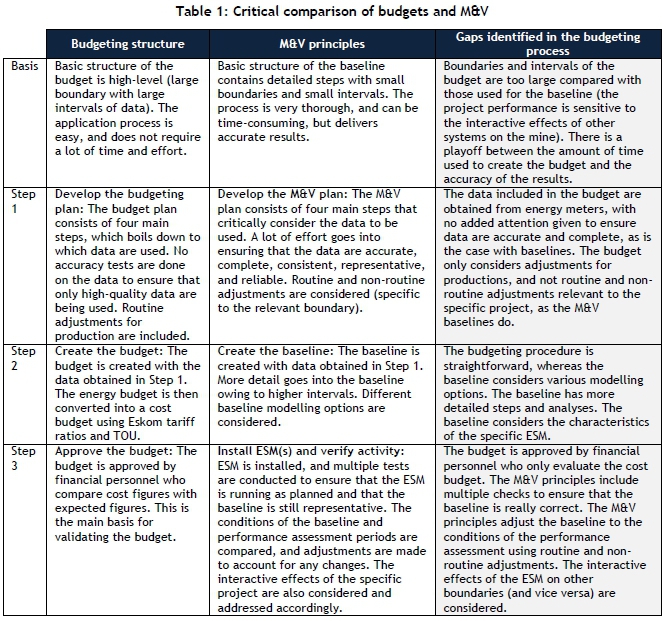
Table 1 presents a critical comparison of the budgeting structure used by South African mines and the M&V principles. The final column in Table 1 addresses the gaps noticed in the budgeting process.
Table 1 shows that there are gaps in each step of the budgeting process. The gaps are mainly owing to (a) the level of evaluation; (b) the method of modelling; and (c) the accuracy tests. The budgeting approach is therefore adjusted to represent the M&V approach, aiming to increase the budget's accuracy and allow the budget to be used for energy management principles.
The identified gaps will be addressed specifically as in the sections below:
a) Level of evaluation
The high-level boundary limits the usage of the budget. To enable the budget to be used for energy management purposes, more detail needs to be included. The boundary should therefore shift from whole facility to component level. This will ensure that each of the commodity performances will be considered. However, owing to the vast number of available components, it can be challenging and time-consuming to include all commodities.
A solution to this is to combine the components into commodity totals; for example, all the individual pumps will be added to give the total 'pumping' commodity. The best practice will be to develop the baseline on shaft level and then to sub-divide the shaft totals for each commodity. By doing this, no extra budgets are developed (which saves time and resources), and the budget can still be used for energy management owing to the inclusion of all the commodities.
The budget will also be compiled using higher-resolution data (such as using half-hourly intervals instead of monthly totals). This will allow for better TOU allocations to improve the overall accuracy of the budget. Problematic areas will also be easier to identify by including more resolutions.
b) Method of modelling
The budget is calculated using Equations 1 (energybudget) and 2 (cost budget), which are linear equations. The M&V baselines are calculated using a variety of models, such as regression models or simulation models, that are specifically developed for the characteristics of the commodity or ESM. The trend between the energy drivers and the energy carriers is evaluated before deciding which modelling technique to use.
The new budgeting structure will therefore include the assessment of the input and output trends before applying a modelling technique. This step will address the types of adjustment to the historical data that are required to ensure that the budget is representative enough. This allows for the consideration of changes expected in the performance assessment period when compiling the budget.
c) Test for accuracy and consistency
The model's accuracy will be determined using target shuffling, which is a particularly useful method for identifying false positives. This method also tests whether two events or variables occurring together are perceived to have a cause-and-effect relationship rather than a coincidental one [22].
The bootstrap sampling method is used to test the model's consistency. This method tests a model's performance on certain subsets of data over and over again to provide an estimate of accuracy. To do this, a random sample of the data is divided into three subsets: training, testing, and validation. The model is built on the data in the training subset, and then evaluated on the testing subset [22].
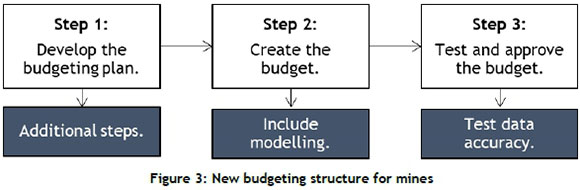
Modifications are made to the existing structure to include the completion of the three identified gaps. The new budgeting process is demonstrated in Figure 3, with additional detail given to indicate the M&V-enhanced areas.
5 PRACTICAL APPLICATION AND RESULTS
5.1 Case study background
The newly developed budgeting structure was applied to a South African gold mine complex. The gold mine consists of five production shafts, each feeding a number of components (pumps, compressors, fridge plants, etc. ) One of the shafts also feeds a processing plant. The results of the application are only displayed for Shaft 1, for reasons of simplicity.
5.2 Practical application of the new budgeting structure
STEP 1: DEVELOP THE BUDGETING PLAN
a) Measurement boundary
The measurement boundary used for the budget was each individual shaft. All energy going into the shaft was used as the energy driver. Budgets for the commodities and the plants were sub-divided out of the shaft budgets, based on the historical average percentage consumption of the commodity compared with the shaft's total consumption.
b) Measurement period and baseline intervals
The measurement period intervals were chosen as half-hourly. The previous 12 months' half-hourly data per shaft were thus used to calculate budgets.
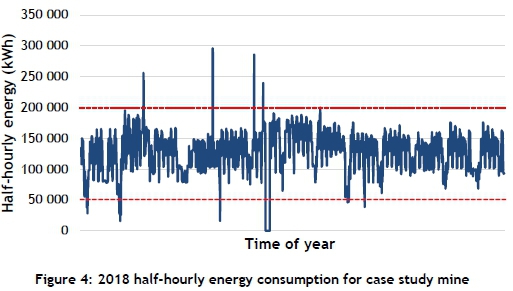
c) Data availability and quality
The energy data was obtained from calibrated meters at half-hourly intervals. The data was tested for abnormalities, as shown in Figure 4, where the 2018 half-hourly energy for Shaft 1 is displayed. The red lines show the inter-quartile lines (IQL) that were used to identify the abnormalities. These values were addressed and all removed from the dataset.
A similar approach was taken to cleaning the production data, which was obtained as 'daily tons hoisted' for 2018. The growth and savings projects for Shaft 1 were obtained from the project approval plans for 2018. Shaft 1 had no planned growth projects, two savings projects, a pumping project (expected savings of 1.5 MW), and a compressed air project (expected savings of 3 MW).
d) Adjustments
The only adjustments considered were routine adjustments for production changes. The 2018 production data (abnormalities already removed) were used to forecast the 2019 production. The mine expected to produce 8.0 per cent more, owing to new developments on Shaft 2 and Shaft 3. Since Shaft 3's production was hoisted at Shaft 1, the increase in planned production affected Shaft 1.
The expected energy increase associated with the 2.8 per cent production increase was calculated using the linear production model presented in Equation 4.

where m and C are variables obtained using the 2018 energy and production data in a LINEST function in Microsoft Excel. The model was tested on a sampling dataset, and presented an error of 1.3 per cent, which is acceptable for production modelling [23].
STEP 2: CREATE THE BUDGET
The budget was created using the original budgeting equation presented in Equation 1 (energy budget). The difference, however, was that the budget was now developed for half-hourly intervals. This meant that the total daily production was converted into half-hourly portions by considering the energy profile. The same was done for the savings projects. Figure 5 illustrates the typical weekday profile for a summer month for Shaft 1's actual 2018 energy budget and for the 2019 budget.
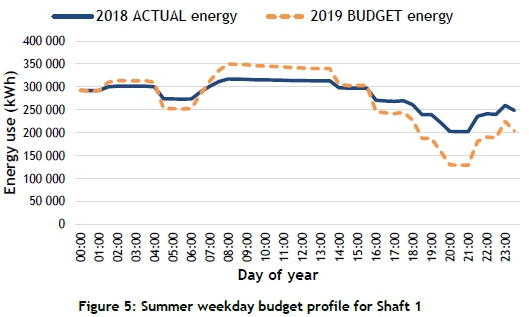
A similar approach was adopted for Saturday and Sunday profiles for both the summer and the winter months.
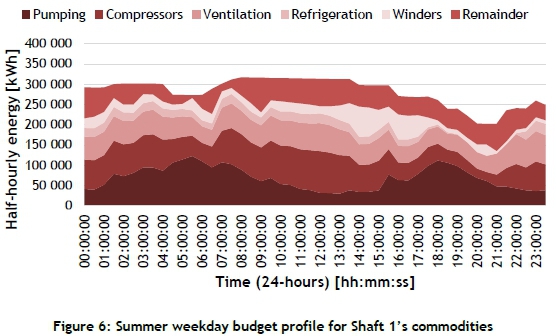
The commodity breakdowns were also created. Figure 6 illustrates how the summer weekday profile for Shaft 1 was divided between the commodities using the percentage sub-divisions.
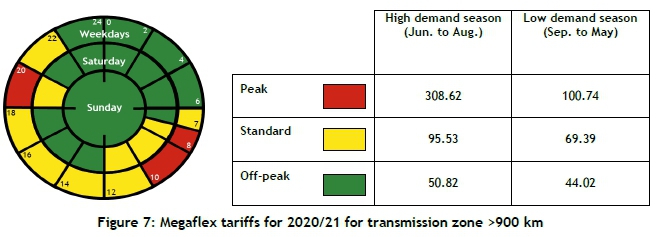
The half-hourly profiles of the budget enabled the easy application of Eskom's TOU to convert the energy budget into a cost budget. The Eskom tariffs, as approved by NERSA and presented in Figure 7, were used to calculate the cost budget.
STEP 3: TEST AND APPROVE THE BUDGET
The newly developed budget's accuracy and completeness were tested to ensure that the budget could be used effectively. The accuracy was tested using the target shuffling method, and an accuracy of 99.5 per cent was obtained. The completeness of the budget was tested using the bootstrap method, where a 100 per cent completeness of the budget was observed.
5.3 Verification of the new budgeting structure
The original budgeting structure was used to develop a budget for the mining complex discussed in the case study. The purpose was to compare the application of the original budget with the application of the new budget. The original budget was developed for monthly total energy consumptions per shaft, whereas the new budget was developed half-hourly and added up to the monthly total, as can be seen in the comparison in Figure 8.
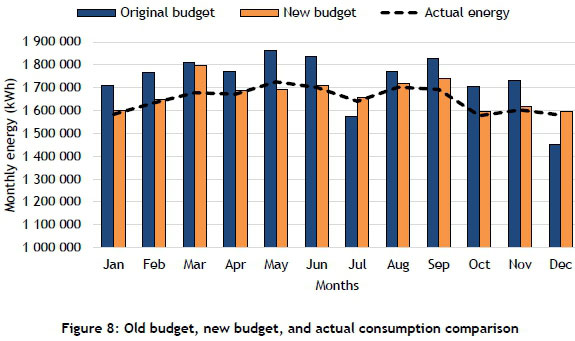
The old budget predicted the energy consumption for Shaft 1 with an accuracy of 15.2 per cent, whereas the new budget predicted the energy consumption within a 3.4 per cent accuracy. The 3.4 per cent error could be explained: the compressed air project on Shaft 1 started 22 days later than planned.
5.4 Discussion
The newly developed budget enabled the user to address the commodity performances that the original budgeting structure did not allow because it was only developed at shaft level. A simple adjustment to the structure thus enabled the budget to be used for energy management purposes as well.
The new budget was validated by successfully applying it to a South African gold mine complex. The new budgeting structure was verified by comparing its accuracy with the existing budgeting results. The new budget had a 6.4 per cent improvement, which resulted in an R8.8-million difference in the cost forecasts. These improvements were noted for Shaft A only; but when these changes were adapted for the budgeting structure of the whole mine, a 16.8 per cent improvement was noted, resulting in a R26.2-million difference in the cost forecast of the mine.
6 CONCLUSION AND RECOMMENDATIONS
South Africa's mining industry is suffering because of higher-than-inflation increases in electricity costs. To reduce mines' dependence on electricity sources, energy management is applied. Unfortunately, the mines' financial budgets are being used as the reference point. Owing to the high level of detail in the budget, effective energy management is limited. This is the reason that mines struggle to see the effect of their ESMs on the budgets.
This article has addressed the problem by incorporating M&V principles into the budgeting structure. This was done by developing analogies between the M&V principles and the budgeting process followed by South African mines. M&V principles are known for their reliability and accuracy, and are believed to improve the budgeting structure by making it more representative and enabling energy management. This new structure was developed and applied to a gold mine complex in South Africa.
The new budgeting structure improved the accuracy of a South African gold mine complex's budget by 16.8 per cent. This resulted in a R26.2-million difference between the original budget and the new budget. Effective energy management could also be applied by using the new budgeting structure owing to the visibility of commodity performances. This confirmed the value of incorporating M&V principles when constructing financial budgets. The developed methodology was proven to be viable, and its application resulted in more accurate budgeting methods. It is recommended that the new structure be adapted and applied to other industries in future studies.
ORCID® identifiers
C. van Aarde: https://orcid.org/0000-0003-1382-4562
A.G.S. Gous: https://orcid.org/0000-0002-3195-1146
M. Kleingeld: https://orcid.org/0000-0003-4435-6036
REFERENCES
[1] Vegter, I. 2019. Why mining still matters: The socio-economic importance of the mining industry. South African Institute of Race Relations, 12(3), pp. 1-24. [ Links ]
[2] Davidson, O. & Winkeler, H. 2018. South Africa's energy future: Visions, driving factors and sustainable development indicators. Energy & Development Research Centre, University of Cape Town, pp. 3-8. [ Links ]
[3] Fakoya, M. 2014. Carbon tax policy implications for economic growth and unemployment rates in South Africa. Environmental Economics, 12(1), pp. 1-7. [ Links ]
[4] Goodman, S., Rajagopaul, A. & Cassim, Z. 2019. Putting the shine back into South African mining. Applied Energy, 8(2), pp. 8-16. [ Links ]
[5] El-Shimy, M. 2018. Fundamentals of energy management and energy managers. Sustainable Energy Technologies and Systems, 5(2), p. 17-23. [ Links ]
[6] Winkler, H. & Marquard, A. 2017. Analysis of the economic implications of carbon tax. Journal of Energy in Southern Africa, 22(1), pp. 55-68. [ Links ]
[7] Booysen, J. 2020. Application of accounting principles on energy-related reporting. PhD in Mechanical Engineering thesis submitted to the North-West University. [ Links ]
[8] Hansen, S. & Van der Stede, W. 2018. Multiple facets of budgeting: An exploratory analysis. Journal of Management Accounting Research, 15(4), pp. 1-16. [ Links ]
[9] Meek, A. 2013. A systems engineering approach to improve the measurement and verification process of energy services companies. Journal of Energy in Southern Africa, 25(2), pp. 5-8. [ Links ]
[10] Rakos, I. & Man, M. 2016. Cost budgeting - A relevant instrument for improving the performance of a coal mine case study. Journal of Accounting and Auditing, 38(3), pp. 1-22. [ Links ]
[11] Du Toit, M. & Pienaar, A. 2019. A review of the capital budgeting behaviour of large South African firms. Meditari Accountancy Research Journal, 13(1), pp. 19-27. [ Links ]
[12] Vermeulen, J., Marais, J. & Schoeman, W. 2019. Simplified high-level investigation methodology for energy saving initiatives on deep level mine compressed air systems. Conference on the Industrial and Commercial Use of Energy (ICUE), South Africa, 22(3), pp. 1-18. [ Links ]
[13] Xia, X. & Zhang, J. 2013. Mathematical description for the measurement and verification of energy efficiency improvement. Applied Energy, 111(1), pp. 247-256. [ Links ]
[14] Gouws, R. 2013. Measurement and verification of load shifting interventions for a fridge plant system in South Africa. Journal of Energy in Southern Africa, 24(1), pp. 9-14. [ Links ]
[15] Booysen, W. 2014. Measurement and verification of industrial DSM projects. Conference on the International and Commercial Use of Energy (ICUE), South Africa, 6(1), pp. 1-19. [ Links ]
[16] Barnard, F., De Bod, A. & Grobler, L. 2013. Energy efficiency measures on mine pumping systems - an M&V methodology. Conference on the International and Commercial Use of Energy (ICUE), South Africa, 24(1), pp. 18 - 32. [ Links ]
[17] Fourie, H. 2016. Improvement in the overall efficiency of mining equipment. Journal of the Southern African Institute of Mining and Metallurgy, 116(3), pp. 275-281. [ Links ]
[18] Tsolas, I. 2019. Mine performance assessment by means of stochastic frontier analysis. Mathematic Problems in Engineering, 19(3), pp. 1-16. [ Links ]
[19] Odhiambo, N. & Chirwa, T. 2020. Electricity consumption and economic growth: New evidence from advanced, emerging and developing economies. International Journal of Energy Sector Management, 14(1), pp. 1-19. [ Links ]
[20] Cilliers, C. 2016. Benchmarking electricity use of deep-level mines. PhD in Mechanical Engineering thesis submitted to the North-West University. [ Links ]
[21] De Canha, D., Pretorius, J. & Laubster, R. 2016. Evaluation of savings from an underground fan replacement project. Proceedings of the 2016 Australasian Universities Power Engineering Conference, Australia, 51(4), pp. 15. [ Links ]
[22] Gupta, S., Mohammadi, M. & Rai, P. 2015. Performance measurement of mining equipment. International Journal of Emerging Technology and Advanced Engineering, 5(7), pp. 240-248. [ Links ]
[23] Hager, J., Yadavalli, R. & Webber-Youngman, R. 2015, Stochastic simulation for budget prediction for large surface mines in the South African mining industry. Journal of the South African Institute of Mining and Metallurgy, 115(6), pp. 531-539. [ Links ]
* Corresponding author: cvanaarde@rems2.com

