


Services on Demand
Article
 English (pdf)
 Article in xml format
 Article references
Indicators

Related links
-
 Cited by Google
 -
 Similars in Google
Share

 Permalink
South African Journal of Industrial Engineering
On-line version ISSN 2224-7890
Print version ISSN 1012-277X
S. Afr. J. Ind. Eng. vol.31 n.3 Pretoria Nov. 2020
http://dx.doi.org/10.7166/31-3-2416
SPECIAL EDITION
Consumer e-waste recycling in South Africa
R. IchikowitzI, *; T.S. HattinghII
ISchool of Mechanical, Industrial and Aeronautical Engineering, University of the Witwatersrand, Johannesburg, South Africa
IISchool of Industrial Engineering, North-West University, Potchefstroom, South Africa
ABSTRACT
Electronic waste, also known as e-waste, is the fastest growing waste stream in South Africa, and poses a serious environmental risk if mismanaged. Through appropriate recycling processes and the recovery of raw materials such as gold and copper, e-waste creates substantial financial opportunities while conserving the environment and reducing the impact of climate change. To take advantage of this source of economic growth in South Africa, the collection of e-waste needs to be improved. This investigation explores consumer perceptions about and behaviours of e-waste recycling through a household consumer survey that was conducted with participants in the Gauteng area of South Africa. It was found that there is a general lack of consumer awareness about e-waste recycling and limited pro-recycling behaviours, both influenced by underdeveloped collection mechanisms and infrastructure. Opportunities for improving household recycling are explored by considering international collection schemes, and recommendations are made considering current local challenges.
OPSOMMING
Elektroniese rommel is die bron van rommel wat die vinnigste in Suid-Afrika toeneem. Dit hou 'n ernstige omgewingsrisiko in indien dit wanbestuur word. Deur gepaste herwinningsprosesse en die verhaling van roumateriale, soos goud en koper, bied e-rommel noemenswaardige finansiële geleenthede terwyl dit die omgewing bewaar en die impak van klimaatsverandering verminder. Suid-Afrika kan voordeel trek uit hierdie bron vir potensiële ekonomiese groei deur die insameling van e-rommel te verbeter. Verbruiker persepsies oor en gedrag jeens e-rommel herwinning word ondersoek aan die hand van 'n huishoudelike verbruikergerigte meningspeiling wat onder deelnemers in Gauteng geloods is. Daar is gevind dat n algemene tekort aan verbruikerbewustheid oor e-rommel heers met beperkte pro-herwinning gebruike. Beide hierdie aspekte word deur onderontwikkelde insamelingsmeganismes en infrastruktuur beïnvloed. Geleenthede vir die verbetering van huishoudelikeherwinning is ondersoek deur internasionale insamelingskemas te oorweeg en aanbevelings onderhewig aan plaaslike uitdagings is gevolglik gemaak.
1 INTRODUCTION
1.1 Background
E-waste is the fastest growing waste stream in South Africa [1] and a global environmental hazard [2, 3, 4]. Also referred to as 'waste electrical and electronic equipment' (WEEE), e-waste is defined, for this study, as any electrical or electronic equipment that has been discarded, permanently stored, or damaged, and is no longer used.
An e-waste system consists of interdependent components that jointly manage the flow of e-waste from the point of disposal to the point where all raw materials are extracted through recycling processes. It is categorised into three stages: collection, pre-treatment, and treatment and disposal [5]. Collection is the input process into the system and can be achieved in numerous ways. Once collected, the equipment is dismantled, and its electronic components are often depopulated during the pre-treatment stage [6]. The material is then sorted and separated into different waste streams such as plastics and ferrous and non-ferrous metals. The various sorted fractions are then processed through smelting or hydro-metallurgical processes, finally leaving the system as either recycled material or residual waste entering a landfill.
1.1.1 The environmental impact of e-waste
Electronic devices contain many components with toxic constituents such as mercury, arsenic, lead, and cadmium [7]. Improper disposal of these devices through informal burning or formal incineration releases dangerous toxins into the air that have been linked to pulmonary and cardiovascular disease [3]. E-waste also poses an environmental threat if disposed of in landfills, as heavy metal contaminants and toxic particulates leach out and enter the 'soil-crop-food pathway', further endangering human health [8] and affecting aquatic organisms [2]. Recycling e-waste also positively contributes to combatting climate change, as significant energy and fossil fuels are saved when processing reclaimed metal as opposed to virgin ore [9]. Current linear production methods used for the manufacture of electronics rely almost entirely on virgin inputs of raw materials [10]. Once these raw materials are extracted from the earth, they remain 'locked up' in the system, and new material needs to be mined for future production. At the core of a successful closed-loop supply chain model lies the collection of products at the end of their life so that the reverse logistics chain can be initiated [11]. This minimises resource input and drastically reduces waste generation. As a result of the toxic and hazardous nature of e-waste, it is governed worldwide by the Basel Convention on the control of transboundary movements of hazardous wastes [12].
1.1.2 Quantifying the e-waste problem
According to the Global E-waste Monitor, 44.7 million tons (Mt) of e-waste was generated globally in 2016, translating to an average of 6.1 kg per inhabitant [13]. This is forecast to grow at an annual rate of three to four per cent as the world embraces technology further, and as devices reach the end of their lives, reaching 52.2 Mt by 2021 [13].
Estimates of South African e-waste production vary tremendously. The Global E-waste Monitor reports that 321 000 tons of e-waste was generated by South Africa in 2016 [13]. By contrast, a study by Finlay [14] in 2005 estimated e-waste generation to be between 1.12Mt and 2.1Mt per annum - a sixfold increase over the Global E-waste Monitor estimate. These estimates can tend to be inaccurate, especially in an African context, where the base data is unreliable [15]. A study conducted by Lydall, Nyanjowa and James [16] found that only 17 733 tons of e-waste was declared as processed, representing a small percentage of total e-waste generated. Regardless of the e-waste production estimates in South Africa, it is clear that there is a significant opportunity to increase the percentage and volumes of e-waste that enter the recycling system.
1.1.3 Collection rates and effects
Generally, collection rates of e-waste are poor around the globe. Asia is the largest e-waste-producing continent, and yet only recycles 15 per cent of the 18.2 Mt that it generates annually [13]. Finland is considered to have among the best e-waste management plans in the world, with an environmentally conscious population; yet there are still challenges at the collection stage [17]. South Africa can be considered to have an established recycling industry, with collection rates for tin-plate steel cans and paper at 63 per cent and 52 per cent respectively [18]; however, the collection of e-waste is estimated at only 11 per cent [19]. It has been found that most obsolete electronics in South Africa are simply stored and never enter the waste stream [18]. These poor formal collection rates result in economic value not being derived from e-waste, and also potentially have environmental consequences, including informal collection that can result in the illegal processing of e-waste. Both the trade in e-waste and its processing are highly regulated by the Basel Convention and by country-specific environmental laws. Informal trade and processing operates outside of these regulations, and can thus be used interchangeably with the term 'illegal processing'. The informal and illegal processes often result in the dumping of waste in developing countries, open-pit burning, and acid-based processing. These informal processes have all been shown to have significant health and environmental effects [20].
1.2 Research motivation
There is currently limited research surrounding the e-waste industry in South Africa. Before the report by Lydall et al. in 2017 [16], the last research was conducted over 10 years ago by Finlay and Liechti in 2008 [21] and McPherson in 2006 [18]. Ongondo, Williams and Cherrett [22] identify the collection stage as the biggest challenge for Africa, South America, and the less affluent regions of Europe and Asia. This is echoed by Lydall et al. [16], who found, through stakeholder interviews, that collection was the "single biggest challenge" facing the South African e-waste industry. Finlay and Liechti [21 ] theorised that large household items are likely to become a major contributor to e-waste volumes in South Africa, and yet a limited literature focuses specifically on consumer-based collections in South Africa. Kuehr, Honda and Khetriwal [23] identified household and business consumers as "the weakest link in the chain", and the most instrumental stakeholder on which the fate and destination of e-waste rely. Lydall et al. [16] estimate that, at current rates, 25 jobs can be created for every 1000 tons collected in South Africa, thus providing further impetus to increase the collection rate.
1.3 Research aim and objectives
The aim of this investigation is to explore the current perceptions and behaviours of South African households in Gauteng province. The intention is that the findings from the study will lead to more informed decision-making when designing e-waste collection schemes for consumers, ultimately increasing e-waste collection rates. The objectives of the work presented in this paper are to:
1. Understand consumer awareness, attitudes, and behaviours related to general and e-waste recycling;
2. Identify any demographic correlations between consumer attitudes and behaviours;
3. Comment on factors that could contribute to the low collection rates in South Africa;
4. Explore opportunities for using and adapting approaches used internationally to improve e-waste collection.
2 LITERATURE
The maturity and success of e-waste recycling systems is a function of many factors and, as a result, comprehensive frameworks have been developed to analyse e-waste recycling systems [24]. This section will focus on the financial structures and the legislative environment that influence recycling system design, generic approaches to e-waste collection, barriers and success factors for collection schemes globally, and consumer behaviour that influences the success of collection alternatives.
2.1 Financial structures
There are three primary sources of funding in recycling systems: government, producers, and consumers [25].
In some countries, governments subsidise various processes within the e-waste recycling system; but these initiatives do not come without their own challenges. In 2008, China launched the national old-for-new home appliance replacement scheme (HARS), also known as the 'old-for-new' programme, in response to the global economic downturn. Under this scheme, consumers could be subsidised up to 10 per cent of the value of a new purchase when 'returning' their old home appliance [26]. This scheme ran successfully from mid-2009 until the end of 2011, and acted to stimulate the economy by drastically increasing the availability of feedstock and encouraging the growth and development of the e-waste recycling industry. However, once the HARS programme ended, formal recyclers faced numerous problems as a result of their reliance on governmental support. In response to this, a complex e-waste disposal fund was created through which the government essentially continues to subsidise the collection and processing of e-waste.
n producer-financed structures, the producer is responsible for funding the e-waste recycling system. This is commonly referred to as 'extended producer responsibility' (EPR). Essentially, electronic manufacturers or importers bear the responsibility for managing their products throughout their lifecycle. These costs are often integrated into the price a consumer pays for their product [27]. EPR has been integrated into legislation such as the European Union's Waste Electronic and Electrical Equipment Directive [32]. In the USA, there is no federal law mandating EPR, although several states have adopted it [28]. EPR can be divided into two categories: individual producer responsibility (IPR) and collective producer responsibility (CPR), where producers can either compete or collaborate on their mandated EPR [29]. Numerous approaches to EPR have been developed, including take-back programmes, disposal bans, deposit-refund schemes, and leasing of devices [7].
Consumer-based financial structures hinge on the philosophy of 'polluter-pays' or 'pay-as-you-throw' [30]. In these structures, the consumer undertakes to fund the end-of-life disposal of their electronics in the system. The most popular mechanism for achieving this is known as an 'advanced recycling fee' (ARF): when purchasing a product, the consumer pays a fee that goes into a fund designated to subsidise the collection and processing of similar products. In some cases this fee works on a deposit-refund system: the consumer is refunded their deposit when they correctly dispose of their device.
2.2 Legislative environment
Like e-waste recycling systems, the legislation of e-waste varies substantially across the globe. Many countries have legislation in place that is specific to e-waste and encompasses elements of the system such as the flow of material and financial structures. China and the European Union are considered to have among the most established e-waste-related legislative environments in the world [31]. In 2003, the European Union issued the Waste Electronic and Electrical Equipment Directive to all its member states. The aim of this legislation is to promote the re-use, recycling, and other forms of recovery for end-of-life electronics [32]. Included in the directive are collection targets that member states need to achieve. The governments of member states are required to facilitate collection, but producers and other companies are also permitted to establish their own networks. Included is a requirement that all electronic and electrical devices sold in the EU bear a symbol that communicates landfill waste bans. China has seen a rather rapid development of its e-waste related policy in the last 17 years [33]. Their legislation is wide-ranging, and covers aspects such as stakeholder responsibilities, funding structures, and import bans.
Campen and Enders conducted a study of the African e-waste-related legislative environment [15]. It was found that most African countries have hazardous waste management legislation that covers e-waste, although very few nations have specific legislation. According to this report, legislation is planned in South Africa, with mention of a proposed extended producer responsibility tax. South Africa has 19 pieces of national legislation and between three and five by-laws per province that are applicable to e-waste, with The National Environmental Management Act of 1998 acting as the over-arching framework for environmental matters [1]. Dittke [1] suggests that enforcing relevant South African legislation is difficult owing to its complexity and the multitude of governing bodies.
The Basel Convention on the control of transboundary movements of hazardous wastes and their disposal of 1989 is an international treaty intended to reduce and regulate the international shipment of hazardous waste. E-waste is regarded as a hazardous waste stream, and thus all treaty declarations apply to it [34]. South Africa has ratified this convention, and thus should follow all its guidelines [35].
2.3 Barriers to collection
Research conducted in the European Union identified four distinct barriers to collection: situation, behaviour, lack of knowledge, and attitudes [36]. Situation refers to the location of collection schemes and the associated infrastructure. It was found that, in many cases, there was insufficient storage space, collections were infrequent, or sites were located too far away from population centres. Household disorganisation, too little time to recycle, and a lack of waste sorting routines are among the factors listed as behaviours. It was also found that consumers have a lack of knowledge or awareness of how to recycle electronics, or why it is important to do so. Finally, the opinions and perceptions of consumers, such as environmental indifference, are included under the attitude barrier. In other European research, collection infrastructure and consumer awareness are identified as barriers, adding limited government capacities and complex market structures as further challenges [37]. The correct separation of e-waste into categories is also often not feasible, resulting in co-mingled collection, which adds complexity and cost [38]. A number of attributes contribute to the success of collection schemes, of which the following were deemed most applicable in a South African context [39,40]:
• Offering a valuable incentive to consumers to encourage participation in the scheme
• High throughput volumes to drive economies of scale
• Value-conserving logistics to minimise logistics costs
• Low labour costs
2.4 Consumer recycling behaviours
The reasons for which consumers tend to dispose of electronic products can be categorised as follows [41]:
1. Device is non-functional
2. Consumer no longer wants the device
3. Device is replaced with a newer version
4. Repair is too costly
5. Device is lost or stolen
Estrada-Ayub and Kahhat [42] investigated decision factors surrounding the changing, storing, or disposing of computers. It was found that perceived value was the most significant decision factor for consumers at a micro-level.
Once an electronic device has become 'waste', it is then either stored or disposed of. Devices are often forgotten about after being replaced, and so end up being 'hibernated', or stored for long periods of time in households [43]. When consumers do decide to dispose of electronic devices that are not longer wanted, numerous disposal routes are available [41, 44]. Devices can be:
1. Given to family, friends, or colleagues
2. Disposed of with other household waste in the general garbage
3. Sent for repair to regain functionality
4. Sold as a functional device on the second-hand market
5. Sold informally to e-waste collectors
6. Sold or given to formal e-waste collectors/stakeholders
7. Donated to a charity
Several models aim to understand consumer behaviours when faced with the opportunity to recycle e-waste. Tanskanen [4] proposes a model with five direct factors that influence a consumer's recycling behaviour: accessibility, information, attitude, incentive, and demographics. Xu, Wang, Sun and Abdullah [45] used the theory of planned behaviour to develop a conceptual model that describes the driving forces of e-waste recycling intention in China. The model proposes three factors that have a direct influence on customer intentions: subjective norms, perceived behavioural control, and recycling attitude; while environmental knowledge, recycling experience, and legal advocacy have moderating effects on this intention-behaviour system. Although recycling behaviours differ across geographic regions, it has been found that age [46] and education level [47] are also important indicators of recycling behaviour. Several studies have developed surveys to understand recycling behaviours [44, 45]. Dunlap, Van Liere and Mertig [48] propose a scale called the 'new environmental paradigm', which has been used in similar studies to test the pro-environmental orientation [49].
2.5 Approaches to collection
Household consumers, businesses, and government institutions are the three primary groups that are targeted for the collection of e-waste [6]. Different methods have evolved for each group, and they vary greatly depending on the country and its circumstances [50]. Through a review of the literature, fourteen different types of collection schemes were identified. These schemes were found to fit into three broad categories: 'bring', 'pick-up', and 'send'. 'Bring' schemes require the consumer to take their e-waste to a collector. In 'pick-up' schemes, the collector will fetch the e-waste; and in 'send' schemes, the consumer will send their e-waste via a third party to the collector.
"Bring schemes include drop-off bins, charity stores, recycling collections, and incentivised retail trade-ins. Bring schemes can also include deposit systems, where a deposit paid at purchase is refunded when the product is returned at the end of its life, and collection ATMs where e-waste can be deposited into a machine that runs a diagnostic, calculates the value of the device, and dispenses cash directly to the consumer. Pick-up schemes include door-to-door collection where, typically in the informal sector, a trader will visit communities and offer to buy waste directly from households; or various pick-up schemes from household alternatives that can be incentivised, un-incentivised, or paid for by the consumer. Send schemes include incentivised and un-incentivised courier services, or an exchange process when ordering new devices online such that e-waste can be returned with the courier who delivered the new purchase.
The e-waste collection schemes that were identified from the literature were evaluated against the barriers to collection and the success factors, resulting in four schemes that were deemed to have the most potential for consideration [52]. These four schemes were:
1. Incentivised retail trade-in
2. Deposit/refund system
3. Automated collection schemes
4. Courier collection as a return from an online store
5. Of these identified collection schemes, only incentivised retail trade-ins were operational in South Africa at the time of this study.
3 RESEARCH APPROACH
3.1 E-waste categories
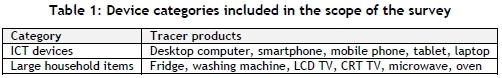
The scope of different types of e-waste has been narrowed, according to guidelines published by the Swiss e-waste programme [52]. These guidelines recommend that e-waste be split into four main categories, each with specific 'tracer' products. These tracer products are then used as indicators for the whole category. Cucchiella, D'Adamo, Koh and Rosa [53] determined that smartphones, laptop computers, and tablets (also known as ICT devices) are the most valuable e-waste sub-categories per unit weight, owing to their high concentrations of precious metals. This study focuses on two categories, with the tracer products for each listed in Table 1.
3.2 Demographic target
The survey was designed for respondents who potentially have a high number of electronic devices; a living standards measure (LSM) range of LSM 8-10 [54] was thus targeted. This LSM range was chosen, as nine of the twenty variables measured by the index refer to electronic devices. The LSM index also typically has a high correlation with other demographic measures such as household income. The survey targeted adults in the Gauteng province of South Africa, since it contains the highest population and the highest urban population in the country, suggesting that it has the highest volumes of e-waste generation [55].
3.3 Survey format and structure
The survey was created and distributed electronically using a Google Form. The survey consisted of forty-three questions divided into six sections. The questions drew on the literature on consumer behaviour to do with recycling. The aim of each section of the survey is summarised in Table 2.
Convenience sampling was used, with responses collected from colleagues, friends, and family (via Facebook and WhatsApp), by approaching shoppers in shopping malls (Sandton City and Eastgate Mall), and by approaching employees of an engineering firm and a pharmaceutical company.
3.4 Survey data analysis
An average LSM and household income for each respondent was calculated, based on the suburb in which they resided, using the ROOTS Market Research and Insights Survey [56]. While not entirely accurate, this data gives insights into a respondent's income and standard of living without having to ask sensitive information, which can decrease participation. Frequency plots and descriptive statistics have been used in this paper to present the results. Correlation analysis using the Pearson correlation co-efficient and Guilford's interpretation of the magnitude of r [57] was performed on all numerical variables present in the data set to identify relationships between variables.
4 RESULTS AND DISCUSSION
Selected results from the survey will be discussed in this section. The presentation will be organised using the same section descriptions that were used for the survey.
4.1 Respondent information
Responses were received from 129 respondents across Gauteng. Respondent ages ranged from 18 to 88 years old (average of 39 years) and the LSM ranged from 6.3 to 8.9 (average of 8.8). While the survey was designed for a higher LSM, all relevant variables relating to the ownership of electronic devices are met in the sample. Although unintended, two responses were also received from the Western Cape province. Gender was split, with 43 per cent female and 57 per cent male respondents.
4.2 Sentiments towards recycling
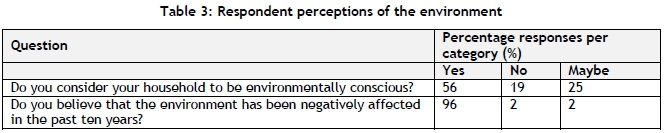
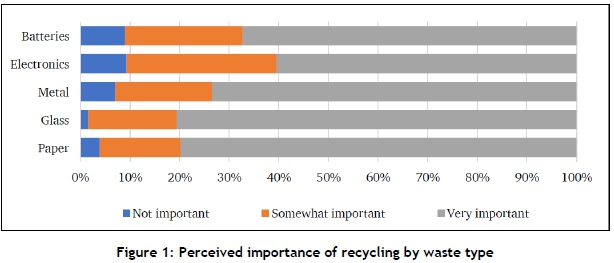
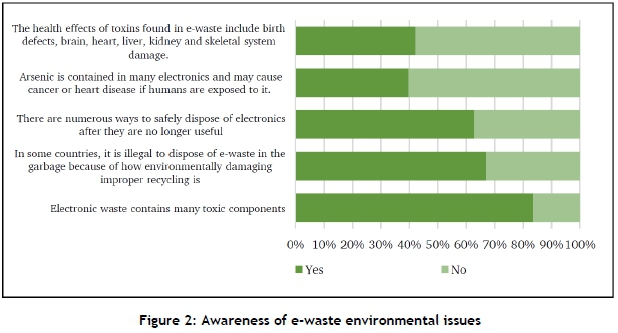
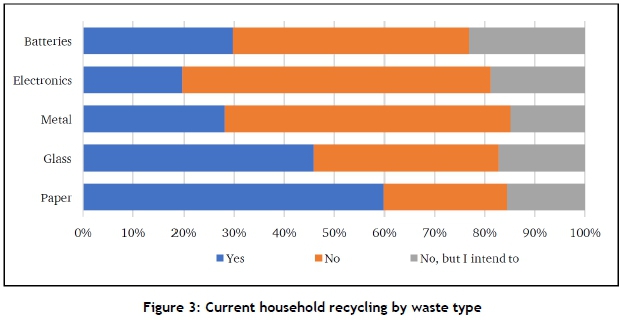
This section highlights respondent beliefs about and behaviours in recycling in general. Table 3 presents high-level respondent perceptions of the environment, while Figure 1 presents respondents' perceived importance of recycling by waste type. This is followed by an overview of respondents' awareness of the environmental issues associated with e-waste (Figure 2), and actual current recycling behaviours (Figure 3).
It can be seen that 96 per cent of respondents agree that the environment has been negatively affected in the past 10 years (Table 1 ). In addition, 84 per cent of respondents are aware that e-waste contains toxins, yet 57 per cent of respondents are not aware of the actual impact of these toxins (Figure 2), suggesting that respondents have only a superficial awareness of the dangers of e-waste. Respondents also agreed with statements that recycling creates jobs and reduces the use of landfills. Despite these sentiments, only 56 per cent of respondents consider their household to be environmentally conscious (Table 1). Paper is the most commonly recycled waste, with 60 per cent of respondents actively recycling it. For the balance of waste types, most respondents do not currently recycle. Electronics are the least recycled waste type, with a positive response of only 20 per cent (Figure 3). These results highlight a disconnect between the perceptions and beliefs of respondents and their actions or recycling behaviours. The disconnect could, in part, be owing to the awareness and effectiveness of current collection schemes in South Africa. It could also perhaps be owing to low observed awareness of the adverse effects that e-waste can have on human health and the environment. This reasoning is confirmed by the moderate positive correlation (r = 0.45) found between the awareness of dangers associated with e-waste and the perceived importance of recycling electronics and batteries. Xu, Wang, Sun and Abdullah [45] suggest that environmental knowledge can be a driving force of recycling attitude. This notion will be explored further in sections to follow. The intention to recycle ranges between 15 and 22 per cent of respondents across waste streams (Figure 3), indicating an existing opportunity to increase recycling if barriers can be understood and addressed.
No substantial correlations were found between age, gender, average household income, or LSM against the extent to which a household recycles, the perceived importance of recycling, or awareness of e-waste, with all Pearson coefficients in the range -0.12; +0.20. It was found that recycling tends to increase with an increase in age [r = 0.2], with respondents over 60 years recycling up to 40 per cent more than respondents aged between 25 and 30 years old. The lack of substantial correlations is similar to findings in the literature [49]. The only literature with contrary findings is from India, where willingness to recycle e-waste, and participation in it, increased with an increase in household income [40].
4.3 Quantifying e-waste
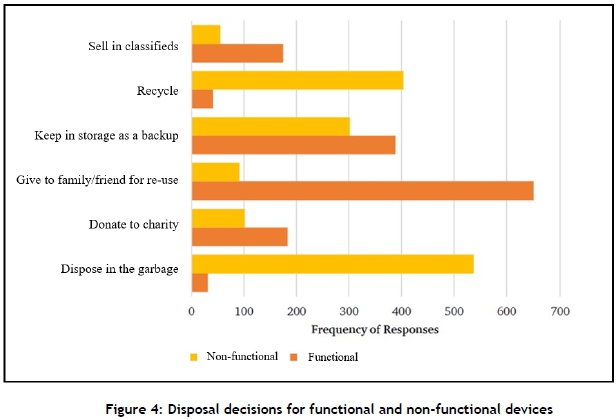
This section explores the nature of e-waste in households, and probes e-waste-related decision-making. Figure 4 shows disposal decisions and how these vary between functional and non-functional e-waste. The survey also explored differences between disposal behaviours for large household items and ICT devices. Giving e-waste to family or friends for re-use was the most popular disposal decision, while recycling was the least popular. Functional and non-functional ICT devices were more likely to be kept in storage than household items, and household items were more likely to be disposed of in the garbage, whether or not they were functional. A possible reason is the inconvenience of having a non-functional large appliance (such as a fridge) take up space, compared with the relatively low inconvenience of having a mobile phone lying in a drawer. This assumption is corroborated by Mishima and Nishimura [43], whose research found that many small electronics are hibernated owing to their small size and ease of storage. There were significant changes in disposal decisions, based on whether devices or items were functional or nonfunctional. Disposal in the garbage increased by an average factor of 17 for non-functioning e-waste.
Notably, recycling increased by a factor of nearly 10 for non-functional e-waste; however, this decision represented only 26 per cent of decisions made for non-functional e-waste. The survey also investigated the reasons for replacing items or devices that did not vary significantly between the different e-waste categories. Non-functionality was the reason for replacing 40 per cent of the devices or items. When augmented with e-waste that is too costly to repair, it can be deduced that 50 per cent of e-waste would be non-functional at the point of disposal.
4.4 Viability of collection methods
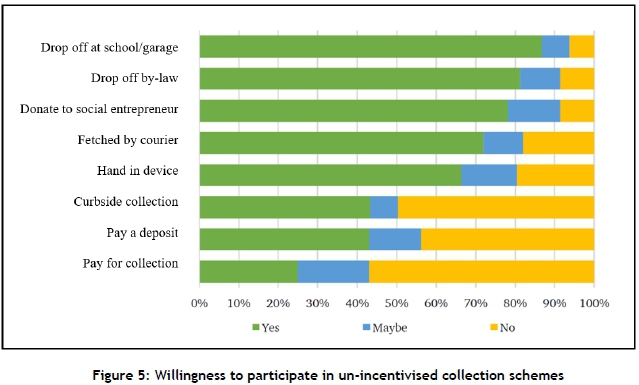
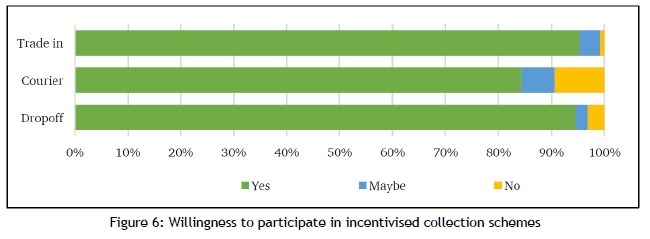
This section explores the extent to which some of the barriers identified in the literature prevent e-waste recycling, and probes the willingness to participate in different collection schemes, also identified from the literature. For this study, it is assumed that willingness to participate in a scheme will have a high correlation with actual participation and, therefore, that willingness is an indicator of behaviour. Figures 5 and 6 indicate respondents' willingness to participate in different types of collection schemes. In the survey, questions were first asked about schemes that offered no incentive, so that respondents were not prejudiced by preferring to participate in a scheme with incentives. Respondents were most eager to dropoff their e-waste at convenient locations such as schools or fuel stations, with 86 per cent indicating their willingness to participate. Only 24 per cent of respondents were willing to pay for their e-waste to be collected. Willingness to participate in schemes increased when an incentive was offered. The most significant increase occurred between handing in a device for free when purchasing a new one against receiving an incentive by trading the device in. The survey did not make specific mention of which types of incentives, or their value, would be offered; and that would have had an impact on these results.
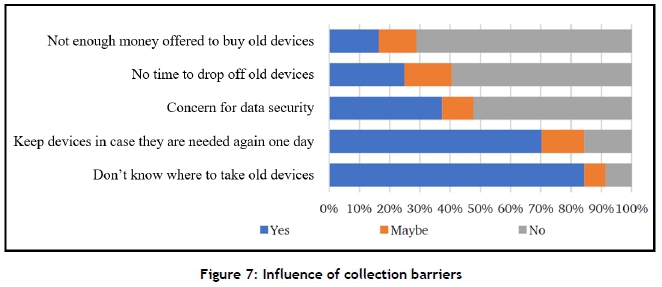
Lack of knowledge about where to take old devices and keeping devices for re-use were the primary collection barriers experienced by respondents, as shown in Figure 7. Only 37 per cent of respondents cited data security as a reason for not recycling their electronics, and 70 per cent of respondents reported storing devices as a backup. As a result, many functional devices did not enter the waste stream. Devices that are stored have a high likelihood of becoming obsolete as technology develops, leading to dormant e-waste. These results provided interesting insights into designing and improving collection schemes. The survey results are supported by similar research by Pocock et al. [41], who found that the unprompted awareness of e-waste recycling schemes in the UK was measured at only 18 per cent. A study of a South African municipality, the Mangaung Metropolitan Municipality, found that 75 per cent of respondents were unaware of how collection schemes handle their e-waste [58]. Interestingly, high awareness in Finland did not necessarily translate into recycling behaviour [17], suggesting the complexity of recycling collection schemes.
4.5 Perceived value of devices
It has been shown that incentives drive a willingness to participate in collection schemes; however, if the value of the incentive offered is substantially less than the value that a consumer perceives their device to be worth, the increase in participation might become marginal. Perceived value is therefore a primary motivator of whether to store or sell a device [42]. To investigate this, the survey collected data about respondents' perceived value of devices. The perceived value as a percentage of the original price for functional devices was an average of 30 per cent, with a median of 26 per cent and a standard deviation of 20 per cent. For non-functional devices, the average was nine per cent, the median was five per cent, and the standard deviation was 12 per cent. Respondents' perceptions varied more for functional devices, which is to be expected because of the different economic utility that consumers obtain from a functional device. The utility would be dependent on their satisfaction with the device, its condition, and its perceived fashion status. A non-functional device, however, offers the same marginal utility to a consumer, regardless of the factors mentioned above.
4.6 Changes to legislation
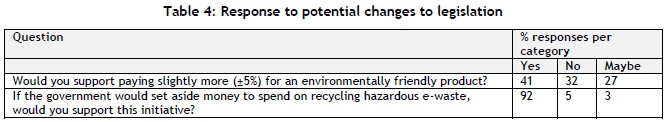
As discussed in the literature review, there are opportunities to influence e-waste recycling through legislation. Two legislative proposals were presented to respondents, informed by the literature. The results in Table 4 show that 92 per cent of respondents indicated that they would support a government e-waste recycling fund; however, when respondents were asked whether they would be willing to pay a small contribution into the fund in the form of a premium for an environmentally friendly product, the support dropped by 51 per cent to only 41 per cent who agreed to pay slightly more. This suggests that consumers have an expectation that the government should fund part of an e-waste recycling system.
5 CONCLUSIONS AND RECOMMENDATIONS
There is a general lack of participation in e-waste recycling that appears to stem from a lack of awareness of the dangers of e-waste and of the options available for e-waste recycling. About one-third of nonfunctional ICT and household appliance e-waste was disposed of in the general garbage stream at the time of this study. A large percentage of e-waste also remained dormant in households. However, there was a willingness among respondents to participate in e-waste recycling, which was increased by offering incentives for collections and by making the process of recycling more convenient.
Currently, an overwhelming percentage of circuit boards and plastics collected for recycling in South Africa are exported due to a lack of infrastructure [51]. While this could incentivise new business creation, it could also discourage small-scale entrepreneurs from entering the value chain. There seems to be a vicious cycle here: companies are discouraged from setting up collection operations because of a small domestic market, but there is a small domestic market because of the low collection rates. To break this cycle, it is suggested that the South African government, in partnership with the private sector, commission a study to explore methods to stimulate the e-waste collection economy in order to boost the development of a system that can become self-sufficient and sustainable.
An evaluation of potentially suitable collection schemes was undertaken as part of this broader study [51]. This evaluation was based on success factors identified from the literature and from the responses that were collected as part of the survey. It was found that trade-in based schemes show great potential, both for retail store-based and online store options. Both of these schemes offer an incentive in the form of a rebate or voucher, and have the potential to create sustainable throughput volumes by using the large footprints of supermarkets or online stores. These schemes also do not require a central waste management body (which is currently not present in South Africa). A potential limitation of these options is the mismatch between the perceived and the realistic value of e-waste, which presents an area for further study.
ORCID® identifiers
R. Ichikowitz: https://orcid.org/0000-0001-9745-1673
T.S. Hattingh: https://orcid.org/0000-0001-5930-2546
REFERENCES
[1] Dittke, M. 2007. A review of South African environmental and general legislation governing e-waste. eWASA, Johannesburg, South Africa. [ Links ]
[2] Dagan, R., Dubey, B., Bitton, G., & Townsend, T. 2007. Aquatic toxicity of leachates generated from electronic devices. Archives of Environmental Contamination and Toxicology, 53(2), 168-173. http://doi.org/10.1007/s00244-006-0205-1 [ Links ]
[3] McAllister, L. 2013. The human and environmental effects of e-waste. Population Reference Bureau. Retrieved October 8, 2020 from https://www.prb.org/e-waste/ [ Links ]
[4] Tanskanen, P. 2013. Management and recycling of electronic waste. Acta Materialia, 61(3), pp. 1001-1011. [ Links ]
[5] Mars, C., Nafe, C. , & Linnell, J. 2016. The electronics recycling landscape report. The Sustainability Consortium, Arizona State University. Retrieved October 8, 2020 from https://www.sustainabilityconsortium.org/wp-content/themes/enfold-child/assets/pdf/TSC_Electronics_Recycling_Landscape_Report_Summary.pdf [ Links ]
[6] Honda, S., Kuehr, R., & Khetriwal, D.S. 2016. Regional e-waste monitor: East and Southeast Asia. United Nations University ViE - SCYCLE, Bonn, Germany. [ Links ]
[7] Jaiswal, A., Samuel, C., Patel, B.S. & Kumar, M. 2015. Go green with WEEE: Eco-friendly approach for handling e-waste. Procedia - Procedia Computer Science, 46, pp. 1317-1324. [ Links ]
[8] Robinson, B.H. 2009. E-waste: An assessment of global production and environmental impacts. Science of the Total Environment, 408(2), 183-191. [ Links ]
[9] Stablum, A. 2008. Climate change spurs scrap metal recycling. Retrieved August 7, 2017 from http://www.reuters.com/article/us-metals-scrap-climateidUSL0488184720080604 [ Links ]
[10] Jardim, E. 2017. From smart to senseless: The global impact of 10 years of smartphones. Washington: Greenpeace Inc. [ Links ]
[11] Habibi, M.K.K., Battaïa, O., Cung, V.-D. & Dolgui, A. 2017. Collection-disassembly problem in reverse supply chain. International Journal of Production Economics, 183(Part B), 334-344. http://doi.org/10.1016/j.ijpe.2016.06.025 [ Links ]
[12] Basel Convention on the Control of Transboundary Movements of Hazardous Wastes and their Disposal. 1992. 5 May 1992. United Nations treaty database. [ Links ]
[13] Baldé, C.P., Forti, V., Gray, V., Kuehr, R. & Stegmann, P. 2017. The global e-waste monitor 2017: Quantities, flows and resources, United Nations University (UNU), International Telecommunication Union (ITU) & International Solid Waste Association (ISWA), Bonn/Geneva/Vienna. [ Links ]
[14] Finlay, A. 2005. E-waste challenges in developing countries: South Africa case study. APC Issue Papers. Association for Progressive Communications. Retrieved October 8, 2020 from https://www.apc.org/sites/default/files/e-waste_EN.pdf (November). [ Links ]
[15] Campen, A. & Enders, S. 2016. WEEE legislation in Africa - Status and future developments. In Electronics goes green 2016+ (EGG), pp 1-4, IEEE. http://dio.org/10.1109/EGG.2016.7829836 [ Links ]
[16] Lydall, M., Nyanjowa, W. & James, Y. 2017. Mapping South Africa's waste electrical and electronic equipment (WEEE). Dismantling, pre-processing and processing technology landscape, Waste research development and innovation roadmap research report. Mintek external report prepared for the Department of Science and Technology and the Council for Scientific and Industrial Research. Retrived October 8, 2020 from http://futurespot.co.za/pdfs/weee_technology_landscape_assessment_report.pdf [ Links ]
[17] Yla-Mella, J., Poikela, K., Lehtinen, U., Keiski, R.L. & Pongrácz, E. 2014. Implementation of waste electrical and electronic equipment directive in Finland: Evaluation of the collection network and challenges of the effective WEEE management. Resources, Conservation and Recycling, 86, pp. 38-46. http://doi.org/10.1016Aj.resconrec.2014.02.001 [ Links ]
[18] Widmer, R., & Lombard, R. 2005. E-waste assessment in South Africa - A case study of Gauteng Province, A report of the Swiss global e-waste programme «Knowledge partnerships in e-waste recycling>>, St. Gallen, Switzerland. [ Links ]
[19] Department of Environmental Affairs. 2012. National waste information baseline report. Department of Environmental Affairs. Pretoria, South Africa. [ Links ]
[20] Forti, V., Baldé, C.P., Kuehr R. & Bel G. 2020. The Global E-waste Monitor 2020: Quantities, flows and the circular economy potential. Bonn/Geneva/Rotterdam: United Nations University (UNU)/United Nations Institute for Training and Research (UNITAR) - co-hosted SCYCLE Programme, International Telecommunication Union (ITU) and International Solid Waste Association (ISWA). [ Links ]
[21] Finlay, A. & Liechti, D. 2008. E-waste assessment South Africa, e-Waste Association of South Africa, Retrieved October 8, 2020 from http://citeseerx.ist.psu.edu/viewdoc/download?doi=10.1.1.476.1116&rep=rep1&type=pdf [ Links ]
[22] Ongondo, F.O., Williams, I.D. & Cherrett, T.J. 2011. How are WEEE doing? A global review of the management of electrical and electronic wastes. Waste Management, 31(4), pp. 714-730. http://doi.org/10.1016/j.wasman.2010.10.023 [ Links ]
[23] Honda, S., Kuehr, R., & Khetriwal, D.S. 2016. Regional e-waste monitor: East and Southeast Asia. United Nations University ViE - SCYCLE, Bonn, Germany. [ Links ]
[24] Fredholm, S. 2008. Evaluating electronic waste recycling systems: The influence of physical architecture on system performance, Doctoral dissertation, Massachusetts Institute of Technology. [ Links ]
[25] Li, J., Liu, L., Zhao, N., Yu, K. & Zheng, L. 2013. Regional or global WEEE recycling. Where to go? Waste Management, 33(4), pp. 923-934. http://doi.org/10.1016/j.wasman.2012.11.011 [ Links ]
[26] Liu, C. 2014. How does the Chinese e-waste disposal fund scheme work?, Case study prepared for the OECD, Retrieved October 8, 2020 from www.oecd.org/env/waste/gfenv-extendedproducerresponsibility-june2014.htm. [ Links ]
[27] Zhou, W., Zheng, Y. & Huang, W. 2016. Competitive advantage of qualified WEEE recyclers through EPR legislation. European Journal of Operational Research, 257(2), pp. 1-15. http://doi.org/10.1016Aj.ejor.2016.07.050 [ Links ]
[28] PSI. 2014. Electronics EPR: A case study of state programs in the United States. Boston, MA: Product Stewardship Institute. [ Links ]
[29] Atasu, A. & Subramanian, R. 2012. Extended producer responsibility for e-waste: Individual or collective producer responsibility? Production and Operations Management, 21(6), pp. 1042-1059. http://doi.org/10.1937-5956.2012.01327.x [ Links ]
[30] Chi, X., Streicher-Porte, M., Wang, M.Y.L. & Reuter, M.A. 2011. Informal electronic waste recycling: A sector review with special focus on China. Waste Management, 31(4), pp. 731-742. http://doi.org/10.1016/j.wasman.2010.11.006 [ Links ]
[31] Zeng, X., Li, J., Stevels, A.L.N. & Liu, L. 2013. Perspective of electronic waste management in China based on a legislation comparison between China and the EU. Journal of Cleaner Production, 51(c), pp. 80-87. http://doi.org/10.1016/Joclepro.2012.09.030 [ Links ]
[32] European Union. 2003. Directive 2002/96/EC of the European Parliament and of the Council of 27 January 2003 on waste electrical and electronic equipment (WEEE). Official Journal of the European Union, 1-15. [ Links ]
[33] Wang, F., Kuehr, R., Ahlquist, D., & Li, J. 2013. E-waste in China: A country report, United Nations University / StEP Initiative. Retrieved October 8, 2020 from https://collections.unu.edu/eserv/UNU:1624/ewaste-in-china.pdf1-60. [ Links ]
[34] Lambrechts, D. & Hector, M. 2016. Environmental organised crime: The dirty business of hazardous waste disposal and limited state capacity in Africa. Politikon, 43(2), pp. 251-268. http://doi.org/10.1080/02589346.2016.1201727 [ Links ]
[35] Department of International Relations and Cooperation. 2003. Secretariat of the Basel Convention (Geneva). Department of Foreign Affairs, Republic of South Africa. Retrieved from http://www.dirco.gov.za/foreign/Multilateral/inter/basel.htm [ Links ]
[36] Gurauskienè, I. 2008. The behaviour of consumers as one of the most important factors in e-waste problem. Environmental Research, Engineering & Management, 46(4), pp. 56-64. [ Links ]
[37] Magalini, F., Wang, F., Huisman, J. & Kuehr, R. Baldé, K., Straalen, V.v., Hestin, M., Lecerf, L., Sayman, U., & Akpulat, O. 2016. Study on collection rates of waste electrical and electronic equipment (WEEE). European Commission. Retrieved October 8, 2020 from https://www.researchgate.net/publication/297453161_Study_on_Collection_Rates_of_Waste_Electrical_and_Electronic_Equipment_WEEE_possible_measures_to_be_initiated_by_the_Commission_as_required_by_Article_74_75_76_and_77_of_Directive_201219EU_on_Waste_El [ Links ]
[38] Pretz, T. 2016. Newer strength in WEEE collection, sorting and mechanical processing, Retrieved October 8, 2020 from https://www.researchgate.net/profile/Karoline_Raulf/publication/308721264_Newer_Strength_in_WEEE_Collection_Sorting_and_Mechanical_Processing/links/57ecd5bd08ae92a5dbd085fc/Newer-Strength-in-WEEE-Collection-Sorting-and-Mechanical-Processing.pdf [ Links ]
[39] Kissling, R., Coughlan, D., Fitzpatrick, C., Boeni, H., Luepschen, C., Andrew, S. & Dickenson, J. 2013. Success factors and barriers in re-use of electrical and electronic equipment. Resources, Conservation and Recycling, 80, pp. 21-31. [ Links ]
[40] Dwivedy, M. & Mittal, R.K. 2013. Willingness of residents to participate in e-waste recycling in India. Environmental Development, 6, pp. 48-68. http://doi.org/10.1016/j.envdev.2013.03.001 [ Links ]
[41] Pocock, R., Clive, H. & Coss, D., & Wells, P. 2011. Realising the reuse value of household WEEE, Retrieved October 8, 2020 from https://www.wrap.org.uk/sites/files/wrap/WRAP%20WEEE%20HWRC%20summary%20report.pdf 1-25. [ Links ]
[42] Estrada-Ayub, J.A. & Kahhat, R. 2014. Decision factors for e-waste in Northern Mexico: To waste or trade. Resources, Conservation and Recycling, 86, pp. 93-106. http://doi.org/10.1016/j.resconrec.2014.02.012 [ Links ]
[43] Mishima, K. & Nishimura, H. 2016. Requirement analysis to promote small-sized e-waste collection from consumers. Waste Management & Research, 34(2), pp. 122-128.http://doi.org/10.1177/0734242X15615424 [ Links ]
[44] Milovantseva, N. & Saphores, J.-D. 2013. E-waste bans and U.S. households' preferences for disposing of their e-waste. Journal of Environmental Management, 124, pp. 8-16. http://doi.org/10.1016/j.jenvman.2013.03.019 [ Links ]
[45] Xu, F., Wang, X., Sun, X. & Abdullah, A. 2014. Influencing factors and moderating factors of consumers' intentions to participate in e-waste recycling, 11th International Conference on Service Systems and Service Management (ICSSSM). IEEE, 2014. pp. 1-6. [ Links ]
[46] Marinesc, C. & Cicea, C. 2017. Socioeconomic factors affecting e-waste collection rate in countries from European Union. Proceedings of the 10th International Management Conference Bucharest, Romania, 1-9. [ Links ]
[47] Tonglet, M., Phillips, P.S. & Read, A.D. 2004. Using the theory of planned behaviour to investigate the determinants of recycling behaviour: A case study from Brixworth, UK. Resources, Conservation and Recycling, 41(3), pp. 191-214. http://doi.org/10.1016/j.resconrec.2003.11.001 [ Links ]
[48] Dunlap, R., Van Liere, K. & Mertig, A. 2000. Measuring endorsement of the new ecological page 70 of 111 paradigm: A revised NEP scale. Society of Psychological Study of Social Issues, 1-18. [ Links ]
[49] Saphores, J.-D.M., Ogunseitan, O.A. & Shapiro, A.A. 2012. Willingness to engage in a pro-environmental behavior: An analysis of e-waste recycling based on a national survey of U.S. households. Resources, Conservation and Recycling, 60, pp. 49-63. http://doi.org/10.1016/j.resconrec.2011.12.003 [ Links ]
[50] Kahhat, R., Kim, J., Xu, M., Allenby, B., Williams, E. & Zhang, P. 2008. Exploring e-waste management systems in the United States. Resources, Conservation and Recycling, 52(7), pp. 955-964. http://doi.org/10.1016/j.resconrec.2008.03.002 [ Links ]
[51] Ichikowitz, R. 2017. An investigation into the South African electronic waste system: A report with a focus on consumer-based collection. Unpublished final year project. School of Mechanical, Industrial and Aeronautical Engineering, University of the Witwatersrand, Johannesburg. [ Links ]
[52] Schluep, M., Muller, E., & Rochat, D. 2012. E-waste assessment methodology training & reference manual, 1106. Retrieved October 8, 2020, from https://www.sustainable-recycling.org/e-waste-assessment-methodology-training-reference-manual/ [ Links ]
[53] Cucchiella, F., D'Adamo, I., Koh, S.C.L. & Rosa, P. 2015. Recycling of WEEEs - An economic assessment of present and future e-waste streams. Renewable and Sustainable Energy Reviews, 51(C), pp. 263-272. http://doi.org/10.1016Aj.rser.2015.06.010 [ Links ]
[54] SAARF. 2001. South African Audience Research Foundation - Living standards measure. Retrieved August 9, 2017, from http://www.saarf.co.za/lsm/lsms.asp [ Links ]
[55] StatsSA. 2019. Mid-year population estimates. Pretoria: Department of Statistics South Africa. [ Links ]
[56] SparkMedia. 2016. Gauteng | ROOTS | Spark Media, 1-3. Retrieved October 8, 2020 from http://sparkmedia.co.za/roots-insights/gauteng/ [ Links ]
[57] Lachenicht, L. 2013. Correlations. In C. Tredoux, Numbers, hypotheses & conclusions (2nd ed.). Cape Town, South Africa: Juta and Company Ltd. [ Links ]
[58] Rajaram, V. & Pekeur, D.S.W. 2014. Assessing e-waste management within the Mangaung Metropolitan Municipality, South Africa. Arabian Journal of Business and Management Review (OMAN Chapter), 3(11), pp. 1-41 [ Links ]
* Corresponding author: ruby@ichikowitz.com

