


Servicios Personalizados
Articulo
 Inglés (pdf)
 Articulo en XML
 Referencias del artículo
Indicadores

Links relacionados
-
 Citado por Google
 -
 Similares en Google
Compartir

 Permalink
South African Journal of Industrial Engineering
versión On-line ISSN 2224-7890
versión impresa ISSN 1012-277X
S. Afr. J. Ind. Eng. vol.31 no.3 Pretoria nov. 2020
http://dx.doi.org/10.7166/31-3-2423
SPECIAL EDITION
Synthesis and evaluation of an Industry 4.0 control room
E.L. HugoI, *; J.E.W. HolmII
IDepartment of Industrial Engineering, North-West University, South Africa
IIDepartment of Electrical & Electronic Engineering, NorthWest University, South Africa
ABSTRACT
The technological world is ever-evolving, and industries worldwide must match the pace of inevitable change. We are in the midst of the fourth industrial revolution, and many are suggesting that there may be a fifth industrial revolution in sectors where human interaction is critical. Control rooms are important functional units in many industries, which raises the question of the relevance of Industry 4.0 technologies in the modern-day control room system. A focus area of this study includes defining a generalised operational architecture of a real-world control room with event management functionality - the 'AS-IS' model. The impact of intelligent technologies on typical control room operations is modelled holistically ('TO-BE'), and compared with contemporary control rooms to unearth design considerations for future control room development.
OPSOMMING
Die tegnologiese wêreld ontwikkel voortdurend en industrieë wêreldwyd moet aanpas by die tempo van verandering. Die mensdom is in die middel van 'n vierde industriële rewolusie gewikkel en daar is sprake van 'n vyfde rewolusie in sektore waar menslike interaksie krities is. Beheerkamers vorm 'n belangrike funksionele element van baie industrieë, wat die vraag na vore bring oor die toepaslikheid van Industrie 4.0 tegnologie in 'n moderne beheerkamerstelsel. Die fokus van hierdie studie sluit die definisie van 'n veralgemeende bedryfsargitektuur van 'n regte-wêreld beheerkamer in, met inagneming van gebeurlikheidsbestuurfunksies - die huidige of 'AS-IS' model. Die impak van intelligente tegnologie op 'n tipiese beheerkamer se bedryf word holisties gemodelleer (die toekomstige of 'TO-BE' model) en word vergelyk met kontemporêre beheerkamers om die ontwerpsoorwegings van 'n toekomstige beheerkamer te ontgin.
1 INTRODUCTION
Significant technological advancements have been made in recent years, and Industry 4.0 technologies have proven revolutionary in many fields. This paper analyses the effects of Industry 4.0 methods in a control room system through alterations to a simulated 'AS-IS' system. If applicable methods and technologies can be identified and proven effective, it may assist the designers of modern control rooms to develop more efficacious systems in the future.
Control rooms are used in various industries, including nuclear power generation, traffic control, and private security [1]. Although these industries are explicitly unique, the fundamental control room function of event management is universal. In this analysis, the focus will be on a security control room, as it is the real-world system that is under investigation.
In a security control room, incoming events are typically categorised as either incidents or false alarms; and it is the task of an operator to classify events as either of these categories. The classification must be done promptly, for if the event is indeed an incident, it may escalate and result in material and related intangible losses.
The number of sites served by a control room typically depends on whether the system is loosely or tightly integrated. Tightly integrated systems, such as nuclear power plant systems, serve a single site, whereas loosely integrated systems, such as traffic control or some security settings, serve many sites over various geographic locations simultaneously. The control room of interest, the security control room, is thus an example of a loosely integrated operational system, as opposed to a highly automated tightly integrated system.
Typically, control rooms in a loosely integrated system do not perform high levels of proactive surveillance, but rather monitor reactively. This is natural, since a few operators cannot keep track of real-time phenomena on literally thousands of distributed sites. Therefore, these control rooms act largely on a reactive basis, and the focus of control room operators is on events originating at the monitored sites.
2 SUMMARY OF THE LITERATURE AND THEORY
2.1 Event management
Event management is important in the control room environment, as the operational worth of a control room is dependent on its ability to manage events. The most important goal of event management is to restore the system to its normal operating conditions as quickly as possible [2]. This is to ensure that the best possible levels of service are provided, and that minimal downtime is experienced.
Event management, in its abstract form, is similar in control rooms over various industries. In the security control room environment, an important goal is to lower the allowed incident escalation time by reacting timeously to an event. This is not only the case for security control rooms, since incidents in other industries may also escalate over time. Examples include an attack on confidential information in the IT industry, and a road accident in the traffic control industry. The objective, therefore, is to manage events effectively to get incidents under control and arrest escalation.
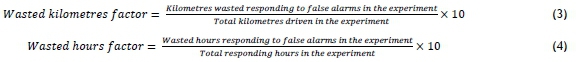
The steps in an event management process are shown in the flowchart in Figure 1. After (i) an event has been reported, (ii) a decision is made as to its severity, after which (iii) appropriate action is taken, and (iv) the event is closed. Should an event be a false alarm, its severity is negligible, and no action is taken at the time. However, in the case of an actual incident, the type of incident will determine the severity, and reaction personnel are dispatched to get the incident under control. The additional steps that are shown above (pertaining to the management of an event over its life cycle) do not directly influence the escalation of incidents, as these steps only occur after the event is under control.
The tasks in the flowchart in Figure 1 are executed using different resources, which will be discussed in the sections to follow. These resources are deployed in a particular 'AS-IS' configuration - the configuration currently employed by the control room system under investigation. The system includes distributed monitoring points (sites) that form part of the analysis, as these sites interface with the main control room and the reactive resources. The 'TO-BE' configuration will take on a different form as new functions are introduced in the form of Industry 4.0 methods.
2.2 Video analysis as an Industry 4.0 method
It is important to provide a brief overview of video analysis, as it has a significant influence on the configuration of resources in the overall security control room system. Video analysis is a method for the autonomous recognition and tracking of objects in monitored scenes. The technological advances in this field are significant, and robust object detection is receiving significant attention. Mustafah and Azman define robust object detection as "the problem of locating an object of interest in an image in the presence of uncontrolled lighting, complex background, and variations of appearance and orientation such as scale and rotation" [4]. Given sufficient image quality, robust object detection has a relatively high success rate. Video scene analysis is the process of recognising and analysing humans and objects from live-streamed or recorded video scenes, in an attempt to recognise human action, classify activities, and interpret scenes [5]. Relatively unsophisticated scene analysis can easily be accomplished with modern technology through intelligent automation.
Robust object detection and scene analysis collaborate to perform tasks - such as eliminating sections in video clips where no change in a scene is detected, or emphasising sections where humans are detected with intrusion tools. Scenes can also be automatically analysed to determine intelligently and 'on the fly' whether alarms should be sounded or not. Both scene analysis and object detection are widely available and are relatively inexpensive, and open-source versions can be obtained online and adapted to fit many settings with minimal effort and expense.
2.3 Information-to-noise ratio
A ratio commonly used in communication systems that may apply directly to this analysis is the signal-to-noise ratio, which gives an indication of how much signal energy is contained in a symbol relative to the noise present in a noisy communications channel. When the signal energy is high relative to noise energy, a symbol is easily recognised and information can be retrieved. A decision is then made as to the type of symbol received, and a high signal-to-noise ratio gives a high level of confidence in the decision [6].
In recent research publications, this ratio has also been informally used and lightly remodelled, such as with the spam-to-content ratio in online discussion forms [6, 7]. It is thus used as a symbolic expression referring to the ratio of relevant or favourable data to irrelevant or unfavourable data.
Similarly, in the case of data sent across the channels between distributed sites and the control room, some data does not carry actual information and may be considered noise. Thus the information-to-noise ratio of a section of data is defined as the ratio of informative data to noise in a specific section of data.
3 MODEL CONCEPTS
3.1 The bin approach
Input devices are devices that are located on monitored sites that provide a control room with decision-making data. The total data obtained from input devices consists of informative event data, referred to as event indicators in this research, and noise, which is recorded data that contributes no value toward the identification of an event's cause. Event indicators are informative, in the sense that they provide information that helps a control room determine why an event was generated. Consequently, event indicators contribute to the certainty that the control room has about an event's underlying cause.
A bin is defined for the purpose of this research as a packet of data provided by equipment on a remote site that contains information about an event. Bins will thus vary in size for different equipment types, and will contain both event indicators and noise. Furthermore, the number of event indicators would typically be different in every bin, since the events recorded at the sites are random and unique. The result is that every bin will embody distinct densities of informative data, and each bin will thus contribute to a distinct amount of certainty.
In the control room setting, event indicators are favourable and noise is unfavourable. This is because only event indicators contribute to effective decision-making. It is advantageous, therefore, to obtain high indicator-to-noise ratios in bins, as more certainty about an event's cause is gained from more informative bins. This is in line with the discussion on information-to-noise, where the informative elements, in this case, are called 'event indicators'.
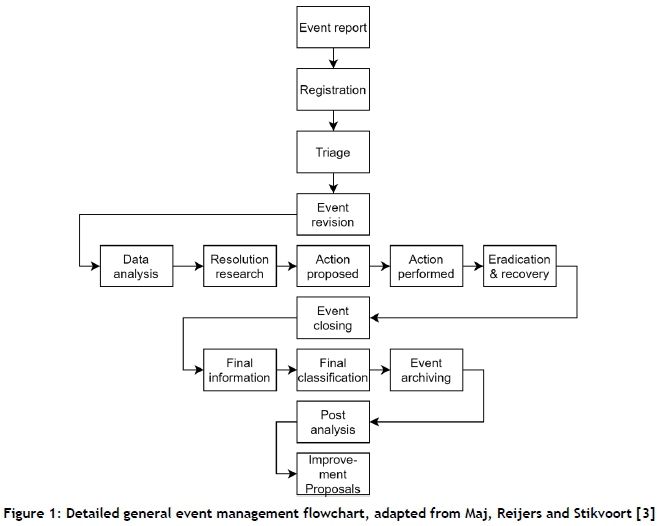
Figure 2 illustrates the bin concept for a scenario where data is pulled from a site three times in a row and transmitted over a communication channel from a remote site to the control room. The bins shown in Figure 2 are of varying sizes, to illustrate that data is typically obtained over different timeframes.
Bin 1 contains around 50 per cent event indicators, and of the three bins it is the most significant contributor to certainty. The second bin contains a lower indicator-to-noise ratio than the first. Nevertheless, it contributes marginally to the certainty that the control room has about the event's cause. The third bin exclusively contains noise, and contributes nothing to the certainty that operators have on the cause of the event.
In line with decision theory in a data channel, with fewer event indicators and more noise, the likelihood of making an incorrect decision is high, more event indicators are required, and more time is spent on obtaining such indicators. This is clearly undesirable, and one would want an Industry 4.0 technology to provide more event indicators and less noise, thus being more informative.
Thus the information-to-noise ratio of a bin influences the density of informative data in a bin. Operators will be able to identify the cause of an alarm quicker and with more certainty when an increase in the density of informative data is present in a bin. 'Informativity' is thus defined in this research as the information-to-noise ratio in a bin (over a defined period of time), where highly informative technologies will provide a relatively large amount of valuable information in a short period of time, with little or no noise. In other words, devices with high levels of informativity will consistently provide the control room with bins containing high densities of useful information.
3.2 Simulation modelling
For this research, a detailed model was built with simulation software to represent functionally a loosely integrated security control room. Many simulation software packages have the functional requirements to simulate the event management of a control room system; however, SIMIO® simulation software was the chosen package, since reputable researchers have previously used SIMIO® in systems analysis and design [8, 9]. The next section includes an analysis of the event management of a loosely integrated security control room.
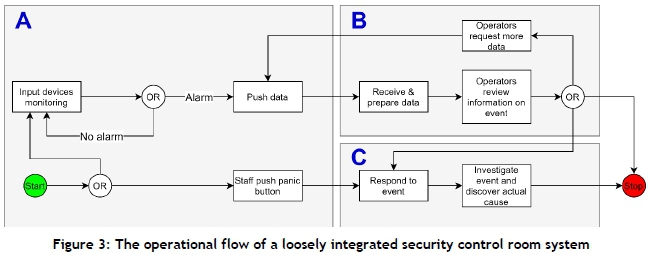
The operational flow of a loosely integrated security control room system can be divided into three sections, A, B, and C, as shown in Figure 3:
A. The sites
B. A control room
C. The field workers
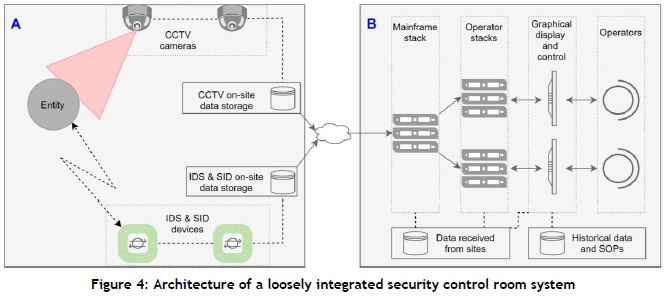
In a real-world setting, a site's personnel are on-site during business hours; they can be contacted to gain more information about the circumstances on site, and so become part of the information provisioning system. After business hours, however, personnel are unavailable, and control room operators must identify the cause of an event remotely by receiving and processing 'bins' of site data. Figure 4 showcases the architecture of a typical site (A) and a control room (B). Note that the number and scale of elements, such as input devices and operators, are for illustration purposes only. The following discussion defines the real-world model from which the abstracted model was derived; this is done to validate the functional definition of the abstracted model as applied in simulations.
The sites contain input devices that generate alarms and store the data on site. Alarms are signalled when entities are identified on site and data is pushed over the cloud to the control room for processing. Similarly, data such as CCTV footage can be pulled from sites to the control room. The control room is then notified about the alarm (event reported), after which a standard operating procedure (SOP) is executed, based on the applicable scenario and severity. The operator then attempts to identify what caused the alarm by processing the available information on the event, and pulling more data as needed from CCTV footage or any other available device that can inform the operators about the activities on site. This is an iterative process, and the operator gradually gains certainty about what has caused the alarm, which then guides the operator on how to manage the event. This is a common scenario in event management, where information (observation) is iteratively gathered, and its quality is improved in order to define the underlying cause (reality).
If the operator presumes that an alarm is caused by an actual incident, or if the operator is unsure about what caused the alarm, a task force is notified to respond. If the alarm is, in fact, a false alarm, mitigations are implemented to reduce the occurrence of these specific false alarms in the future by changing the site's physical configuration. After responding to an event, an investigation begins to analyse potential new modi operandi and other intelligence that will be used to mitigate future attacks (risks).
Risk is an important factor in the event management functionality of a control room, as the risk of an event guides an operator on how to manage and prioritise it. It is important to note that the risk factor that guides an operator in the event management process is not the actual risk of an event, but rather the perceived risk of an event. Events are therefore managed based on an operator's perception and interpretation - which is formed by the available useful information on the event at the time, and which changes as more information is gained.
The number of operators in security control rooms varies depending on the number of sites that the control room serves. In the simulation model for this analysis, three operators are simulated, together with 2 000 sites of varying risk levels, or classes. Site risks are classified as low, medium, or high risk, depending on factors such as the value of the assets being protected, their geographic location, and the measure of security mitigations implemented at each site. For practicality, these sites are not modelled individually, and three event-generating sources are implemented in the model. The number of events generated in the simulations at these sites is scaled to match those expected from each of the site risk classes (low, medium, or high).
The sources of events at the sites of the simulation model randomly create events at reasonable frequencies while considering the historical incident-to-false-alarm ratio. Events are then either detected or missed by the devices on-site, based on the predetermined incident and false alarm acceptance rates. As events flow through the system, they are assigned a perceived risk value, which is based on the perceived probability that an event is an incident and on the corresponding impact an incident may have on the site where it originated.
The perceived probability of an event being an incident is directly proportional to the certainty that an operator has about what caused an event. Also, the impact an incident may have on a site is derived from the risk class of a site. The perceived risk value of the event therefore changes as operators receive event indicators in bins related to the event. If the perceived risk score of an event surpasses the tolerable or intolerable thresholds, it is managed appropriately. Events may, therefore, be responded to incorrectly, as the risk may be wrongly classified owing to incorrect presumption.
Owing to the randomness of the events that occur on sites, it is imperative that the short-term operations of a control room differ accordingly. Therefore, appropriate probability distribution ranges in which actual values are likely to transpire were chosen for variables - such as bin sizes, number of event indicators, and processing times. Random values were then simulated in these ranges and, given a sufficiently long simulation time, a good estimation of the actual operational performance of the control room emerged, as stated by the Monte Carlo theorem.
3.3 Model validation
To validate the simulation model and the results, simulation runs were executed and compared with real-world data. The functional flow and architecture of the simulated models were also compared with the real-world model for verification purposes. The simulation data was obtained from recorded real-world data and verified by industry experts.
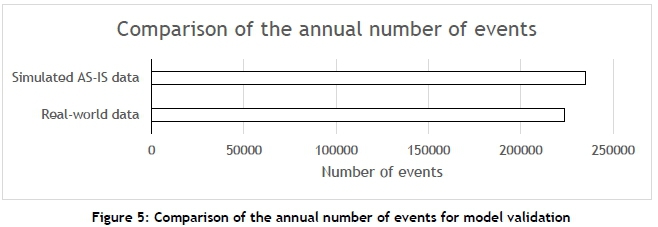
The number of events in the year 2019 for a real-world control room is compared in Figure 5 with the number of events ultimately generated by the simulation model. The actual number of events in the physical world was scaled to be representative of a control room with three operators. The number of events generated by the simulation model was slightly over 95 per cent accurate relative to the number of events experienced in 2019 by the real-world control room. Note that the number of events experienced in the physical world varies annually, and the above comparison was found to be representative of real-world numbers.
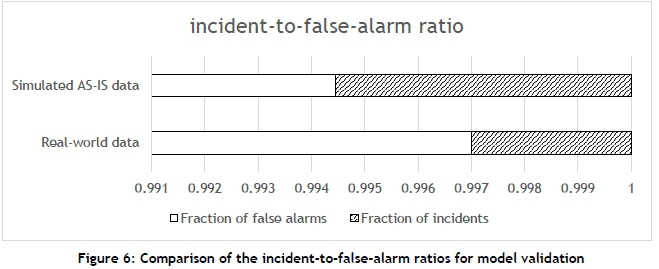
The ratio of incidents relative to false alarms is compared in Figure 6. Note that the horizontal range was limited (i.e., magnified) to show the correspondence between the real-world and the simulated results. From the graph, it is evident that the simulation model compares favourably with real-world data for the incident-to-false-alarm ratio.
It is noted, as with most modelling challenges, that the simulation model will always be an estimation of the real world, as minor variations are always present. However, the goal of this research is to compare a contemporary model with a prospective model in a relativistic way, which limits the impact of these small variances. With this relativistic approach, simulated output variables of interest are compared between simulated models, and results will show an improvement, or not. The same assumptions were used in all simulation models.
The validation of the simulation model was important, and it was validated in the following way (as a combination of measures):
1. The simulation model was derived from a real-world control room system, and was designed to be functionally and architecturally similar - this was verified against the real-world functions, and this served as a functional verification.
2. The sequence of task executions of the simulation model also corresponded with the task execution sequence of a control room in the real-world - this verified the functional logic in a process flow.
3. Actual historical data from a real-world, loosely integrated security control room system was included in the simulation model - this was verified by an industry expert and confirmed to be accurate.
4. In terms of performance, the number of events flowing through the simulation model was verified to be sufficiently similar to the real-world data (more than 95% accurate relative to the measured 2019 total), as shown in Figure 5 above.
5. Finally, the ratio of incidents to false alarms was 99.75 per cent accurate, compared with the 2019 ratio of incidents to false alarms in the physical control room, shown in Figure 6.
4 FINDINGS
The influence of technologies such as robust object detection and automated scene analysis can be simulated by employing the bin concept in the SIMIO® environment. These technologies, in effect, eliminate noise levels on the site where an event occurs, which essentially improves the information-to-noise ratio of the bin and reduces its overall size. Events can also be filtered with object detection, and typical events that cause false alarms can be identified and automatically ignored on site, potentially averting the arrival of many false alarms at the control room. This changes the functionality of the overall control room system, as discussed below.
To illustrate the impact of Industry 4.0 technologies on a control room's operations, a relativistic comparison of a basic CCTV control room system ('AS-IS') and an intelligent CCTV control room system ('TO-BE') was performed. The 'TO-BE' system was thus the 'AS-IS' system, with the addition of robust object detection and automated scene analysis on the input devices on all of the sites served by the control room.
The impact of these technologies was simulated by altering the conventional, validated 'AS-IS' simulation model by decreasing the amount of noise in the bins and lowering the average number of non-malicious events triggering false alarms. The rest of the model, including the rate at which events occur, stayed unchanged to ensure that the only variables to change were the ones directly influenced by the Industry 4.0 technologies.
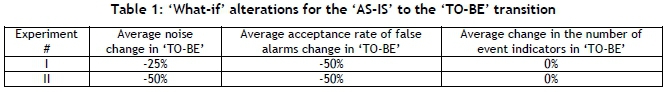
It is difficult to predict exactly how much the relevant variables will change after these technologies have been implemented, as the currently available technology is of varying quality. The impact of these technologies can, however, be illustrated by performing a basic sensitivity analysis, or a 'what-if' analysis. Table 1 portrays how the variables of interest would change in the sensitivity analysis.
The number of event indicators will not reduce in the bins, since only noise is expected to reduce with the addition of Industry 4.0 technology. Also, the technology does not change the physical event occurring on site; rather, it manipulates the recorded data before sending it over the communication medium to the control room.
A cost analysis when using distributed processing as opposed to processing all signals in a control room was not done in this case, as hardware with processing ability had already been installed on the sites, and open-source software can be obtained and implemented.
4.1 Effectiveness
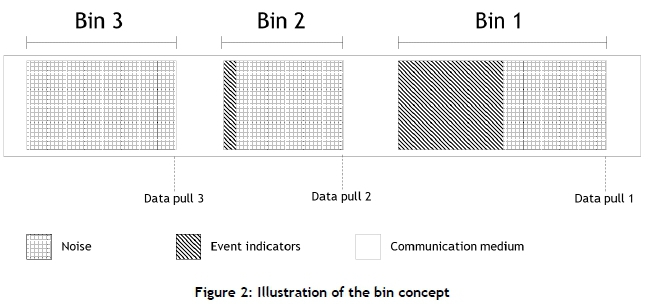
In the simulation model, the number of time incidents escalated during the experiment was determined by recording the time each actual incident spent in the system. The time that actual false alarms spend in the system does not contribute to this value, since there they are not malicious events. If an incident is completely missed or misinterpreted as a false alarm, the maximum escalation time, which is the estimated amount of time needed for an incident to escalate to its peak, is added. The maximum possible incident escalation time in the experiment was determined by multiplying the number of incidents generated by the model by the maximum escalation time.
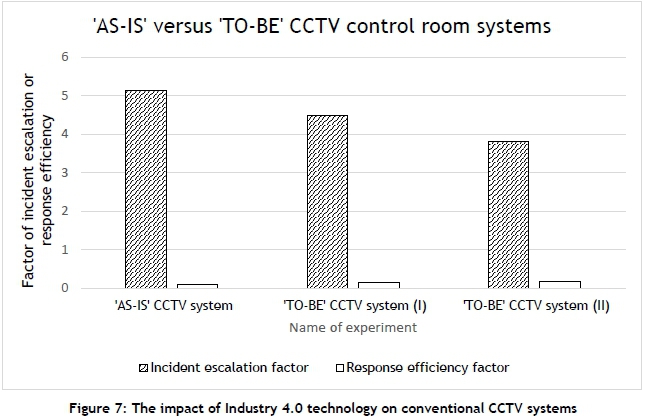
The factors showcased in Figure 7 are determined by the following equations:
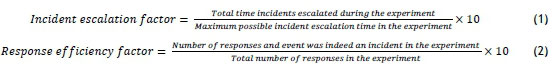
A factor approach is used to compensate for the randomness in each experimental run. For example, the amount of time an incident escalates cannot be compared directly between experiments, as a different number of events may be present in the experimental runs.
The experiments must be run over a sufficiently long period of time, and through multiple iterations, to ensure that the randomly generated values provide reasonable and consistent estimations. Therefore, the experiments were run over a period of five years, and each of these experiments was repeated 30 times to obtain good averages. With the changes in Table 1 implemented as individual scenarios, the results obtained are shown in Figure 7.
Since a bin consists of noise and event indicators, the information-to-noise ratios of bins increase when noise is reduced (effectively, the size of the bin may also reduce if noise is eliminated). In effect, smaller bins are transferred over the communication medium between the site and the control room, giving the operators quicker access to the available information on what caused the event (increased confidence). Owing to the reduced size of the bin and the semi-distributed processing nature of this 'TO-BE' model, the time required for an operator to review the bin also decreases. Furthermore, fewer false alarms are present, which results in a less congested control room.
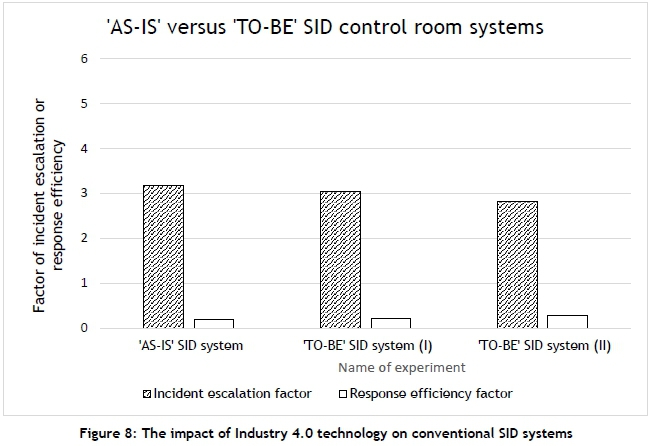
A similar phenomenon can be seen in Figure 8, when the Industry 4.0 technologies are applied to snapshot intrusion detection (SID) devices. These devices are typically intrusion detection devices coupled with image-capturing functionality that provide additional decision-support information in the form of visuals (as opposed to simple detection signals). The bin sizes of conventional SID systems are much smaller than those of CCTV systems (owing to the nature of static images vs CCTV footage), and it should thus be evident that conventional SID systems are more effective in the loosely integrated security setting than are conventional CCTV systems.
Trends in improvement are evident when Industry 4.0 methods are used in both input device systems. Conventional SID systems, however, outperform conventional CCTV systems, since SID systems typically produce bins with better indicator-to-noise ratios (and therefore a higher level of informativity) than CCTV systems. This is because SID systems take snapshots at the moment when an intrusion is detected (a few, highly indicative image frames), as opposed to transmitting large amounts of uninformative data, as is the case with CCTV systems (hundreds of uninformative image frames). However, Industry 4.0 methods in SID systems will still filter out unwanted snapshots, and provide slightly smaller bin sizes than conventional SID systems - hence the relative improvement.
Although exact values for the 'AS-IS' to the 'TO-BE' transition had not been identified, the sensitivity or 'what-if' analysis proved that a reduction in noise at the sites monitored by a loosely integrated control room is likely to result in a lower incident escalation factor and better response efficiency. Also, input devices producing bins with high information-to-noise ratios offer high levels of informativity.
4.2 Wastage
Another important goal of the control room is to lower the overall operational expenditure (or wastage, in this case) of reactive forces. In this simulation model, operational expenditure is difficult to measure, since many arbitrary costs such as salaries and fuel prices are present. Therefore, operational expenditure is compared on a relativistic basis by considering hours worked and kilometres driven. More specifically, a factor-comparison is made based on hours wasted and kilometres wasted. The two wastage factors are determined by the following equations:
The value for 'kilometres wasted responding to false alarms in the experiment' is determined by randomly generating a kilometre value within the expected range every time the task force is incorrectly prompted to respond - in the cases where the events are false alarms. The 'total kilometres driven in the experiment' value is determined by summing all of the kilometres driven when responding. This includes the response actions to both incidents and false alarms.
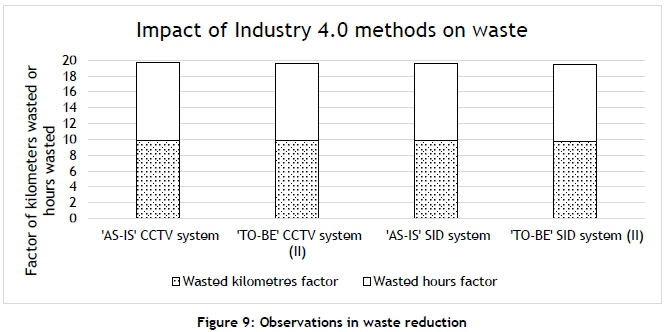
The value for 'wasted hours responding to false alarms in the experiment' is determined by calculating the time it takes to drive the randomly generated distance every time the event is incorrectly responded to, as well as a randomly generated site-investigation time. Figure 9 contains an illustration of the waste present in both the 'AS-IS' and the 'TO-BE' systems.
From Figure 9, it is evident that, in the leftmost ('AS-IS') column, significant waste is evident in operations. This is mostly due to a large number of false alarms relative to incidents that occur on sites, where false alarms are often incorrectly interpreted as incidents. Also, a major reason for wastage is alarm signals for which the cause is uncertain, but for which a reaction team is sent to a site anyway.
Overall, a less pronounced improvement is observed for wastage when Industry 4.0 methods are implemented in both the CCTV and the SID control room systems. A small decrease in both kilometres and hours wasted was noticed. Thus, although not the main consideration, an increase in the speed of event handling and a reduction in false alarms resulted in a minor improvement in wastage.
5 CONCLUSION
In this article we analysed the effects of Industry 4.0 methods on a control room system, with the purpose of (a) defining a context for in-depth research, and (b) demonstrating the advantages of using video analytics (an Industry 4.0 method) for operational effectiveness. Video analytics were introduced to a simulated operating model - in SIMIO® - that represents the event management functionality of a typical loosely integrated security control room. It was found that, when methods such as robust object detection and automated scene analysis are introduced on distributed sites, the operational effectiveness of the control room improves. The time for incidents to escalate is thus reduced, together with a minor reduction in operational costs, as found from the simulations. The analysis done in this research adds value by providing relative improvement measures.
In addition to introducing a control room system environment, the concepts of 'information-to-noise' and ' informativity' were introduced to define the relative information content of an information packet (or bin) and the amount of value-adding information produced by an input device in a set time period respectively. These concepts were applied in the simulated operating models, and will be used in future research to classify different technologies and methods.
We have thus confirmed that existing loosely integrated control room systems can be improved with Industry 4.0 methods to reduce the amount of noise (non-informative data) arriving at the control room, which would inevitably improve both the rate of event processing by an operator and the information transfer rate over the communication channel. These modern methods may also lower operator workload, as fewer false alarms are sent to the control room, which is ascribed to automated decision-making at remote monitoring sites.
The focus of this study was thus on improving the operational effectiveness of the informativity of technology, with an increase in informativity that resulted in an overall operational improvement in the overall control room system. This study is by no means comprehensive, and is the first step towards modelling a complete environment, which will include both cost and effectiveness elements. Future research will expand the scope of this research, and will include the following:
• Cost analysis - This research considered open-source methods that effectively illustrated that a reduction in noise at distributed sites would improve the operational effectiveness of the control room. An area where future research might contribute is an in-depth cost analysis of commercial software and related technologies when applied in this context.
• Control room in-depth analysis - The impact of the collective improvements of both the control room and the Industry 4.0 methods on site will be analysed in an integrated way by investigating the effects of specific changes on the control room functions and resources.
• Form, fit, and function - Reflecting on this research, it is evident that the configuration change of a control room system, specifically relating to form, fit, and function, results in functional changes. (AI-enhanced tasks, such as decision-making, may be relocated from humans to machines.) These changes will result in changes to resources (humans, machines, and software) and their relative interfaces. These could be analysed.
In summary, it is evident that the introduction of Industry 4.0 methods (and similarly, technology relating to the 4th industrial revolution) improve the performance of control room systems. The framework and results from this research add value to the knowledge base, and future research will use detailed operational analyses to address burning questions relating to both the 4th and the 5th industrial revolutions.
ORCID* identifiers
E.L. Hugo: https://orcid.org/0000-0001-8685-1890
J.E.W. Holm: https://orcid.org/0000-0003-2862-909X
REFERENCES
[1] Su, R. & Yurcik, W. 2005. A survey and comparison of human monitoring of complex networks. University of Illinois at Urbana-Champaign, National Center for Computing Applications (NCSA). Chicago, USA. [ Links ]
[2] Alam, K.P. & Dhavale, N. 2012. Data mining tools for integrated complaint management system. Institute for Development and Research in Banking Technology. Hyderabad, India. [ Links ]
[3] Maj, M., Reijers, R. & Stikvoort, D. 2010. Good practice guide for incident management. European Network and Information Security Agency (ENISA). Heraklion, Greece. [ Links ]
[4] Mustafah, Y.M. & Azman, A.W. 2012. Out-of-plane rotated object detection using patch feature based classifier. Procedia Engineering, 41, pp. 170-174. [ Links ]
[5] Abbas, Q., Ibrahim, M.E. & Jaffar, M.A. 2018. Video scene analysis: An overview and challenges on deep learning algorithms. Multimedia Tools and Applications, 77(16), pp. 20415-20453. [ Links ]
[6] Alam, S.J., Alam, M.R., Hu, G. & Mehrab, M.Z. 2011. Bit error rate optimization in fiber optic communications. International Journal of Machine Learning and Computing, 1 (5), pp. 435. [ Links ]
[7] Wang, B., Zubiaga, A., Liakata, M. & Procter, R. 2015. Making the most of tweet-inherent features for social spam detection on Twitter. University of Warwick. Coventry, UK. [ Links ]
[8] Van der Merwe, G.P.R. 2014. A risk-based approach to the acquisition of electronic safety equipment for mines. North-West University. Potchefstroom, South Africa. [ Links ]
[9] Vik, P., Dias, L., Pereira, G., Oliveira, J. & Abreu, R. 2010. Using Simio for the specification of an integrated automated weighing solution in a cement plant. In Proceedings of the 2010 Winter Simulation Conference, Baltimore, USA. IEEE. [ Links ]
* Corresponding author: eduan.hugo@gmail.com

