


Services on Demand
Article
 English (pdf)
 Article in xml format
 Article references
Indicators

Related links
-
 Cited by Google
 -
 Similars in Google
Share

 Permalink
South African Journal of Industrial Engineering
On-line version ISSN 2224-7890
Print version ISSN 1012-277X
S. Afr. J. Ind. Eng. vol.31 n.2 Pretoria Aug. 2020
http://dx.doi.org/10.7166/31-2-2221
CASE STUDIES
Prevision and optimisation of repairable spare parts: a case study in the petroleum industry
D. Gonçalves CalvacanteI; L. FerreiraII, *; D. BorensteinII
IMaintenance Division, Petrobras, São Paulo, Brazil
IIOperations Research Group, Business School, Federal University of Rio Grande do Sul, Brazil
ABSTRACT
This study was motivated by the high costs incurred by an energy company for repairable spare parts for faulty mission-critical items, particularly with those that operate until failure. The objective of this paper is to develop and apply a method for repairable spare part inventory management of run-to-failure equipment. To achieve a robust method that incorporates the data collected from previous failures, such as environmental factors and operating conditions, we propose an optimisation approach based on an accelerated failure time model. Accelerated failure time is used as a reliability regression model with covariates to describe different operational conditions. An algorithm is also developed to consider the repairable nature of the equipment, predicting the number of spare parts based on the expected number of failures in the period and the equipment repair cycle. The proposed method is applied using data from three different power units of electrical submersible pumps, a mission-critical item in oil production. The results show an average reduction of 60.6 per cent in the required number of spare parts, considering an average fill rate of 95.33 per cent. This reduction implies an estimated annual savings of around US$664,720 in inventory costs, considering the analysed units.
OPSOMMING
Die hoë kostes wat energiemaatskappye op die hals haal vir spaar onderdele vir kritiese items dien as motivering vir hierdie studie. Die doel is om 'n metode wat die inventarisbestuur van herstelbare spaar onderdele te ontwikkel en toe te pas vir bedryf-tot-faling toerusting. Om 'n robuuste metode wat vorige falingsdata inkorporeer te ontwikkel word 'n optimisering benadering wat op 'n versnelde falingstyd model gebaseer is gebruik. Versnelde falingstyd word gebruik as 'n betroubaarheid regressie model met kovariate om die verskillende operasionele toestande te beskryf. 'n Algoritme is ook ontwikkel om die herstelbaarheid van die toerusting in ag te neem en dit voorspel die aantal spaar onderdele op grond van die verwagte aantal falings in die periode en die toerusting herstelsiklus. Die voorgetelde metode is toegepas op data van drie verskillende aandrywingseenhede van elektriese dompelpompe. Die resultate toon dat 'n gemiddelde vermindering van 60.6 persent in die aantal spaar onderdele wanneer 'n gemiddelde vulsyfer van 95.33 persent oorweeg is. Die vermindering bewerkstellig 'n jaarlikse besparing van ongeveer US$664,720 in inventaris onkostes vir die oorweegde pompeenhede.
1 INTRODUCTION
Equipment maintenance accounts for a considerable portion of the operating costs in a number of industrial sectors, and may represent 15-70 per cent of the total production costs [1]. According to studies on airlines in the USA, the value of spare parts inventory is more than US$50 billion [2]. Investment in spare parts can vary from five to 15 per cent of the total operating costs [3], representing an annual opportunity cost of between 20 and 40 per cent of inventory value [4].
This work was motivated by the high investment in inventory of some mission-critical equipment by Petróleo Brasileiro S/A (Petrobras), a semi-public Brazilian corporation in the energy industry. The company, one of the largest in Latin America, operates in the areas of exploration, production, refining, commercialisation, and transport of oil, natural gas, and their derivatives. The immobilised capital in spare parts at Petrobras, considering all its operational units and subsidiaries, was estimated at around US$1.27 billion, based on the company's consolidated financial statement of 2015 (available for public access at http://www.petrobras.com.br/en/). Excess stock is directly linked to the risk of material lack - that is, stock that is used to absorb uncertainties related to maintenance demands. Given the complexity of spare parts dimensioning, the balance between the cost of material failure and immobilised capital is compromised, either by the excess or the lack of an item.
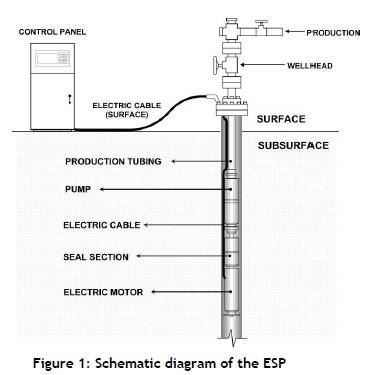
The study was applied to predict the spare parts items for the electrical submersible pumps (ESP) motorpump assembly. The ESP system is used as an artificial lift method in oil production, where the centrifugal pump functions as an operating element of the fluid mixture produced by the reservoir. The pump provides an energy gain to the reservoir to lift the mixture to the surface for treatment and storage, significantly increasing the oil production when compared with natural methods. Currently, 620 units are in operation in several Petrobras offshore and onshore oil-drilling fields in Brazil.
The ESP assembly is made up of surface and subsurface components (see Figure 1). Surface items undergo routine predictive and preventive maintenance, but technical and economic restrictions mean that the subsurface components operate until failure (run-to-failure) without the possibility of preventive maintenance. Upon a failure event that can reduce ESP performance, the submersed assembly is removed and sent to the repair shop. A spare part (a perfect operational item) is then installed, since the equipment is mission-critical equipment for oil production. The faulty item is then completely refurbished, returning it to the 'as good as new' state. After being repaired, the item is sent to one of the warehouses of the company as a spare part for future use. Removal and installation of the ESP assembly involves high costs, since highly specialised technicians are required to perform the service.
As an illustration, a unit with mechanical power of 48 HP has an estimated value of USD60,000.00. By contrast, the lack of this item may involve a significant loss of profit, since when one of the subsurface components (cable, pump, or electric motor) fails, the oil well ceases to produce. The loss of profit is proportional to the length of well downtime. In a typical well with a daily production of 50m3, this loss can be estimated at US$15,573.57 per day. This value was calculated at a barrel price of USD49.52 at the time of data collection. The loss of production can be aggravated if the required spare part is not available. Thus this is a mission-critical system for oil wells, requiring a special approach for the prevision and optimisation of spare parts, as defined in Section 3. There is also an estimated lead time of around eight months to receive spare parts for this equipment if it is not available, considering the time for the bidding process (including submission of prices, assessment of suppliers, and publication of results), purchase, and delivery.
The main objective of this paper is to describe the development and application of a spare part dimensioning method, based on industrial reliability using covariates. The method consists of three stages: (i) the covariates are identified, and data is collected; (ii) the covariates are validated and the failure data analysed, based on statistical methods; and (ii) the number of spare parts needed is computed, based on the expected number of failures and the equipment repair cycle. The application assesses the motor-pump assembly of the ESP, considering the following components: cable, pump, and electric motor. Using probability analysis of failure data, the regression model with covariates and the renewal process, stock and maintenance management are integrated.
The remainder of the paper is organised as follows. Section 2 presents a succinct literature review on spare inventory management. Section 3 describes the method developed to predict and optimise repairable spare parts. Section 4 outlines the results obtained from applying the method to a real case in the oil industry. Section 5 presents the final considerations and conclusions.
2 LITERATURE OVERVIEW
Considering the high costs involved and the complexity of the problem, spare parts management is widely studied in the literature. For example, Alrabghi and Tiwari [5] presented a systematic literature review (SLR) on simulation-based optimisation in maintenance, while [6] conducted a broader SLR of operational research (OR) in spare parts management from 222 papers. The latter authors also designed a new framework for OR in spare parts management to structure the review. Besides covering the objectives of spare parts management and the phases of the product life cycle, the third level of the proposed framework contemplates four commonly used methods in spare parts management: multi-criteria, forecasting, optimisation, and simulation.
This problem was addressed by emphasising the time between failures [7] using the queuing theory or Markov chains [8, 9]. However, as pointed out by Ghodrati and Kumar [10], the queuing theory-based models have theoretical drawbacks, such as constant failure and repair rates, which prevent them from representing real-world systems.
Based on these shortcomings, some researchers introduced reliability theory to determine spare parts failure rates. Ascher and Feingold [11] observed that reliability engineers treated times between failures as independent and identically distributed and fit probability models, such as Weibull. They advocated the use of nonstationary stochastic point process models, describing a methodology for analysing the data of repairable systems, used in Gustafson et al. [12], to compare automatic and manual load haul dump machines from a reliability perspective. Several techniques based on statistical methods [13], artificial intelligence [14], Monte Carlo simulation [15], and non-linear programming [16] have been used to forecast spare part demands. Since reliability characteristics are a function of operation time and environmental operating factors [10, 17], the estimates made by the above reliability-based models lack the confidence of maintenance engineers. Environmental operating conditions are important for asset reliability, reflecting the demand for spare parts. These conditions may include aspects inherent to the environment (temperature, pressure, humidity, salinity), installation conditions, and equipment use, among others. These factors, known as covariates or explanatory variables, have a direct effect on the equipment failure rate, creating conditions where it is not constant.
Based on the results obtained in case studies [10, 17] that observed a 20 per cent reduction in the number of spare parts when operating conditions were assessed, a number of more recent investigations also used industrial reliability and covariates to decrease replacements costs [18] and to predict and optimise spare parts [17, 19, 20]. However, the papers using covariates address the problem of non-repairable equipment/components; and the analysed items can be maintained using preventive or condition-based maintenance. As a consequence, it is unclear whether they can be directly applied to our problem, since the ESPs could demand different techniques and methods for analysing failure data.
It can be concluded that the work on spare parts optimisation and prediction, incorporating information about equipment operation, is quite limited. The contribution of this paper is as follows: (i) the multi-component nature of the equipment analysed, which was broken down into several components; (ii) the complete repairable nature of the analysed item; and (iii) the run-to-failure characteristic of the case study. To the best of our knowledge, this is the first study to apply accelerated failure time (AFT) as a reliability regression model with covariates (RRMC), instead of using the proportional hazards model (PHM) [20], to optimise the number of repairable spare parts in a real-world application.
3 PROPOSED METHOD
This section details the developed method, which is divided into three stages (Figure 2). Structuring of the method presumes that the equipment is repairable and can be used, after being repaired, as a spare part to replace faulty installed equipment in the future. The ensuing sections describe each of the stages of the proposed method.
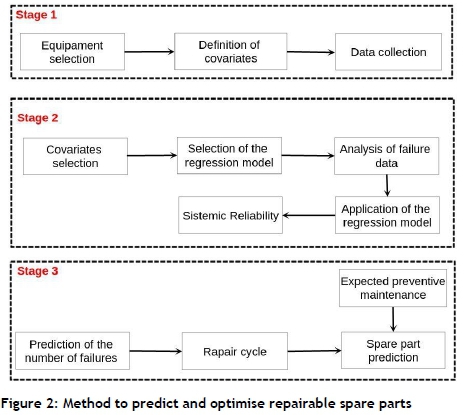
3.1 Stage 1
The first stage of the method consists of assessing and selecting the mission-critical system to be studied, using the following characteristics as assessment parameters: stochastic demand, high cost of immobilised capital, prolonged delivery time, low inventory turnover, high risk of obsolescence, being essential for the operating environment, high loss of profit, and impact on operational safety or the environment. Godoy, Pascual and Knights [17] define items that exhibit these characteristics as condition-managed critical spares (CMCS). The method developed by Tsakatikas and Diplaris [21], using a top-down failure modes effects and criticality analysis to determine the criticality of spare parts, can be useful in this step.
The next phase of the first stage is the definition of covariates and data collection. The primary requirement of these activities is an analysis of the mechanisms of equipment failure. According to some researchers [20], a failure mechanism is a guide to identifying and formulating covariates. The experience of the operators and the skills of the maintenance team are crucial in this process [10].
Finally, data collection and analysis procedures must be established, based on the data available about failures, equipment, and operating conditions.
3.2 Stage 2
The second stage consists, initially, of selecting covariates using the data sources described in Stage 3.1. Next, the covariates identified must be validated in order to ensure their representativeness in the study. Covariates exert an important effect on a study when their significance (p-value) is less than or equal to 10 per cent [20], based on the maximum likelihood estimate (MLE) and the stepwise method. The stepwise method can be applied in two steps. First, the logarithm values of the maximum likelihood function are compared, considering the null model with each variable, using the following equation:

where Lcand Lsrefer to the likelihood of the model with and without the covariate respectively. Every covariate with a p-value less than or equal to 10 per cent indicates representativeness. In the second step, all covariates are initially considered in the model. Next, each covariate is removed and compared with the previous stage. The covariate will be representative of the study if it has a p-value of less than 10 per cent in the two steps. Under the hypothesis that the covariate is representative, the MLE exhibits an approximate chi-squared distribution with degrees of freedom equivalent to the number of covariates tested.
After selection and validation of the covariates, it is necessary to define an RRMC to analyse the distribution of failure data with covariate effects. In this phase, two regression models are usually applied [20]: a proportional hazards model and an accelerated failure time model. According to Lawless [22], the choice of a regression model is based on the graph that represents the logarithm of accumulated failure rate as a function of time. On the one hand, when a graph with parallel lines displaced along the X-axis is obtained, the PHM is more suitable. On the other hand, when the parallel lines move along the X-axis, the AFT model is recommended.
The next phase of Stage 2 involves the statistical analysis of the failure data and the application of the selected RRMC. In this phase, different probability distributions (Weibull, exponential, and lognormal) must be tested for each component of the equipment to ensure its representativeness of the failure data. The Kolmogorov-Smirnov (KS) adherence test is used to select the statistical distribution. With both the RRMC and a standard probability distribution to represent the failure data defined, the effects of the covariates on the reliability of each component can be determined and the systemic reliability of the equipment measured.
In our case study, three components are linked in series; and even though all three contribute to the system's failure, the basic cause of dysfunction is associated with the first item that leads to failure. In this respect, the effects of covariates on the system were analysed considering four scenarios. For each scenario, a reliability block diagram (RBD) was compiled to obtain the reliability parameters, as presented in Section 4.1.
3.3 Stage 3
Stage 3 represents the prediction of the number of spare parts needed and the final validation of the method. Considering the repairable nature of the equipment, predicting the number of spare parts is based on the expected number of failures in the period and the equipment repair cycle. An algorithm was developed to consider both aspects simultaneously.
The renewal process can be characterised as the number of failures (in our case, the number of demands) that occur until time t,N(t), where the time between failures (T) is independent and identically distributed events, following the literature on renewal processes [20]. The classic renewal process, where the equipment is restored to the 'good as new' condition, is memoryless when one holding period ends and the next begins. Therefore the conditional probability distribution of the future of the process is the same every time a failure occurs, being independent of the past. The time between failures can then be computed on the historical failure data and covariates. Based on these assumptions, predicting the number of failures can be calculated following Gnedenko, Belyayev and Solovyev [23], and the results validated by the recursive algorithm in Xie [25]. The formulation defined in Gnedenko et al. [23] is described below:

where T is the average time between failures, and a(T) is the standard deviation of the average time between failures.
For non-repairable equipment, Equation (1) obtains a value that estimates the number of spare parts required. However, for repairable equipment the maintenance cycle must also be considered. This occurs because, after maintenance, the item is returned to stock in 'as good as new' condition. In this case, during a failure event, it is important to determine whether there is a previously repaired item in stock. The analysis of the maintenance cycle thus involves not only the failure distribution, but also the renewal process and the average time to repair the equipment units.
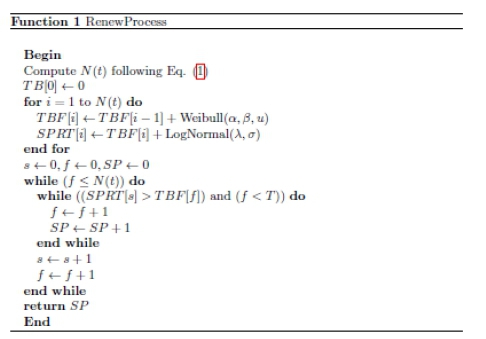
Function 1 was developed to simulate the number of failures that can be resolved by spare parts submitted to maintenance. These random events, based on Weibull and LogNormal distribution parameters, were generated to fill the time between failure vector (TBF) and accumulated time after repair (SPRT) respectively. These vectors are then compared to count the number of spare parts required in stock (variable SP). Function 1 can reduce the number of spare parts to be kept in stock, considering the items being returned from the maintenance department and ready to be used as spare parts. Under some circumstances, significant savings can be obtained, as demonstrated in our case study.
4 CASE STUDY
This section describes the application of the method to mission-critical equipment in the operation of offshore oil production platforms. The next sections describe the major results obtained in each of the method stages.
4.1 Stage 1
We started this stage collecting data about the equipment and its past failures. The data came from three different power units of ESPs, installed in several offshore and onshore oil-drill fields in the Rio Grande do Norte and Ceará Oil Production Unit of Petrobras, located in the northeast of Brazil. This unit produces around 3.36 per cent of the total oil production of Petrobras. Based on recent data from the company, this unit also accounts for less than six per cent of all ESPs in current operation. This specific unit was chosen for convenience, since one of the authors was directly involved with the maintenance of the analysed units.
The data collection was based on the documentary research of stock and equipment data on the item under study, obtained from the maintenance planning module of the integrated management system of the company (SAP/R3). Covariate data were collected from the platform information system (SINP) and the production information system (SIP), based on failure reports of the ESP units. Additional information was obtained from manufacturers' manuals, specialists' opinions in the field, and specialised databases, such as project OREDA (offshore and onshore reliability data).
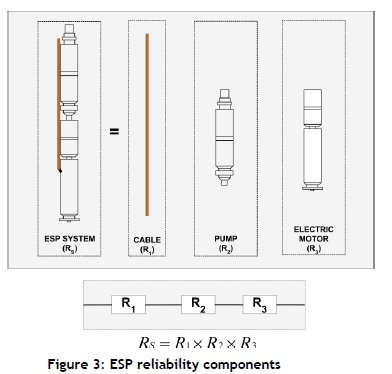
In total, 54 failure reports between January 2006 and May 2015 were deeply analysed. The data were also cross-referenced between different computerised systems in the company to ensure their reliability and to eliminate redundancies. Failures in sub-surface components can be electrical or mechanical. The ESP system was modelled as a series of three blocks: electric cable, pump, and motor (see Fig. 3). The reliability analysis was then applied to the blocks to make the model more representative and robust.
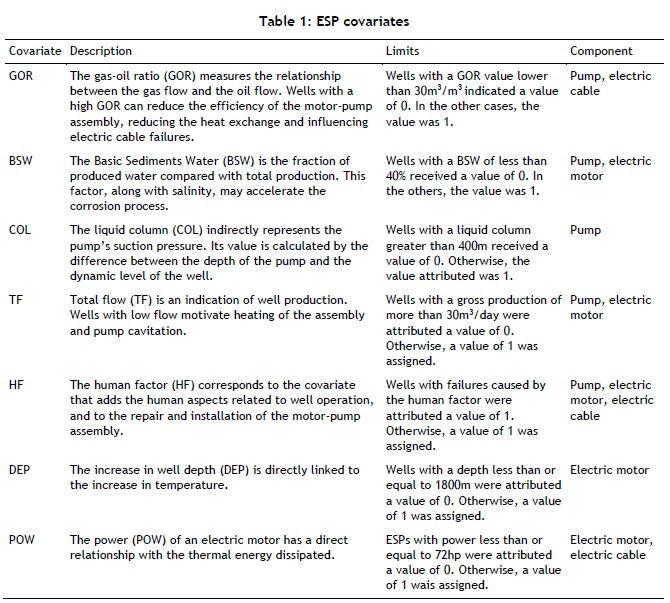
This stage also consisted of analysing the failure modes of the equipment to define the covariates of the model. The reliability of the motor-pump assembly can be influenced by external operating factors, represented in the problem resolution, such as covariates or explanatory variables. These variables tend to reduce equipment life, and their determination is essential for accurate probability analysis. Thus, for each ESP component in Fig. 3, a set of covariates was defined, based on the failure mechanisms of the components (see Table 1). Following [17], covariates were discretised as categorical 0-1 variables. The definition of the limits of covariate dichotomisation was based on information contained in ESP manuals, consultations with specialists, and failure reports. The 'Limits' column of Table 1 presents the way each covariate was dichotomised.
The covariates listed in Table 1 are quite stable in terms of percentage changes over time from a median value. While these random variables can present different values, they have approximately the same distribution. They constitute a covariance stationary stochastic process, in which the steady state distribution does not depend on the initial operational condition of the unit. Based on this fact, we decided to keep the analysis as simple as possible, not using methods considering time-dependent covariates. However, this is not a limitation of the method, since all employed techniques can handle this kind of covariate. As previously mentioned, the data set was composed of 54 failure events. Table 2 shows the time between the failures and the dichotomised covariates for the pump.
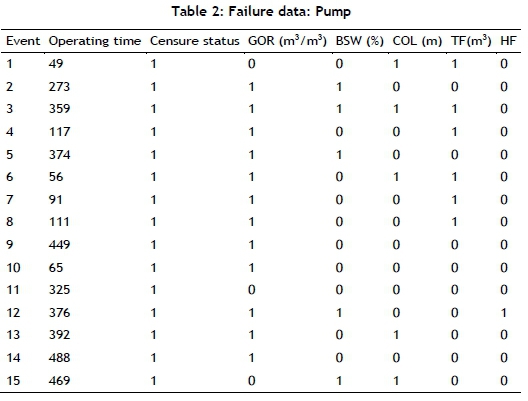
Table 2 shows that data collection resulted in 15 complete records for the pump, arranged according to the order of event occurrence. The data were collected within an interval of 457 days - the difference between event 1 and 14. Failure data for the electric motor were collected next. The electric motor supplies the driving force needed for rotational movement of the pump by converting electrical energy into mechanical energy.
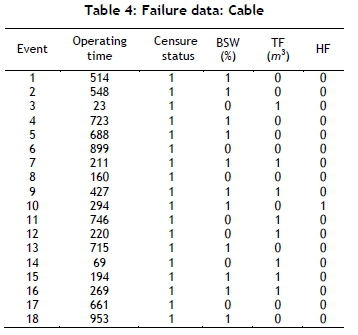
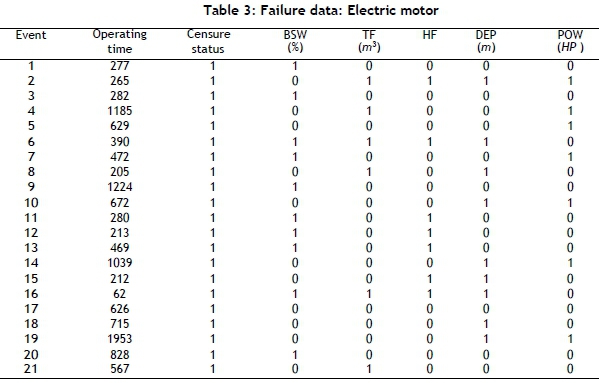
Data collection for this component resulted in 21 complete records of time between failures, classified in the order of occurrence (Table 3). The data was collected over a period of 1891 days. To finalise data collection, failures in the electric cable were counted and analysed. The electric cable conducts electrical energy, vital to the functioning of the motor. Cable length varies according to the depth of the ESP assembly. Data collection for this item resulted in 18 complete records of time between failures, where the data collected showed a difference of 930 days (Table 4).
4.2 Stage 2
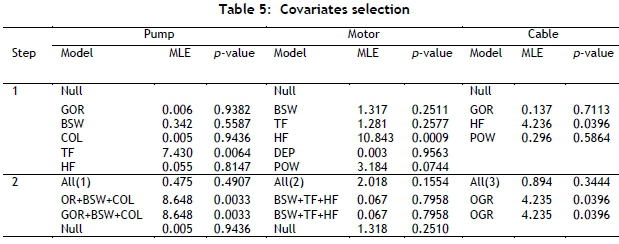
The second stage started with the assessment and selection of covariates using MLE, according to the stepwise method. Table 5 shows the results of covariate selection for the pump, motor, and electric cable. The significant covariates in each component were TF for the pump and HF for the electric motor and cable components. Tests were also conducted to analyse the interactions between covariates, but the result was not significant.
Based on the life data analysis (LDA), three probability distributions (Weibull, exponential, and lognormal) were tested in this stage using the Kolmogorov-Smirnov test. Table 6 synthesises the information on fitting the probability models. Analysis of failure events was conducted using the Reliasoft-Weibull® software.
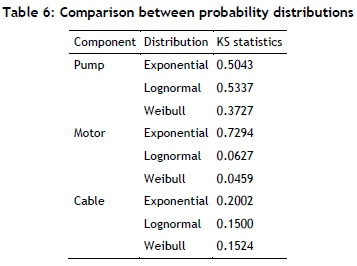
According to Table 6, Weibull distribution exhibited the best fit among the models tested for the pump and motor. For the cable, lognormal and Weibull exhibit equivalent results. Weibull distribution was thus selected for the three components to standardise the proposed model.
Figure 4 shows the behaviour of the risks functions, with and without covariates, for each component employing the Kaplan-Meier method. Taking the pump as an example, the units installed in wells with a flow of less than 30m3/day (dotted line) exhibited a greater accumulated risk than those with flow above this value. This occurs because wells with low flow favour pump cavitation, raising the temperature in the equipment. As previously stated in Section 3.2, if the plots of the functions appear to be parallel in a horizontal direction, the AFT model might be the appropriate method to be used [25].
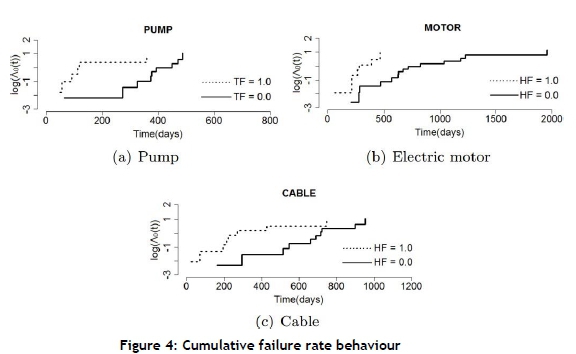
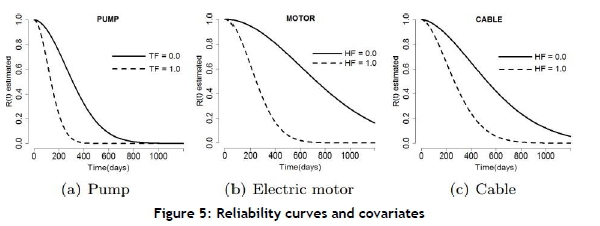
The AFT model is written mathematically for a set of covariates x1, x2,-,xn, as R(t) = R0((фt), where R0(t) is the baseline survivor function and ф = exp(-ßx) is an acceleration factor that depends on the covariates, and where ß is a vector of regression coefficients. An acceleration factor above 1 prolongs the time to the event, while a value below 1 indicates that an earlier event is more likely. The effect of a covariate in the AFT model is to stretch or shrink the survival curve along the time axis by a constant relative amount. This effect can be observed in Figure 4 for the three components.
Parametrising the Weibull distribution for the AFT model (Weibull-AFT), the reliability function can be expressed as follows:

where p is some ancillary shape parameter estimated from the data. Equation (2) can be expressed for the three components under study as follows:
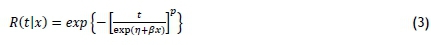
where n = exp(ß0) is the parametrised shape coefficient of the Weibull distribution without considering the effects of the covariates, and x = 1 if the considered covariate affects the component operation, otherwise x = 0. We can also compute the corrected scale parameter (n') of the Weibull distribution, taking into account the covariates, as n' = n- ßx.
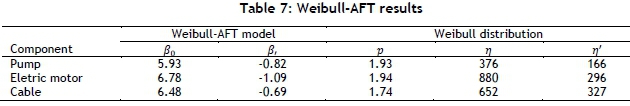
The Weibull-AFT model was applied in the three ESP components using R® software. Table 7 presents the obtained values of the variables in Equation (3), including the Weibull distribution parameters.
The value of the shape parameter (p) shown in Table 7 for the pump indicates that the component operates in the wear-out portion of the bathtub curve, characterised by the gradual increase in failure rate. The value of the scale parameter (n0 = 376 days) indicates the time at which 63 per cent of the units have already failed. The same reasoning can be used in the analysis of the remaining components. Figure 5 shows the influence of the covariates on reliability curves considering each component analysed in this work. In all cases, the influence of covariates makes the item more susceptible to failures.
The ESP system was modelled as three components linked in series, where one covariate is significant for each component. Even though the three components that make up the system contributed to its failure, the basic cause of the dysfunction was associated with the first component that failed The effects of the covariates on the system were thus analysed, considering four scenarios. For each scenario, a reliability block diagram (RBD) was constructed to obtain the reliability parameters. Table 8 shows the scenarios considering the effects of the covariates on the system.
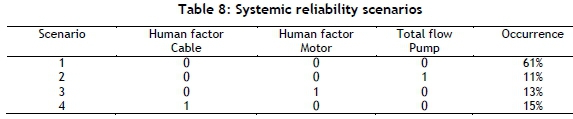
As observed in Table 8, scenario 1 indicates that failures in the ESP system are not related to the covariates, representing 61 per cent of the events. Similarly, scenario 3 shows that the failures were only influenced by the human factor covariate in the electric motor component, accounting for 13 per cent of the events. Analysis of scenarios is necessary because each covariate has an impact on the mean and median time of the item. This is reflected in the number of spare parts required in stock. The scale parameters were thus corrected according to the effect of the covariate on the item (see Table 8).
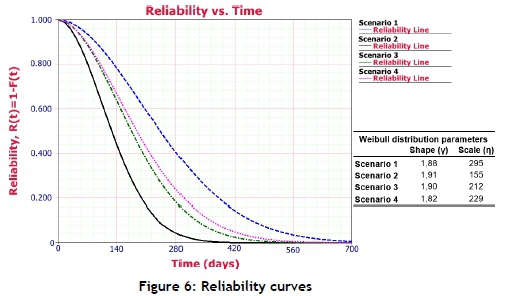
According to the association in series of the items that make up the ESP system, the resulting reliability is calculated from the product of the individual reliabilities, using the Reliasoft-BlockSim® software. Figure 6 shows the reliability of the system for each scenario.
4.3 Stage 3
One of the main objectives of this stage was to compute the number of failures of each component following Equation (1). Given the Weibull distribution, the mean time between failures and the standard deviation were computed as follows, respectively:
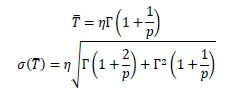
where, r refers to the gamma distribution.
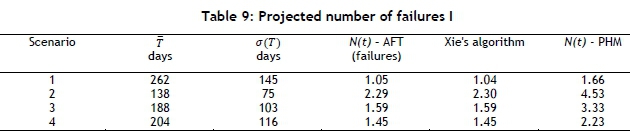
For each scenario, Table 9 shows the measures of central tendency and variability in the ESP system, and the number of failures, computed using different methods, considering the prediction for 365 days and the demand for an oil well. Given the importance of the number of failures for the optimisation and prediction of spare parts, we decided to evaluate the values computed using the AFT model, N(t) -AFT, with Xie's [25] algorithm, and following the proportional hazard model, N(t) -PHM. The values of N(t)-PHM were computed as in the study of Barabadi et al. [20]. These three values were also presented in Table 9. It should be mentioned that the standard deviation for each scenario is considerable when compared with the mean time. This is due to the randomness of the data, and the need to consider all the events to identify covariates. In this case, the operating time for each component exhibited significant values, reflected in the standard deviation.
Based on the results presented in Table 9, similar values were obtained between the predictions generated using Xie's [25] recursive algorithm and (N(t)-AFT), showing that the proposed simplification to calculate the number of renewals (according to Gnedenko et al. [23]) can be effective. However, significant differences were obtained when using the two survival models. On average, the AFT model reduced the number of failures estimative by around 43.25 per cent, in comparison with N(t) -PHM. The largest reduction was in scenario 3 (52%), while the smallest one was in scenario 4 (33%). Although the PHM is routinely employed for the analysis of spare parts in reliability engineering in the presence of covariates [10, 19], the AFT has already been favourably compared in some medical studies [26]. The AFT approach can be suitable when the assumption of proportional hazards does not hold, especially in circumstances where the effect of the intervention is to delay or accelerate the onset of an event rather than to reduce or increase the overall proportion of subjects who observe the event through time. In our case, the AFT led to more precise results. The implementation and interpretation of the results was also simpler using AFT.
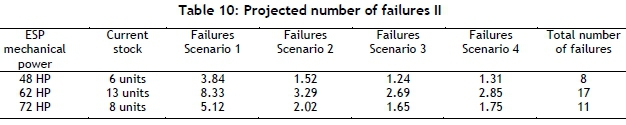
In general, the number of projected failures increased with a reduction in time between failures. Scenario 2 was the most critical of those presented, resulting in around two failures in one year. Each scenario was characterised by a weighting that corresponded to its representativeness in the model. For example, Scenario 1 accounted for 61 per cent of failures, as shown in Table 8. For the first partial calculation of the number of failures in the ESP system, the total number of failures was obtained by multiplying N(t) by the number of wells studied, considering the percentage of each scenario in Table 8. Table 10 shows the number of failures predicted for ESP units over a period of 365 days, according to the three types of ESP set analysed.
However, the results presented in Table 10 are partial. Given the repairability of the spare part analysed, the maintenance cycle must be considered in the analysis, considering that the item returns to stock after being repaired. To address this situation, the algorithm presented in section 3.3 was used. Table 11 thus shows the final number of spare parts needed, considering the repairability of the components. According to the results for the 48HP ESP, the organisation must provide three spare parts in order to address eight failure occurrences in one year. In this case, the stock will meet the demands of the maintenance process, considering a confidence level (fill rate) of 98 per cent. For the purposes of comparison with other sectors, airline companies adopt a fill rate of 85 per cent [2]. As a complementary analysis of the final results, Figure 7 presents a sensitivity analysis, where the confidence level and number of spare parts are related to the acquisition cost of the item in US$.
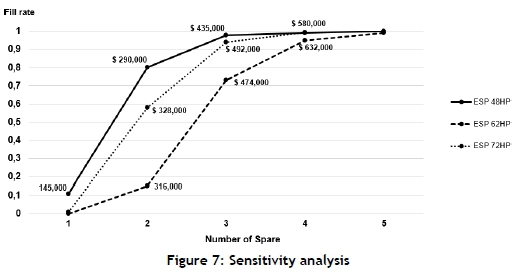
Figure 7 shows that, by immobilising three spare part units of the 48 HP ESP, the level of satisfied demand will be 0.98, requiring an investment of US$435,000.00. In the current situation, the company immobilised six units of this item in stock, representing an acquisition cost of US$870,000.00. However, as this amount does not consider the value of maintaining stock, the risk of obsolescence, and the opportunity cost of the capital, the total cost can be increased by up to 40 per cent of the stock value [4]. The fact that a large number of different spare parts are used in the oil industry, and numerous units exhibit problems similar to those presented here, confirms the importance of this study in supporting the organisation's decision-making process and of using scientific approaches to optimise the resources invested in stock. Furthermore, the monetary values in the context of the study allow the application of this tool to analyse critical spare parts, clarifying the relationship between the operational characteristics of the equipment and the prediction of spare part items, thus contributing to decision-making. An integrated analysis of expenses demonstrates that the financial value related to stock optimisation could be invested in more important projects to improve overall investment efficiency. For the current analysis, it was suggested that three additional units be transferred to the company stocks.
5 CONCLUSION
Predicting spare parts based on equipment reliability is an effective solution for planning material resources. This study proposed a case study to predict repairable spare parts for run-to-fail equipment, using covariates. The study was applied to some units of electrical submersible pumps - widely used equipment on oil-drill fields in the petroleum industry - for a small production unit of Petrobras. The choice of equipment was influenced by the high investment cost and prolonged resupply time, which cause loss of profit. The study stands out for considering repairable equipment in a spare parts prediction model, using analysis of the repair cycle. As long as the premises for applying the regression models and the renewal process are met, this model could be applied to other equipment and industrial sectors.
The study showed that the human factor and flow were representative of the model - that is, they influence the equipment failure rate. The explanatory variables clarified the relationships between failures and the external environment, resulting in management support measures. Sensitivity analysis also made it possible to simulate decision-making support policies, with spare parts prediction related to the confidence level of the stock and the cost of immobilised capital.
The obtained results for the ESPs show an average reduction of 60.6 per cent in the required number of spare parts, considering an average fill rate of 95.33 per cent. This reduction implies an estimated annual savings of around US$664,720 in inventory costs for the considered units. As they account for less than six per cent of all ESPs installed in Petrobras, the maintenance division of the company projected an annual saving in inventory costs of around US$15,000,000 by applying the method to all pumps in the company.
For future studies, given the scarcity of computational tools for spare parts analysis, it is suggested that the method developed here be implemented as a computation module in the enterprise resource planning of the company. In this case, the software could analyse consumable or repairable spare parts, as well as equipment, whether or not it has a constant failure rate. Another proposal of the study is to analyse stock linked to predictive preventive maintenance (thermography, vibration analysis, current spectrum). In other words, according to the evolution of the defect, an equipment degradation model could be drawn and the time to failure projected. Purchase requests would be based on the resupply time and the estimated time to failure.
ACKNOWLEDGEMENTS
This work was supported by the Conselho Nacional de Desenvolvimento e Pesquisa, CNPq under grants 301453/2013-6 and 304536/2016-4. The authors would like to thank the reviewers for useful comments and suggestions, and Petrobras for helping us to understand the problem and conduct the study.
REFERENCES
[1] Louit, D., Pascual, R., Banjevic, D. & Jardine, A. K. 2011. Optimization models for critical spare parts inventories: A reliability approach. Journal of the Operational Research Society, 62(6), 992-1004. [ Links ]
[2] Kilpi, J. & Vepsäläinen, A. P. 2004. Pooling of spare components between airlines. Journal of Air Transport Management, 10(2), 137-146. [ Links ]
[3] Mehrotra, A., Natraj, N. & Trick, M. A. 2001. Consolidating maintenance spares. Computational Optimization and Applications, 18(3), 251-272. [ Links ]
[4] Sandvig, J. C. & Allaire, J. J. 1998. Vitalizing a service parts inventory. Production and Inventory Management Journal, 39(1), 67. [ Links ]
[5] Alrabghi, A. & Tiwari, A. 2015. State of the art in simulation-based optimisation for maintenance systems. Computers & Industrial Engineering, 82, 167-182. [ Links ]
[6] Hu, Q., Boylan, J. E., Chen, H. & Labib, A. 2018. OR in spare parts management: A review. European Journal of Operational Research, 266(2), 395-414. [ Links ]
[7] Alsyouf, I., Shamsuzzaman, M., Abdelrahman, G. & Al-Taha, M. 2016. Improving reliability of repairable systems using preventive maintenance and time-between-failures monitoring. European Journal of Industrial Engineering, 10(5), 596-617. [ Links ]
[8] Bell, E., Kwiatkowski, C. & Ross, C. 1979. Computer aids for reliability prediction and spares provisioning. Electrical Communication, 54(2), 136-142. [ Links ]
[9] Mani, V. & Sarma, V. 1984. Queuing network models for aircraft availability and spares management. IEEE Transactions on Reliability, 33(3), 257-262. [ Links ]
[10] Ghodrati, B. & Galar, D. 2013. Spare parts estimation for machine availability improvement addressing its reliability and operating environment case study. International Journal of Reliability, Quality and Safety Engineering, 20, 134005-134020. [ Links ]
[11] Ascher, H. & Feingold, H. 1984. Repairable systems reliability: Modeling, inference, misconceptions and their causes. New York: CRC Press/M. Dekker. [ Links ]
[12] Gustafson, A., Schunnesson, H. & Kumar, U. 2015. Reliability analysis and comparison between automatic and manual load haul dump machines. Quality and Reliability Engineering International, 31(3), 523-531. [ Links ]
[13] Syntetos, A. A. & Boylan, J. E. 2010. On the variance of intermittent demand estimates. International Journal of Production Economics, 128(2), 546-555. [ Links ]
[14] Kourentzes, N. 2013. Intermittent demand forecasts with neural networks. International Journal of Production, 143(1), 198-206. [ Links ]
[15] Lowas III, A. F. & Ciarallo, F. W. 2016. Reliability and operations: Keys to lumpy aircraft spare parts demands. Journal of Air Transport Management, 50, 30-40. [ Links ]
[16] Gu, J., Zhang, G. & Li, K. W. 2015. Efficient aircraft spare parts inventory management under demand uncertainty. Journal of Air Transport Management, 42, 101 -109. [ Links ]
[17] Godoy, D. R., Pascual, R. & Knights, P. 2013. Critical spare parts ordering decisions using conditional reliability and stochastic lead time. Reliability Engineering & System Safety, 119, 199-206. [ Links ]
[18] De Jonge, B., Teunter, R. & Tinga, T. 2017. The influence of practical factors on the benefits of condition-based maintenance over time-based maintenance. Reliability Engineering â System Safety, 158, 21-30. [ Links ]
[19] Barabadi, A. 2012. Reliability and spare parts provision considering operational environment: A case study. International Journal of Performability Engineering, 8(5), 497-506. [ Links ]
[20] Barabadi, A., Barabady, J. & Markeset, T. 2014. Application of reliability models with covariates in spare part prediction and optimization: A case study. Reliability Engineering & System Safety, 123, 1-7. [ Links ]
[21] Tsakatikas, D., Diplaris, S. & Sfantsikopoulos, M. 2008. Spare parts criticality for unplanned maintenance of industrial systems. European Journal of Industrial Engineering, 2(1), 94-107. [ Links ]
[22] Lawless, J. F. 2002. Statistical models and methods for lifetime data. New Jersey: John Wiley. [ Links ]
[23] Gnedenko, B. V., Belyayev, Y. K. & Solovyev, A. D. 1969. Mathematical methods of reliability theory. New York: Academic Press. [ Links ]
[24] Xie, M. 1989. On the solution of renewal-type integral equations. Communications in Statistics - Simulation and Computation, 18(1), 281-293. [ Links ]
[25] Kumar, D. & Westberg, U. 1997. Some reliability models for analyzing the effect of operating conditions. International Journal of Reliability, Quality and Safety Engineering, 4(2), 133-148. [ Links ]
[26] Patel, K., Kay, R. & Rowell, L. 2006. Comparing proportional hazards and accelerated failure time models: An application in influenza. Pharmaceutical Statistics, 5(3), 213-224. [ Links ]
Submitted by authors 22 Aug 2019
Accepted for publication 27 Jul 2020
Available online 31 Aug 2020
* Corresponding author: luciano.ferreira@ufrgs.br

