


Services on Demand
Article
 English (pdf)
 Article in xml format
 Article references
Indicators

Related links
-
 Cited by Google
 -
 Similars in Google
Share

 Permalink
South African Journal of Industrial Engineering
On-line version ISSN 2224-7890
Print version ISSN 1012-277X
S. Afr. J. Ind. Eng. vol.31 n.2 Pretoria Aug. 2020
http://dx.doi.org/10.7166/31-2-2084
CASE STUDIES
Demand forecasting for high-turnover spare parts in agricultural and construction machines: a case study
C.B. GuimaraesI, *; J.M. MarquesI; U. TortatoII
IEngineering Studies Department, Federal University of Paraná -UFPR, Brazil
IIBusiness Department, Pontifical Catholic University of Paraná - PUCPR, Brazil
ABSTRACT
Conventional demand forecasting and inventory management models cannot be applied to replacement parts due to their intermittent and seasonal demand. Thus the aim of this study is to compare, in the case of the strategic stocking of high turnover replacement parts, the demand forecast model currently used by construction and agricultural machinery companies with the Box-Jenkins statistical model. The results show that it is important to use a methodology based on statistical techniques in inventory management, and that the proposed model adapts better to high turnover stock control.
OPSOMMING
Algemene vraagvooruitskattings en voorraadbestuursmodelle kan nie op vervangingsonderdele toegepas word nie as gevolg van hul onderbroke en seisoenale vraag. Die doel van hierdie studie is dus om, in die geval van strategiese voorraad van hoë omsetvervangingsdele, die vraag-voorspellingsmodel wat tans deur konstruksie- en landbou-masjineriemaatskappye en die Box-Jenkins statistiese model gebruik word, te vergelyk. Die resultate het getoon dat dit belangrik is om 'n metodologie te gebruik gebaseer op statistiese tegnieke in voorraadbestuur, en dat die voorgestelde model beter aangepas is vir hoë omset voorraadbeheer.
1 INTRODUCTION
This paper is a case study from a worldwide company that manufactures construction and agricultural machines. To preserve the confidentiality of the information in this paper, the company is called 'Alpha'. Furthermore, the paper uses only data from its Brazilian operation, where the company has about three thousand employees; the spare parts business employs about five hundred of them.
Alpha sells spare parts, as one of its products, to agricultural and construction machinery dealers, who are its direct customers. Dealers then sell these spare parts to their end customers. A very interesting aspect of the dealerships is the percentage of profit-sharing based on the sales of spare parts, as this segment is increasingly generating positive results. Of course, dealerships now view the spare parts business not just as a complement to the sale of machinery, but also as a highly profitable business with great development opportunities [1].
One of the most important costs in the financial statements of Alpha is related to the inventory of spare parts at distribution centres. This stock is divided into new parts and high-, medium-, low-, and very-low-turnover parts. The structure for making strategic decisions about planning the spare parts inventory is based on the company's enterprise resourcing planning (ERP) system. Using standardised algorithms (exponential smoothing), stock replenishments are carried out, as well as the necessary safety stock for planning around 130 thousand items with inventory, which represents around R$200 million [1].
The main purpose of this work is to show the relevance of using mathematical methods to manage the stock of high-turnover spare parts. The second purpose is to compare the results from the forecasts provided by Alpha's information system (exponential smoothing) with another statistical method - the Box-Jenkins methodology. Why is it important? The company is a market leader in South America; and despite having an ERP system, it does not follow its forecasts for managing the inventory of high-turnover spare parts. In addition, the company's system uses the exponential smoothing method to forecast all parts.
An overview of the globalised economy shows that the organisational environment is very competitive and dynamic. In recent decades, globalisation has become the key word in world markets. Organisations that aim to remain in this market, or even in their local markets, need, first of all, to analyse the situation around them and pay attention to the directions taken in the scope of globalisation [2]. The mechanisms and aspects of how organisations develop, plan, and implement an organisational strategy can represent significant gains or losses.
According to Makridakis, Wheelwright and Hyndman [3], effect demand forecasts are important to support delimiting the resources needed by a company. In new businesses, this activity becomes essential. The markets that can be accessed by the organisation, as well as the competition that contests them, change continuously, requiring new demand forecasts in shorter periods [2].
Accurate demand forecasts assist in developing strategies, identifying priorities, and allocating resources [4],[5], in addition to allowing plan capacity expansions and avoiding losses in sales and inventories through the efficient operationalisation of production and services, so that organisations offer high customer service levels [6],[7],[8].
Having stocks means taking some risks: fixed capital, obsolescence, deterioration. In recent decades the just-in-time (JIT) philosophy has been attacking all waste in companies, especially those originating in the existence of stocks; but in some cases there is no escape from them. When the waiting time is very long and the customer (whether internal or external) has a low tolerance for deadlines, it is necessary to have a certain level of inventory that can immediately meet this demand [9].
A big problem in the control of stocks of spare parts is to forecast accurately, since most of these artefacts are characterised by very irregular demand; in addition, some parts tend to have a high degree of complexity for manufacturing, and their absence from inventories results in months of waiting, thus affecting the company's service level [1].
Kochi [10] affirms that spare parts are required for the maintenance of industrial systems, as well as for consumer products. But the logistics have an inherent difficulty: traditional models for inventory management are invalid because, allied to this profile, there is the question of whether the demand is intermittent - that is, it occurs at random intervals and in variable quantities, making demand forecasting difficult for period ahead, increasing the risk of either excess or too little stocked material.
The study of forecasting for this type of demand was seen, therefore, as a field of research. The aviation industry pioneered the attempt to foresee the consumption of spare parts, since in general they are of high value and difficult to transport, and traditional methods were unsatisfactory because they presented gross errors resulting in an excessive quantity of parts, and represented a high cost of stock [10].
Some contributions were significant in the attempt to adjust this forecast, such as that used by Croston [11] and later by Wright [12], as corrections for errors were considered, and irregular data - or even the absence of data - were taken into account, which can be regarded as zero demand. Another contribution to this area was made by Willermain [13], who used an algorithm to calculate the order of orders, considering null demands for parts, reaching results much better than Croston' s method or exponential smoothing.
Demand forecasting is very important for companies operating in the agricultural sector, whether in industries in the first link of the chain (producers) or in those providing services to this link. Agriculture itself is highly seasonal, and depends on several economic and environmental factors, which in some circumstances can be mapped by statistical models [1].
The agricultural sector is of great importance to Brazil. In addition to supplying the domestic market, it has exported a large part of its production to the major world economies. This sector includes the sector of automotive agricultural machinery, an area of great opportunities. The auto parts industry is in full development, with part of its sales destined for automakers, another for export, another for the aftermarket, and the rest to intersectoral destinations [1].
The fleet of agricultural machinery in Brazil has been growing, and the growth outlook for the next decade is considered exceptionally good, as indicated by Alpha's planning. To accompany this growth, automakers maintain a significant number of dealerships for the retail sale of machines, as well as technical assistance for this circulating fleet [1].
When assessing the importance of the agricultural sector in Brazil, and verifying the size of the companies that operate in this field, the possibility of improving the results of the Alpha organisation was glimpsed. The logistical cost of the organisation under study is one of the main reducers of its net profit, mainly due to factors related to inventories and transport. Upon realising, through interviews with those responsible for demand forecasting, that Alpha's spare parts inventory management is done with the enterprise resource planning (ERP) forecasting tool, based on the exponential smoothing technique, the opportunity for a deeper study of this theme was confirmed.
Inventory management for high-turnover spare parts usually involves using modules that are available in information systems known as enterprise resource planning (ERP). These systems, despite using statistical tools, do not achieve satisfactory results in mid- and long-term forecasting, and only average results in short-term forecasting. This is because the systems use the same forms and concepts for different organisations in a wide variety of sectors. Furthermore, the statistical methodology available in these systems is basic, and it is not possible to work with more elaborate and robust techniques. For example, both Oracle and SAP, the biggest ERP suppliers, provide only seasonal models based on exponential smoothing [14], [15].
Rego [16], in his study of the gap between the theory of inventory management and the business practice of replacing parts at car dealerships in Brazilian companies, states that
it was evident that all the managers were unaware of academic forecasting models. The exponential smoothing, linear regression, and Box-Jenkins techniques were unknown to the interviewees (even if one of the concessionaires used exponential smoothing within the automaker's VMI system, the method was not recognized with this nomenclature).
In agreement with that study, Castro [17], in his paper on planning and control in production and stock in the Brazilian automobile chain, shows that only two per cent of companies use the Box-Jenkins method, none use linear regression, 22 per cent use exponential smoothing, and 34 per cent use a moving average. The consensus of specialists on the non-use of quantitative methods corresponds to 42 per cent of the total. These numbers highlight the low level of sophistication of the methods employed.
2 THEORETICAL FRAMEWORK
2.1 Inventory management
The administration of materials at a company is a set of activities to ensure the supply of those that are necessary for the organisation to function at the right time, with the necessary quantity, of the required quality, and at the best price. Making materials available before the right time means higher stocks than the company needs; while having materials available only after the right time means a lack of material to meet the company's needs. Having more than the necessary quantity means idle fixed assets, while having less may lead to insufficient stock [18], [19].
In organisations, if excess stock on the one hand means operational costs and tied-up capital, on the other hand low stock levels can lead to the loss of savings and high costs due to a lack of products [18].
Almeida and Lucena [20] state:
The ideal situation would be perfect synchronization between supply and demand, to make stock maintenance unnecessary. However, as it is impossible to determine future demand with precision and supplies are not always directly available, stock should be accumulated to ensure the availability of goods and minimize total production and distribution costs.
Inventory management is of vital importance to most companies due to the value of the items in stock and its direct association with the operational cycle of the company. Stock levels are largely dependent on sales levels [20].
The need to forecast sales before establishing the desired stock levels makes this administration a difficult task. It should also be noted that errors in setting stock levels could lead to losses in sales (if they have been undersized) or to excessive stocks (if they have been oversized). Therein lies the importance of their management, requiring the correct determination of stock levels. The aim is to ensure that the necessary stocks will be available when required to maintain the flow of production and, at the same time, to minimise the costs of ordering and maintaining stocks [20].
Excess stock is often the greatest threat to cash flow. For a company to be successful and to survive, the erroneous deployment of resources leads to unnecessary risks and wasted production opportunities [21].
2.2 Enterprise resource planning (ERP)
The adoption of information technologies has enabled organisations to innovate and generate competitive advantage, supporting the company both in routine activities and in the decision-making process. The development in information technologies has a high associated cost, however, taking into account technological advances; this cost must be understood as an investment, considering that non-adoption may bring higher costs [22]. A company invests in information systems in order to acquire competitive advantage and productive performance [23].
ERP is defined as a set of holistic business management solutions that are developed to ensure flexible access to information by all departments of a company, and whose main advantage is the integration of data and processes. ERP systems integrate information from multiple sectors of the company on a single platform [27].
Therefore, an ERP system helps companies to optimise the resources they have at their disposal. Several benefits are associated with its use [28]:
1. Management aid, since ERP allows the manager to analyse general and individual data for making decisions;
2. Financial integration, as the manager has access to all company information and can analyse expenses and revenues whenever necessary;
3. Efficient management of customer relations; with all information being centralised in a single system, it is possible to control customer orders more safely, and to have greater agility in the coordination of stocks, production, and transport. Also, the software obtains the history of each customer, which can be used to create marketing strategies to retain customers;
4. Security and confidentiality of information, since the probability of loss of information and/or possible fraud is reduced by the fact that only one software package is used;
5. Reduction of errors, taking into account that all departments are integrated, enabling the automation of processes and the storage of all information of the company's business.
At the business level, ERP is an integrated management system that aims to integrate all data (master and transactional) and processes of an organisation in a single system. This database is composed of information that interacts with and gives feedback to itself [24].
The main objective of the ERP is to integrate most of the business functions of an organisation into a platform, and companies choose ERP to replace their existing accounting systems, mainly to have stable behaviour in the management and practice of accounting [24], [25]. SAP, Oracle, and Sage, among others, are the main ERP vendors in the market [26].
2.3 Agricultural sector in Brazil
Agriculture is one of the most important activities in the Brazilian economy. It has been responsible for just over five per cent of Brazil's GDP in recent years, and almost R$100 billion in export volume, together with livestock. Therefore the practice of agriculture in Brazil is significantly responsible for the value of the country's trade balance [29].
The agriculture sector in Brazil has historically undergone several cycles and transformations, ranging from the sugar cane economy, based mainly on the production of sugar cane during the colonial period, to the recent transformations and expansion of coffee and soybeans. These transformations still occur, giving impetus to the technical transformations that took place since the 20th century, such as the mechanisation of production and the modernisation of activities [29].
The modernisation of agriculture in Brazil today is directly associated with the industrialisation process that occurred in the country during the same period mentioned above - a factor that was responsible for reconfiguration in the geographic space and the territorial division of Brazil. In this new scenario, the advancement of industries, the growth of the tertiary sector, and the acceleration of the urbanisation process made the countryside economically subordinate to the city, making it dependent on industrial techniques and production - machinery, equipment, pesticides, etc. [29].
The main brand of agriculture in Brazil today is the formation of agricultural complexes, notably developed in the regions that encompass the states of São Paulo, Minas Gerais, Rio de Janeiro, Santa Catarina, Paraná, Rio Grande do Sul, Goiás, Mato Grosso, and Mato Grosso do Sul. In this context, the production of soy, meat for export, and sugarcane stands out, due to the increased national and international need for ethanol [29].
2.4 Construction sector in Brazil
The current status of civil construction in Brazil makes professionals in the area excited. The emerging portion of Brazilians caused constant warming up the national real estate market, making the civil construction sector increasingly in demand. In 2011 the level of employment in the sector increased by 7.4 per cent - the equivalent of more than 200,000 jobs across Brazil [30].
The Brazilian Institute of Geography and Statistics (IBGE) reported that the GDP of civil construction in 2019 grew by 1.6 per cent compared with 2018. The sector generated 71,115 job vacancies for the country in 2019, making a total of 2.5 million workers working in this segment. This figure is equivalent to 11 per cent of the jobs created in the country [31].
2.5 Forecasting methods
Demand forecasts play a fundamental role in several areas in the management of organisations - for example, in the financial area, in human resources, and in sales. Such forecasts are also crucial in the operationalisation of various aspects of production management, such as inventory management and the development of aggregate production plans [32].
The main problem with demand forecasting is uncertainty about estimates. Science has looked for ways to reduce this uncertainty using forecasting methods. However, the uncertainty principle is inherent in forecasting methods; and for many authors, uncertainty is accentuated in long-term demand estimates, as market conditions are subject to change [33].
In many cases, because they are discredited, forecasts are disregarded. The credibility of the demand forecast is, therefore, a critical aspect of its use. An organisation's challenge is to develop a demand forecasting process that legitimises and gives quality to it, making it usable [33].
Demand forecasting methods can be classified into three major groups: qualitative models, historical series, and causal models. Chase, Jacobs and Aquilano [19] include a fourth group: simulation models. These groups present differences in terms of precision and accuracy according to the forecast horizon, the level of sophistication of the model, and the necessary database [34].
Qualitative forecasting methods are based on people's judgement and experience, supported by opinions, estimates, or subjective information. Time-series methods assume that the demand pattern in the past will reproduce in the future, thus analysing past data to extrapolate trends for the future using statistical techniques [35]. The causal forecasting methods seek to find the variables that cause the demand, and thus, by describing the scenario of these variables, demand can be predicted. Simulation models are dynamic models, usually computational, that simulate different scenarios for the forecast according to the variables that the model assumes [35].
Univariate quantitative methods use the historical data of the variable intended to forecast the evolutionary pattern, and use it to make extrapolations about its future behaviour. Therefore they use internal patterns of historical data to forecast the future. In other words, they model time series patterns and project them into the future. Of the quantitative methods, exponential smoothing and the Box-Jenkins method are used in this study [35].
Simple exponential smoothing (SES), as shown in Equation (1), is a widely used method because of its simplicity and efficiency in terms of results. It is similar to the moving average, with the basic differences being that, in exponential smoothing, all the historical data is used, and the values are weighted exponentially according to their period - i.e., the more recent data carries more weight in the forecast [36].

The Box-Jenkins models were developed for a time series with the data collected in sequence over time, and serial correlation in time is expected. The Box-Jenkins models, generally known as 'autoregressive integrated moving averages' (ARIMA), are mathematical models intended to capture the behaviour of the serial correlation or autocorrelation between the time series values and, based on this behaviour, to make forecasts. If this correlation structure is well-modelled, it will make good predictions [2]. According to [35], ARIMA models result from the combination of three components known as 'filters': the autoregressive component (AR), the integration filter (I), and the moving averages component (MA). A series can be modelled by the three filters or by only a subset, resulting in several models, as discussed below.
Stationary models assume that the process is 'balanced'. A process is considered weakly stationary if its average and variance remain constant over time. The auto-covariance function depends only on a time lag. A process is strongly stationary if all the joint moments are invariant under changes in time [2].
The autoregressive moving averages (ARMA) model is shown in Equation (2). In some cases it may be necessary to use a large number of parameters in purely AR or purely MA models. In these cases, it is advantageous to mix the components of an AR model with the components of an MA model, thus generating an ARMA model. The ARMA model (p,q) will require a lower number of terms.

When a time series has an average and variance dependent on time, it is because it is not stationary. The non-stationarity of a series implies that: a) there is an inclination in the data, and they do not remain around a horizontal line over time; and/or b) the variation of the data does not remain essentially constant over time - i.e., the fluctuations increase or decrease as time passes, indicating that the variance is being altered [2].
To detect the non-stationarity of a series, the temporal behaviour can be analysed graphically, seeking patterns (a) and (b) or applying statistical unit-root tests. The most commonly used unit-root test is the Dickey-Fuller.
As most time series statistical analysis procedures assume that they remain stationary, it will be necessary to transform them if they are not. According to Morettin and Toloi [36], the most common transformation consists of taking successive differences from the original series until a stationary series is obtained. The first difference of Zt is defined by Equation (3):
while the second is given by Equation (4):

According to the cited authors, in normal situations it is sufficient to take one or two differences for the series to become stationary. The number d of differences necessary to make a series stationary is denominated the integration order. The inclusion of the integration order allows the ARIMA models (p,d,q) to be used, as shown in Equations (5) and (6) [2].

where:

The ARIMA models explore the autocorrelation between the values of the series in successive instants; but when the data is observed in periods of less than a year, the series can also present autocorrelation for seasonality. The models included in this series with seasonal autocorrelation are known as seasonal auto regressive integrated moving averages (SARIMA). The SARIMA models, given by Equation (7), contain a non-seasonal part with parameters (p,d,q) and a seasonal part with parameters (P,D,Q)s [2].

3 METHODOLOGY
One of the initial ideas to verify the relevance of the study was to interview Alpha's employees who work directly in the inventory management area. The initial focus was the inventory of spare parts - that is, how demand forecasts were made for this type of part. In this first contact, an interview was held with the director of inventory planning, seeking to understand how Alpha managed its stock of medium and high turnover and the stock of new parts, identifying the representativeness, both financial and in the number of items.
In the interview, the employee informed us that the inventory management occurs based on what the company's ERP provides - that is, the ERP calculates, based on an algorithm, the quantity that the company must buy or stop buying. The system uses historical series analysis to quantify any trend component that may be present and to determine the statistical behaviour of each product.
The model used is extrapolative - that is, future demand is fully deducted from the historical series. The forecasting model must be supplied with demands of the repetitive type - that is, with demands for the part that can be recognised by the sales organisation. Demands about contracts, special sales, or others are not considered for the definition of the forecast.
One question that arose in this conversation was about which statistical method is being used in the software. The director informed us that they use the statistical technique of exponential smoothing because, when the software was implemented, it was the one that presented the best results in the tests made at that time. Also, according to the director, employees did not know enough about statistics to suggest another method.
Another question that arose was related to the number of parts in stock. In some cases, the stock was 30 times greater than the average of the latest demands generated by the software. When questioned, the employee replied that, "theoretically", the safety stock would, on average, be 10 erp cent more than the demand. However, as the forecasts in some cases were totally outside the reality of the parts market, the control of the stock was made manually by company specialists.
Because of this situation, it was found that the use of unsophisticated mathematical models for highturnover management might not be sufficient, as well as not providing important and timely information for high-turnover management. This was the first obvious sign that revealed an opportunity to deal with high-turnover stocks using other techniques.
From the scenario describe above, the study aims to outline a demand forecasting model for high-turnover replacement parts for construction and agricultural machinery using the Box-Jenkins method, thus enabling more accurate estimates of the demand for spare parts for a year, according to the needs of the company in question.
In the plan for this work, only the perspective of class 'A' high-turnover replacement parts in the Alpha organisation was studied, as it has a stock of 4,000 items, with over twenty million parts worth R$45 million. As they are high turnover parts with a low cost and a small physical volume, they are not given priority for treatment and analysis, and are allocated to the stock.
The data modelling was aided by statistical forecasting techniques - more specifically, time series analysis using the ARIMA/SARIMA model. The ARIMA/SARIMA model was chosen for several reasons:
1. Despite being a technique created in the 1970s, it still produces good results when compared with others, as long as its assumptions are complied with;
2. It is easy to program, and it is possible, through some software, such as Statigraphics and R, to choose the best parameters for the model automatically;
3. It is possible to interpret the parameters easily;
4. It is a model that intrinsically evaluates the trend, the cycle, the seasonality, and the error in its adjustment; and
5. It has the possibility of a specific argument if there is seasonality in the series - the SARIMA model.
According to Lynn, Schnaars and Skov [5], the SARIMA model is used when there is significant autocorrelation in seasonal lags. This means that it is necessary to consider a stochastic seasonality.
For the modelling, monthly data for four-and-a-half years of the selected variables was used, and a random sample of 30 spare parts was extracted from the stock, chosen following two basic criteria: only highturnover class 'A' parts (at least 64 sales per year) and parts with at least one demand in each period. Regarding the 54 observations (monthly data for four-and-a-half years, the first being for January of 2005 and the last for June of 2009), these are imposed by the Box-Jenkins methodology, since it is based on some strongly asymptotic results. According to the authors, a minimum of 50 observations is required to create the models and to make accurate forecasts.
The four remaining periods will be used to validate the forecasts. For each replacement part, the data modelling was done, using only its historical demand series, enabling the verification of the associated error measurements and the Box-Jenkins models. When analysing the adequacy of the models, the annual seasonality was considered, as informed by the organisation's employees in the interview phase. For each part, an analysis was conducted of the tendency of the series, confirming the presence of annual seasonality.
Following the creation of the demand forecasting models, a four-month forecast was made and validated. The models were evaluated in two ways. In the first case, this was done by testing the parameters of the models and verifying whether they were significant. In the second, the forecast value was compared with the observed value, generating a measurement error. From this measurement, conclusions can be drawn about the efficiency of the demand forecasting of the study. The calculated error measures were: the mean absolute percentage error (MAPE); the mean percentage error (MPE); the mean absolute deviation (MAD); and the mean squared deviation (MSD).
4 ANALYSIS OF THE RESULTS
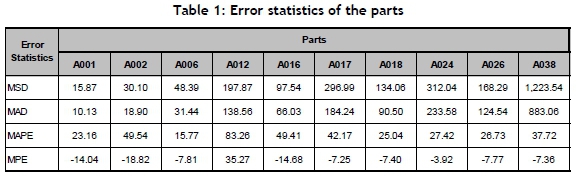
The study was conducted using 52 observations of the time series of demand and the projections for safety stock. The initial 48 observations were used to prepare and develop the models. The calculations of the error measurements, the estimates of the parameters, and the significance tests were done on this data series. The results of the errors for a sample of the parts can be seen in Table 1.
The data of the four remaining observations of the time series served to measure the effectiveness of the models and to draw comparisons with the projections obtained by the software used by Alpha. In short, the following information can be given for each of the four periods: the demand projected by Alpha, the demand forecast by the proposal of this study, the real demand and only for the fourth period, and the real stock.
This limitation on the information only for the last month of stock was because the system used by Alpha does not have a function to register this type of information, and thus does not generate a historical basis.
Regarding the results for the first period, the quantity demanded as projected by the models proposed in this study is very close in general to the quantity demanded in reality. Comparing the projected proposed stock with actual demand, it verifies that very few customers would not be served due to a lack of parts in the stock. Another conclusion that can be drawn for the sample under study is that the software used by Alpha projects around 20 per cent more parts, and proposes a safety stock that would leave about five per cent of the demand without the necessary parts.
The results obtained for the second period follow the same values of the analysis made previously for the first period.
For the third period, the results of the Alpha company's projections are inferior to those obtained by the models proposed in this work. The demand estimated by Alpha's software is 10 per cent lower than the actual demand. If checked piece by piece, this demand is up to 26 per cent less. In this way, when using the software intelligence of Alpha, on only 74 per cent of the occasions will there be the requested product, affecting the quality of the service provided by this distributor. Thinking about the use of the safety stock projected by Alpha, this number increases to 87 per cent.
For the fourth period, in addition to the information discussed in the previous periods, it was compared with the real stock. From this number, it is possible to verify that there is an opportunity to improve the inventory management. In the fourth period, the stock is seven times greater than the observed demand. When asking the employees responsible for stock control and demand forecasting about these numbers, the information was obtained that, because they are high-turnover parts, with low costs and small physical volume, they would not influence the stock; therefore they are not a cause of immediate concern. In the opinion of these employees, the priority in the analysis is for parts with slower rotation and with a large physical volume or high unit cost.
4.1 Comparison of projected demands with real demand
To facilitate the viewing of the results of the previous tables, the information on demand is displayed in Table 2.
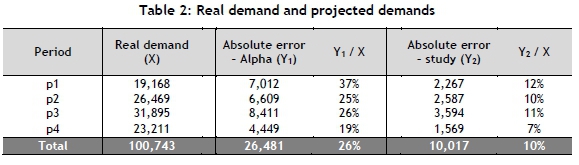
The absolute error, as it is called in Table 2, was calculated by the difference between the real demand value and the projected demand value. After this calculation, the module was applied to the result obtained in order to make absolute measurements of the information.
As can be seen in Table 2, the proposed methodology of the study showed, on average, a 10 per cent error in demand. The method used by Alpha had a mean absolute error rate of 26 per cent.
It is important to highlight that, for the fourth period, the average accuracy levels were higher in both projections than in the previous periods. This should not occur in a normal environment. However, as the study was conducted with seasonal models, this situation might be plausible.
Another measure to evaluate the error was to calculate the average percentage error - that is, for each part in a module, the projected value minus the real value. This value is divided by the real value. In the end, the average and standard deviations of these parts were calculated. In this case, the average, when using Alpha's software for periods 1, 2, 3, and 4, were respectively 67 per cent, 46 per cent, 58 per cent, and 44 per cent. The standard deviation was 104 per cent, 71 per cent, 111 per cent and 65 per cent respectively. When the comparison was made using the method proposed in this work, the following average results were found: 18 per cent, 14 per cent, 13 per cent, and 14 per cent respectively. The standard deviation numbers were 16 per cent, 11 per cent, 11 per cent, and 19 per cent respectively. These results demonstrate that the proposed method had a lower average error and less volatility between parts.
4.2 Comparison of projected stock and real demand
An interesting measurement for comparing the results is the difference between the projected stock and the observed demand. From this measurement, an availability index is obtained in relation to the stock. The stock forecast by this study was achieved by considering the 95 per cent confidence interval of the projection for each part in each of the four periods. In the case of Alpha, the safety stock forecast was achieved using its software, based on the exponential smoothing technique, although it did not discern which criterion was established to define the minimum storage.
For this calculation, Table 3 was used, considering the value per unit of each part stored in the stock using different criteria - i.e., real demand, the projection of the study, and the projection of the application used by the company in question.
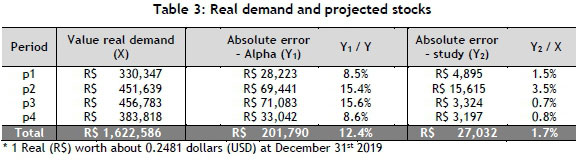
In Table 3, the error is calculated by subtracting the forecast stock from the real demand. If the forecast stock is greater than the demand, the standard value of zero is used to calculate this difference. Otherwise, it is possible to measure the number of parts that were lacking in order to meet the customer's needs.
This table shows the monetary values that the amounts represent. These numbers are important for measuring how much Alpha did not obtain in revenue due to the lack of spare parts in its stock. An analysis of Table 3, in financial terms, shows that, in the case of this sample, Alpha would fail to collect the equivalent of R$200,000 in revenue over the four months in question. With the models suggested in this study, the company would have lost R$27,000 in revenue.
When it is observed by quantity, it can be seen that only 1.4 per cent of requests, on average, would not be answered when using the method proposed in this study while, with the current methodology, this is 9.6 per cent. When comparing the methods, it should be highlighted that, in practice, Alpha does not use all the forecasts from its software.
4.3 Comparison of real stock and projected stocks
The last measure for the purpose of comparison between the model proposed in this study and the model used by Alpha will be in relation to the projected and current stocks.
Due to a technical limitation in the company, it was not possible to improve the study using information from the real stock for periods one, two, and three. However, based on the quantity stored in period four, it was possible to compare the proposed model, the current model, and the observed quantity.
Table 4 shows that, using statistical methods, a reduction of up to 84 per cent in inventories is possible (using smoothing exponential). This number, in financial terms, represents a reduction of about R$1.9 million. The figures mentioned above present only one problem: with this significant reduction in inventory, about 7.6 per cent of customers would not have the necessary products at the time of purchase, as can be seen in Table 3. This factor can compromise the level of service and the degree of consumer satisfaction. The methodology proposed in this study is concerned with this aspect. Table 4 shows that the reduction would be 76 per cent of the current stock, representing R$1.6 million. The number of unmet orders would be around 1.5 per cent due to the lack of parts in stock.

5 CONCLUSIONS AND RECOMMENDATIONS
The results were satisfactory for the two models used: the Box-Jenkins (proposed) and exponential smoothing (used by Alpha). The model implemented at Alpha has positive characteristics in terms of its facility for formulation in any system, and because it is easy to understand.
In the case of the proposed model, different tests were conducted to evaluate the feasibility of implementing the solution. First, a test was performed to evaluate the seasonality. In this test, the assumption of annual seasonality was found, as informed in the interview phase with the organisation's employees.
In the second case, different models were tested for each part to find one that best satisfied the assumptions. Following this phase, an analysis of the estimates of the parameters was conducted, seeking models with estimates that had a p-value lower than five per cent. The vast majority of the estimates of the parameters matched this assumption.
With the models created and the forecasts made, the next analysis was of the resulting measurements of error. Practically all the parts had low errors, indicating that the models fitted satisfactorily and revealed great power of accuracy in their forecasts.
After all the analyses of assumptions, seasonality, adjustments of the model, parameter estimates, and evaluation of errors, the results obtained were compared with those of Alpha's software and the real demand. The comparison of the results showed that the proposed model had a mean absolute error rate of 10 per cent in relation to real demand. However, for the fourth period, this rate was seven per cent. In the same evaluation, Alpha's software had a mean absolute error rate of 26 per cent, while for the first period this rate was 37 per cent. From this measurement, differences can be seen between the results obtained by the two methods. The accuracy rate of demand using this criterion is stronger for the proposed model.
A second important comparative analysis involved the proposed stock and real demand. The safety stock proposed in this study is calculated by the confidence interval of the forecast estimate of demand with 95 per cent significance. The results of this index favored the Box-Jenkins method, as on average 1.4 per cent of requests would not be met due to shortages in stock, while the method used by Alpha's software had an average shortage of 9.6 per cent. The best results for the software were for the first period; even so, 5.2 per cent of requests would not be met. Conversely, the best results for the proposed method were in the third period, with only 0.3 per cent of orders not being filled. Continuing with this comparison of methods in terms of stock and demand, for the four months of forecasting, Alpha would fail to collect R$200,000 in revenue if it literally followed the forecasts of its software. On the other hand, using the forecasts of the proposed model, the company would fail to collect R$25,000 over the four periods.
One of Alpha's great concerns is quality service and the availability of products for its customers. A single and consolidated analysis of the results shows that both techniques produce better results than the non-use of scientifically studied numerical methods. However, the proposed model produced better results than the software used by Alpha. This can be plausibly confirmed by verifying the objectives and concerns of Alpha. In the case of this study, it was proved that the Box-Jenkins technique had higher accuracy rates for both demand and safety stock when compared with real demand.
Supposing that the results obtained for the thirty-part sample could be extrapolated to the total class 'A' high-turnover part population, and that this total had the same proportions of the sample in terms of costs and quantity, the correct use of the proposed method would result in a reduction of fifteen million parts in stock, meaning a reduced cost of R$32 million.
The work has some limitations. The time series used was short, based on the minimum necessary to apply the technique employed in the study if there were no seasonality. Due to the complexity of the method, only one demand forecasting technique was used. For future studies, the use of a long time series of data is recommended, preferably with over a hundred observations to ensure the greater accuracy of the estimates of the parameters. Another suggestion is the use of different techniques, such as neural networks, Box-Jenkins with covariates, or Bayesian models. Finally, working with other classes of parts that are financially important to the company is also recommended.
REFERENCES
[1] Johann, E.R. 2009. Metodologia para gerenciamento do estoque estratégico de baixíssimo giro nos centros de distribuição de peças de reposição das empresas de máquinas agrícolas e de construção. Dissertação de Mestrado. Mestrado em Administração. Curtiba, Pontificia Universidade Católica do Paraná [ Links ].
[2] Werner, L. & Ribeiro, J.L.D. 2003. Uma aplicação dos modelos Box-Jenkins na área de assistência técnica de computadores pessoais. Gestão e Produção (UFSCar), São Carlos, 10(1), pp. 47-67. [ Links ]
[3] Makridakis, S., Wheelwright, S. & Hyndman, R.J. 1998. Forecasting methods and applications, 3rd ed. New York: John Wiley & Sons. [ Links ]
[4] Thomas, R.J. 1987. Forecasting new product market potential: Combining multiple methods. The Journal of Product Innovation Management, 4(2), 109-119. [ Links ]
[5] Lynn, G., Schnaars, S. & Skov, R. 1999. Survey of new product forecasting practices in industrial high technology and low technology businesses. Industrial Marketing Management, 28(6), pp. 565-571. [ Links ]
[6] Kotler, P. 1991. Marketing management: Analysis, planning, implementation, and control. New Jersey: Prentice- Hall. [ Links ]
[7] Moon, M., Mentzer, J., Smith, C. & Garver, M. 1998. Seven keys to better forecasting. Business Horizons, 41 (5), pp. 44-52. [ Links ]
[8] Kahn, K. 2002. An exploratory investigation of new product forecasting practices. The Journal of Product Innovation Management, 19(2), pp. 133-143. [ Links ]
[9] Morais, R.R. 2008. Dimensionamento de estoques em ambiente de demanda intermitente. Available: http://www.astreinbrasil.com.br/estoques.pdf [Accessed 3 Jan. 2018]. [ Links ]
[10] Kochi, G.T. 2008. Aplicação dos modelos de previsão de demanda intermitente na gestão do estoque de peças de reposição de relógios. Trabalho de Conclusão. Graduação em Engenharia de Produção. Escola Politécnica da Universidade de São Paulo. [ Links ]
[11] Croston, J.D. 1972. Forecasting and stock control for intermittent demands: Operational. Operational Research Quarterly, ISSN: 00303623, pp. 289-303. [ Links ]
[12] Wright, J.D. 1986. Forecasting data published at irregular time intervals using an extension of Holt's method. Management Science, 32, pp. 499-510. [ Links ]
[13] Willermain, T.R. 2004. A new approach to forecasting intermittent demand for service parts inventories. International Journal of Forecasting, ISSN: 01669-2070, pp. 375-387. [ Links ]
[14] SAP.2006. Forecast strategies. Available: https://help.sap.com/saphelp_scm50/helpdata/en/ac/216b6e337b11d398290000e8a49608/content.htm?no_cache=true [Accessed 13 Mar. 2020]. [ Links ]
[15] ORACLE. 2018. Oracle retail demand forecasting methods. Available: https://docs.oracle.com/cd/E12475_01/rdf/pdf/160/html/user_guide/output/fc_methods.htm [Accessed 13 Mar. 2020]. [ Links ]
[16] Rego, J.R. 2006. A lacuna entre a teoria de gestão de estoques e a prática empresarial na reposição de peças em concessionárias de automóveis. Dissertação de Mestrado em Administração. São Paulo, Universidade de São Paulo. [ Links ]
[17] Castro, R.L. 2005. Planejamento e controle da produção e estoques: Um survey com fornecedores da cadeia automobilística brasileira. Dissertação de Mestrado em Engenharia. São Paulo, Universidade de São Paulo. [ Links ]
[18] Garcia, E.S., Reis, L.M.T.V., Machado, L.R. & Ferreira, V.J.M. 2006. Gestão de estoques: Otimizando a logística e a cadeia de suprimentos. Rio de Janeiro: E-papers Servicos Editoriais Ltda. Available: http://books.google.com/books?id=AvfRM51NLcQC&dq=pt-PT [Accessed 21 Dec. 2010]. [ Links ]
[19] Chase R.B., Jacobs, F.R. & Aquilano, N.J. 2005. Administração da produção para vantagem competitiva. 10th ed. Porto Alegre: Bookman. [ Links ]
[20] Almeida, D. & Lucena, M. 2006. Gestão estoques na cadeia de suprimentos. Revista ECCO, Revista da Faculdade de Economia e Ciências Contábeis da Universidade Metodista de São Paulo n. 1, pp. 34-49, 2. [ Links ]
[21] Resnik, P. 1990. A bíblia da pequena empresa: Como iniciar com segurança sua pequena empresa e ser muito bem sucedido. São Paulo: Makron Books. [ Links ]
[22] Melo, F.R., Oliveira, R.C.R., Albuquerque, A.E. Jr, Valença, A.K.A. & Melo, V.O.F. 2017. Treinamento e participação dos usuários no desenvolvimento de sistemas: Desafios para a adoção de tecnologias de informação. Revista Gestão, 14, pp. 200-212. [ Links ]
[23] Suh, H., Chung, S. & Choi, J. 2017. An empirical analysis of a maturity model to assess information system success: A firm-level perspective. Behaviour & Information Technology, 36(8), pp. 798-808. [ Links ]
[24] Ruivo, P., Oliveira, T. & Neto, M. 2014. Examine ERP post-implementation stages of use and value: Empirical evidence from Portuguese SMEs. International Journal of Accounting Information Systems, 15, pp. 166-184. [ Links ]
[25] De Melo, J.C.S.-R. 2018. Implementação de um sistema ERP numa MPE. Mestrado em Ciências Empresariais. Lisbon School of Economics & Management, Universidade de Lisboa. [ Links ]
[26] SAGE. 2018. Apresentação Sage Portugal. Available: www.sage.pt/~/media/markets/pt/home/imprensa/apresentacaoinstitucional-sage.pdf [Accessed 3 May 2018]. [ Links ]
[27] Mahmud, I., Ramayah, T. & Kurnia, S. 2017. To use or not to use: Modelling end user grumbling as user resistance in pre-implementation stages of enterprise resource planning system. Information Systems, 69, pp. 164-179. [ Links ]
[28] Gonçalves, A. 2016. Um sistema ERP (enterprise resource planning) é útil apenas para grandes empresas? Available: pt.officegest.com/erppequenas-medias-empresas-pme/ [Accessed 7 Nov. 2017]. [ Links ]
[29] Pena, R.F.A. 2020. Agricultura no Brasil atual. Available: https://mundoeducacao.uol.com.br/geografia/agricultura-no-brasil-atual.htm [Accessed 18 Apr. 2020]. [ Links ]
[30] Mulato, Y. 2020. PIB da construção sobe 1,6% em 2019, após cinco anos no vermelho. Available: https://www.aecweb.com.br/revista/noticias/pib-da-construcao-sobe-16-em-2019-apos-cinco-anos-no-vermelho/19793 [Accessed 18 Apr. 2020]. [ Links ]
[31] Mota, C.V. 2020. Setor mais abalado pela crise, construção volta a contratar depois de 5 anos. Available: https://www.bbc.com/portuguese/brasil-51066350 [Accessed 14 Jan. 2020]. [ Links ]
[32] Pellegrini, F.R. & Fogliatto, F. 2000. Estudo comparativo entre modelos de Winters e de Box-Jenkins para a previsão de demanda sazonal. Revista Produto & Produção, 4(special edition, April), pp. 72-85. [ Links ]
[33] Pacheco, P.H.P. 2007. Análise do processo de previsão de demanda B2B: O caso de um fornecedor do mercado empresarial. Dissertação de Mestrado em Administração. Curtiba, Pontificia Universidade Católica do Paraná [ Links ].
[34] Ballou, R.H. 2001. Gerenciamento da cadeia de suprimentos: Planejamento, organização e logística empresarial, 4th ed. Porto Alegre: Editora Bookman. [ Links ]
[35] Vasconcellos, M.A.S. & Alves, D. 2000. Manual de econometria. São Paulo: Atlas, ISBN-10: 8522421544, pp. 308. [ Links ]
[36] Morettin, P.A. & Toloi, C.M.C. 2006. Análise de séries temporais. São Paulo: Blucher. [ Links ]
Submitted by authors 7 Nov 2018
Accepted for publication 26 Jul 2020
Available online 31 Aug 2020
* Corresponding author: cauebg@gmail.com

