


Services on Demand
Article
 English (pdf)
 Article in xml format
 Article references
Indicators

Related links
-
 Cited by Google
 -
 Similars in Google
Share

 Permalink
South African Journal of Industrial Engineering
On-line version ISSN 2224-7890
Print version ISSN 1012-277X
S. Afr. J. Ind. Eng. vol.31 n.2 Pretoria Aug. 2020
http://dx.doi.org/10.7166/31-2-2258
GENERAL ARTICLES
Impact of project participants' competition on project performance
A.M. Chitongo*, #; L. Pretorius
Department of Engineering and Technology Management, University of Pretoria, South Africa
ABSTRACT
The use of competition as a conflict-handling style aimed at win-lose end results has been highlighted by some researchers to be common during project execution. However, the impact of such competition on project performance remains largely under-researched. This article seeks to address this gap in the existing literature. A system dynamics simulation model of competition between two key project participants (client and engineering consultant) was formulated through a mixed methods research methodology incorporating the system dynamics approach. Data gathered for two sets of unique projects were used separately to conduct model calibrations, simulation experiments, and impact analyses. The results suggested that the competition negatively influenced project performance.
OPSOMMING
Sommige navorsers het die gebruik van mededinging, as 'n styl van hantering van konflik wat gemik is op wen-verloor as eindresultaat, uitgewys as redelik algemeen tydens die uitvoering van 'n projek. Die impak van sodanige kompetisie op projekprestasie is egter min nagevors. Hierdie artikel poog om die gaping in die bestaande literatuur aan te spreek. 'n Stelseldinamika-simulasiemodel van mededinging tussen twee belangrike projekdeelnemers (kliënt en ingenieur-konsultant) is geformuleer deur middel van navorsingsmetodologie wat gemengde metodes en die stelseldinamiekbenadering insluit. Data wat vir twee stelle unieke projekte ingesamel is, is gebruik om modelkalibrasies, simulasie-eksperimente en impakanalises afsonderlik uit te voer. Die resultate hiervan impliseer dat die kompetisie die projekprestasie negatief beïnvloed het.
1 INTRODUCTION
There is widespread use of project management in almost every organisation [1]. Yet poor project performance continues to be commonplace [2] [3] [4]. This may be attributed to many challenges encountered during project execution, including conflict [5]. Dysfunctional conflict is inevitable during project execution [6], owing to the different objectives [7] [8], competing expectations [8], and the inherent interactions and interdependencies among project participants [9].
Different project participants tend to take different decisions and control actions during project execution in a bid to protect their different and competing performance measures. Although often intendedly rational [10], such different decisions and control actions may turn out to be mutually exclusive, leading to the use of competition (aimed at win-lose end results) as a conflict-handling style [9]. Indeed, some previous researchers note that the use of competition as a conflict-handling style is quite common among project participants during project execution [11] [12] [13]. Nonetheless, the influence of such competition among project participants on project performance is largely under-researched. This article seeks to help to address this gap in the existing literature, building on a previous publication [1] that formulated (from the existing literature and systems thinking) a preliminary, high-level system dynamics conceptual model of competition between two key project participants (client and engineering consultant) during project execution.
The objectives of this article are thus: to formulate (from a combination of the existing literature, empirical study, and systems thinking) an appropriate system dynamics model of competition between two key project participants (client and engineering consultant) during project execution; to calibrate the model; and to investigate how the competition influences project performance, with a particular focus on time-based contracts and raw-water infrastructure-related projects.
To achieve the said objectives, this article proceeds with: a review of some relevant existing literature; a description of the research methodology followed; formulation of an appropriate system dynamics model of the competition; model calibration; analysis of the impact of the competition on project performance; and conclusions and some recommendations for further research.
2 LITERATURE REVIEW: COMPETING PROJECT PARTICIPANTS' PERFORMANCE MEASURES AND SYSTEM DYNAMICS MODELLING
Dysfunctional conflict is inevitable during project execution [6] [9] [14], owing to the different objectives [7], competing expectations [8], and inherent interactions and interdependences among project participants [9]. The different objectives and expectations result in the project participants having different performance measures, targets, and priorities during project execution. Different project participants tend to take different decisions and control actions in a bid to protect their different and competing performance targets during project execution. As highlighted in the preceding section, such different decisions and control actions may lead to the use of competition (aimed at win-lose end results) as a conflict-handling style [8] [9] [15]. Lyneis and Ford [11], Mohammed, White and Prabhakar [12], and Sutterfield, Friday-Stroud and Shivers-Blackwell [13] noted that the use of competition as a conflict-handling style is quite common among project participants during project execution. Lyneis and Ford [11] also called for research into system dynamics modelling and the improvement of the competition among the different project participants.
In the reviewed literature, no appropriate studies - other than Chitongo and Pretorius [1] - could be identified that considered competition among project participants with their different and competing performance measures and targets during project execution. Also, whereas many previous studies investigated the influence of an individual project participant's controls on project performance [11] [16] [17] [18] [19], no appropriate study could be identified in the reviewed literature that specifically investigated the influence of competition among project participants on project performance.
Solving system problems involving dynamic complexity (such as competition among project participants) is not possible for the human mind alone: system dynamics (which is systems thinking plus computer modelling and simulation) is quite useful for that [10] [20]. Chitongo and Pretorius [1], using a literature review and systems thinking, formulated a preliminary high-level system dynamics conceptual model of competition between two key project participants (the client and the engineering consultant) during project execution. Their model captured the competition in the form of two conflicting/competing feedback loops (client project cost control and engineering consultant project revenue control). However, their model had some notable limitations. First, it did not capture specific individual client project cost controls, nor their associated specific unintended effects [17]. Second, it did not capture specific individual engineering consultant project revenue controls, nor their associated specific unintended effects [16]. Third, it only captured one project performance measure (cost), although there are many other measures of project performance (including time and quality), as highlighted by Ngacho and Das [21]. Fourth, it was based only on a literature review and systems thinking; yet Luna-Reyes and Andersen [22] and Sterman [10] emphasise the need to capture relevant mental models of contemporary system actors. Finally, no appropriate detailed system dynamics simulation model was formulated.
In addressing the objectives stated in Section 1, this article thus seeks to build on the work of Chitongo and Pretorius [1], addressing its limitations, and adapting subsequent models by the same authors [16] [17]. The next section describes the research methodology followed in the current research study.
3 RESEARCH METHODOLOGY
The research objectives stated in Section 1 were achieved through a mixed methods research (MMR) methodology [23] [24], incorporating the system dynamics approach [10] [25]. The particular type of MMR design used was qualitatively driven, with sequential quantitative and qualitative supplementary components conducted simultaneously - i.e., QUAL -> quan+qual. It was, in effect, a two-stage research design.
The first stage was a qualitative, embedded multiple-case study [26]. Relevant non-project-specific qualitative data were gathered (through individual face-to-face semi-structured interviews with both client and engineering consultant project managers, non-participant casual observations during the interviews, and document analysis) from a purposefully selected South African engineering consulting firm with many raw-water infrastructure projects. The use of multiple sources of evidence (triangulation) helped to enhance the construct validity of the case study [26]. Similar to some previous studies [16] [17] [27], the gathered qualitative data were analysed through an iterative, three-stage qualitative data analysis process ('data condensation', 'data display', and 'conclusion drawing and verification') recommended by Miles, Huberman and Saldana [28], making use of ATLAS.ti software, a computer-assisted qualitative data analysis program [29]. Key outputs of the Atlas.ti qualitative data analysis were causal networks of client project cost controls and their associated unintended effects, and engineering consultant project revenue controls and their associated unintended effects. Appropriate dynamic hypotheses and a system dynamics conceptual model of competition between two key project participants (client and engineering consultant) were then formulated, using Vensim DSS software [30], from a combination of the existing literature, the causal networks, and systems thinking [10] [31]. The first stage of the study thus covered the problem identification and definition and system conceptualisation stages of the system dynamics modelling process [10] [25].
The second stage was causal explanatory research and simultaneous quantitative and qualitative (quan + qual) MMR design [23] [24], with multiple cases [26]. It was causal-explanatory, as this article sought to investigate the causal relationships between variables/constructs [10] [25] (influence of competition on project performance) as opposed to correlational analyses [32]. The conceptual model formulated in the preceding stage was converted to an appropriate system dynamics simulation model in line with system dynamics best practice [10] [25]. Project-specific data were gathered (from the same engineering consulting firm used in the first stage) through individual face-to-face semi-structured interviews for the primary data [32], and analysis of relevant project-specific documents for the secondary data [19] [32]. The gathered data, for 18 unique raw water infrastructure-related projects, were used to calibrate the formulated system dynamics simulation model, and to conduct simulation experiments and impact analyses. In effect, the second stage covered the model formulation, model testing and evaluation, as well as the policy analysis stages of the system dynamics modelling process [10] [25]. The next section presents key results from the first stage of the research study.
4 PROJECT PARTICIPANTS' COMPETITION SYSTEM DYNAMICS CONCEPTUAL MODEL
In this section, a system dynamics conceptual model of competition between the client and the engineering consultant is formulated by adapting and integrating some previous models [16] [17]. The formulated model is aimed at addressing the limitations of the model of Chitongo and Pretorius [1] highlighted in Section 2.
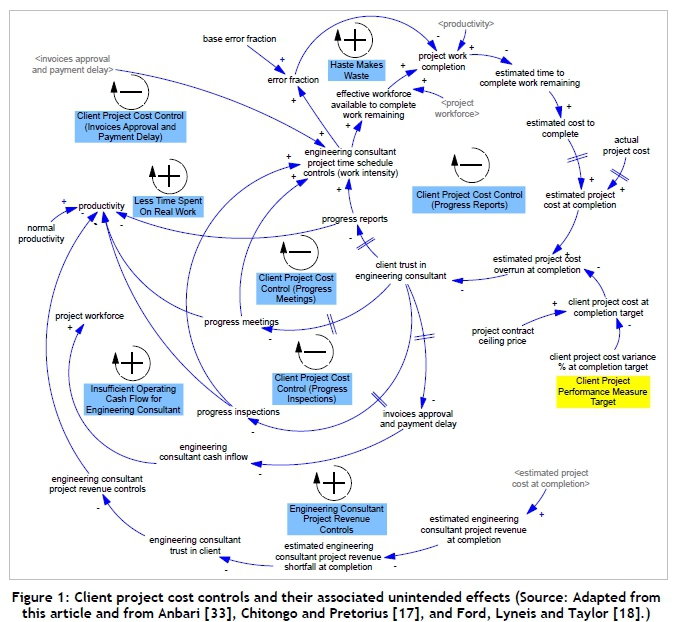
Figure 1 shows a system dynamics conceptual model of client project cost controls and their associated unintended effects, formulated from a combination of relevant causal networks generated using ATLAS.ti from the embedded multiple-case study and the existing literature, and making use of a systems thinking tool (causal loop diagram), as described in Chitongo and Pretorius [17]. Whereas Chitongo and Pretorius [17] covered only one engineering consultant project revenue control (effort adjustment), in Figure 1 'engineering consultant project revenue controls' refers to two engineering consultant project revenue controls (effort adjustment and project scope variation motivations). The four negative/balancing feedback loops (the intended client project cost controls) are opposed by the positive/reinforcing feedback loops (unintended effects), degrading project cost performance. The client project cost controls, aimed at eliminating 'project cost overrun', tend to generate some unintended and counteractive effects that increase the 'project cost overrun'. This counterintuitive key finding, similar to that of Chitongo and Pretorius [17], is the main dynamic hypothesis in Figure 1.
Figure 2 shows a system dynamics conceptual model of engineering consultant project revenue controls and their associated unintended effects, formulated from a combination of relevant causal networks generated using ATLAS.ti from the embedded multiple-case study, the existing literature, and systems thinking, as described in Chitongo and Pretorius [16]. It is an improvement of the model of Chitongo and Pretorius [16], clearly showing the link with the client project cost controls (Figure 1) by using similar variable naming. The two negative feedback loops (the intended engineering consultant project revenue controls) are opposed by the positive feedback loop (unintended effect), degrading the engineering consultant's project revenue performance. The engineering consultant project revenue controls, aimed at eliminating 'project revenue shortfall', tend to generate some unintended and counteractive effects that increase 'project revenue shortfall'. This counterintuitive key finding, similar to that of Chitongo and Pretorius [16], is the main dynamic hypothesis in Figure 2.
Project execution involves the rework cycle [11] [18]. Ford et al. [18] investigated the impact of three project time schedule controls (overtime, work intensity, and adding more people) for engineering consultants (or construction contractors) on project time duration and cost. Their findings suggested that the use of work intensity produced the worst amount of rework [18]. Integrating the engineering consultant project time schedule control (work intensity) and its unintended effect [18] with the client project cost controls and their unintended effects (Figure 1), as well as the engineering consultant project revenue controls and their unintended effects (Figure 2) yields the system dynamics conceptual model of competition between the client and the engineering consultant shown in Figure 3. It effectively addresses the limitations of the model of Chitongo and Pretorius [1] highlighted in Section 2 of this article.
In Figure 3, 'client project cost controls' refers to the client project cost controls (project progress reports, project progress meetings, project progress inspections, and delaying approval and payment of the engineering consultant's invoices) shown in Figure 1. Similarly, 'engineering consultant project revenue controls' refers to the engineering consultant project revenue controls (project scope variation motivations, and effort adjustment) shown in Figure 2. Figure 3 suggests that, in the particular case of time-based contracts with a ceiling price, as used in this article, the competition (aimed at win-lose results) arises from the use of conflicting performance measures and targets by the two key project participants, resulting in client project cost controls and engineering consultant project revenue controls that oppose/conflict with each other. The client project cost controls aim at eliminating 'project cost overrun' by reducing 'estimated project cost at completion' (a 'win-lose' control in favour of the client); while the engineering consultant project revenue controls aim at eliminating 'project revenue shortfall' by increasing 'estimated project cost at completion' (a 'win-lose' control in favour of the engineering consultant). The project controls of one project participant are often intendedly rational. However, their mutually exclusive and 'win-lose' solution orientation, coupled with the reactive project controls of the other project participant that are also mutually exclusive and 'win-lose' orientated, effectively mean the use of competition (aimed at 'win-lose' end results) as a conflict-handling style.
One of the key dynamic hypotheses presented in Figure 3 is that the client project cost controls and the engineering consultant project revenue controls tend to oppose (compete with) each other, generating some unintended effects that negatively influence project performance (increasing both 'project time schedule delay' and 'project cost overrun'). As discussed in Section 2, no appropriate study could be identified in the reviewed literature that investigated the influence of competition among project participants on project performance. The formulated system dynamics conceptual model (Figure 3) that captures the competing project controls (client project cost controls and engineering consultant project revenue controls) of two key project participants (client and engineering consultant), with their different and competing performance measures and targets during project execution, thus contributes towards filling the identified gap in the existing literature. The above-stated key counterintuitive and dynamic hypothesis also provides new insights into the dynamic complexity of project controls.
5 VALIDATION OF PROJECT PARTICIPANTS' COMPETITION SYSTEM DYNAMICS SIMULATION MODEL
The system dynamics conceptual model formulated in the preceding section (Figure 3) was converted to an appropriate system dynamics simulation model, in line with Martinez-Moyano and Richardson [25] and Sterman [10], using Vensim DSS software [30]. The system dynamics simulation model consisted of four key subsystems: project work flow and remaining work estimation, engineering consultant project time schedule control (work intensity) with its unintended effect, client project cost controls with their unintended effects, and engineering consultant project revenue controls with their unintended effects. The next sub-section discusses the model calibration that was conducted.
5.1 System dynamics simulation model calibration
5.1.1 Model calibration overview
Model calibration, as part of wider system dynamics model testing and validation, entails the estimation of values for the model parameters (model constants, which form part of model structure) so as to minimise the error between the simulated behaviour (simulation model outputs) and the corresponding observed behaviour (gathered real-world data) [35] [36] [37]. The real-world data gathered for two sets of unique raw water infrastructure projects (ten asset management planning and support-related, and eight asset renewal-related) were used to conduct two separate model calibrations on the formulated system dynamics simulation model of the competition between the client and the engineering consultant. The resultant two calibrated models were then used separately to conduct similar simulation experiments and impact analyses, with subsequent comparison of the results from the two sets, aimed at enhancing the validity of the resulting conclusions. The calibration of the model using two sets of unique projects belonging to two types of raw water infrastructure projects, as conducted in this article, offers a novel extension to the existing system dynamics simulation model testing and validation body of knowledge, considering that model calibration in the reviewed literature was limited to either only one project [17] [35] or multiple projects of the same type [36] [38]. It is expected to benefit future system dynamics research studies.
The model calibration problem was expressed as a single optimisation problem that has an error function (objective function or payoff) containing all relevant data available, and allowing for the adjustment of relevant model parameters, as recommended by Oliva [35]. Two payoffs were defined and used (for minimisation during the optimisation process): 'project pay-off' (used for individual project optimisation), and 'all projects pay-off' (sum of individual 'project pay-offs', used for simultaneous optimisation of all projects). Parvan, Rahmandad and Haghani [36] calibrated their system dynamics simulation model of interphase feedbacks in design-bid-build educational building construction projects by minimising a pre-defined payoff function formed by a linear combination of three sources of error between the model simulation outputs and their corresponding real-world project data of project time duration, cost, and cost curve. This article adapted the payoff function used by Parvan et al. [36] to new data gathered for the two sets of unique raw water infrastructure projects, and extended it to include the engineering consultant project cash inflow (invoice payment) curve as a fourth source of error [17]. The 'project pay-off' was thus formulated as a linear combination of four sources of error - namely, project time schedule duration, project cost, project invoicing curve (assumed to be indicative of project cost curve), and invoice payment curve (indicative of the engineering consultant project cash inflow curve), as shown in Equation 1.

where:
Wt = weight for the project time schedule duration component;
Tsim.í = simulated project time schedule duration for project i;
Tact.í = actual project time schedule duration for project i;
Wc = weight for the project cost component;
Csim.i = simulated project total cost for project i;
Cacti,i = actual project total cost for project i;
Wcc = weight for the project cost curve (invoicing curve) component;
Csim,i(t) = simulated project cost curve (invoicing curve) for project i;
Cact,i(t) = actual project cost curve (invoicing curve) for project i;
Dursim,i = simulation final time for project i;
Wipc = weight for the project invoice payment curve component;
IPsim,i(t) = simulated project invoice payment curve for project i; and
IPact, i(t) = actual project invoice payment curve for project i.
The calibrated parameters fell into two categories; ten assumed project-specific parameters (whose values vary from project to project) and five assumed non-project-specific parameters (whose values are common across all the projects). For each of the two sets of unique projects considered, the model calibration was conducted in three stages, adapted from Parvan et al. [36].
In Stage 1, Vensim software's built-in optimisation module (which makes use of the Powell conjugate search algorithm) was used to estimate (rough estimates) all the parameters (105 parameters for the first set, and 85 parameters for the second set) simultaneously. The optimisation was conducted simultaneously across all projects, and the 'all projects pay-off' was used as the objective function for minimisation.
In Stage 2, first, a project-by-project optimisation was conducted on the model, only changing the project-specific parameters, with the five non-project-specific parameters fixed (unchanging) at their respective estimated values obtained from Stage 1. In each case, the 'project pay-off' (Equation 1) was used as the objective function for minimisation in the optimisation. The calibrations provided improved estimates for all the project-specific parameters. Second, another optimisation was conducted on the model, this time simultaneously across all the projects, and only changing the non-project-specific parameters, with all the project-specific parameters fixed (unchanging) at their respective estimated values obtained from the preceding step. The 'all projects pay-off' was used as the objective function for minimisation in the optimisation. The calibration provided improved estimates for all the non-project-specific parameters.
In Stage 3, a final optimisation was conducted, this time simultaneously across all projects, and changing all parameters (both project-specific and non-project-specific), starting from the values obtained in the preceding step. The 'all projects pay-off' was used as the objective function for minimisation. More fine-tuned estimates for all parameters were obtained.
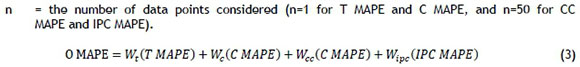
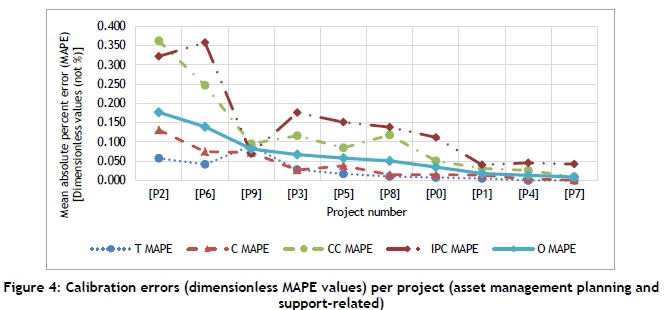
The mean absolute percentage error (MAPE), a behaviour reproduction test measure [10], was used as the calibration error descriptive statistic in this article. For each project, five calibration errors were determined: final project time schedule duration (T MAPE); final project cost (C MAPE); project cost curve (same as engineering consultant project revenue curve) (CC MAPE); project invoices payment curve (engineering consultant project cash inflow curve) (IPC MAPE); and the overall calibration error (O MAPE). Equation 2, consistent with Sterman [10], was used to determine the dimensionless T MAPE, C MAPE, CC MAPE, and IPC MAPE for each project. Equation 3, adapted from Parvan et al. [36], was used for the overall calibration error (dimensionless O MAPE). The weights (Wt, Wc, Wcc and Wipc) used in Equation 3 were exactly the same as those in the project payoff function (Equation 1). While Equations 2 and 3 yield dimensionless MAPE values (as used in this article), multiplying the two equations by 100 would yield the percentage values.

where:
5.1.2 Model calibration (asset management planning and support-related projects)
Project cost is the sum of all costs incurred by the client throughout the project life cycle [8]. Thus the project cost for executing a typical engineering project is the sum of all costs incurred by the client during project execution, and it includes the costs for project management services, engineering consultant services, and construction contractor works (including labour, material, equipment, and sub-contractors, among others). However, in this article, only time-based contracts with a ceiling price [34] between the client and the engineering consultant were considered, and only the time-based costs for the engineering consultant services were considered for the project cost. The project cost and project time schedule duration values in this article are thus only for the engineering consultant services.
The first model calibration was conducted using data gathered for the first set of projects (ten unique raw water infrastructure asset management planning and support-related projects) that were considered. The sample projects had initially planned project time schedule durations of between six months and 26 months, and initial project contract ceiling prices of between about R3.8 million and about R42.9 million. On average, the actual project time schedule duration was 16.7 months (with the actuals varying between 7.5 and 34.8 months); the project time schedule delay was 28.4 per cent (with the actuals varying between 10.7 per cent and 50.8 per cent); the project cost was R14.6 million (with the actuals varying between R3.5 million and R40.3 million); and the project cost overrun was 9.6 per cent (with actuals varying between -7.8 per cent and 20.4 per cent).
Figure 4 shows the simulation results for five different calibration errors, and dimensionless (not percentage) MAPE values, for each project, sorted in descending order of the overall calibration error (O MAPE). Project P7 had the least overall calibration error (indicating the project with the best fit between the simulated outputs and the observed real-world project data); while project P2 had the largest overall calibration error (the worst fit).
5.1.3 Model calibration (asset renewal-related projects)
The second model calibration was conducted using data gathered for the second set of unique raw water infrastructure projects considered (eight asset renewal-related projects). The sample projects had initially planned project time schedule durations of between four and ten months, and initial project contract ceiling prices of between about R2.5 million to about R7.6 million. On average, the actual project time schedule duration was 8.84 months (with the actuals varying between 4.75 and 14 months); the project time schedule delay was 29.3 per cent (with the actuals varying between 10 per cent and 62.5 per cent); the project cost was R5.1 million (with the actuals varying between R2.6 million and R8.5 million); and the project cost overrun was 10.9 per cent (with the actuals varying between 0 per cent and 22.2 per cent).
Figure 5 shows the simulation results for five different calibration errors, and dimensionless (not percentage) MAPE values, for each project, sorted in descending order of the overall calibration error (O MAPE). Project P17 had the least overall calibration error (indicating the project with the best fit between the simulated outputs and observed real-world project data), while project P14 had the largest overall calibration error (the worst fit).

The next sub-section discusses how the two calibrated system dynamics simulation models and the data gathered for the two sets of unique raw water infrastructure projects were used separately to conduct similar simulation experiments and impact analyses, with subsequent comparison of the results from the two sets, to assess the impact of competition between the two key project participants (client and engineering consultant) on project performance.
5.2 Analysis of the impact of the competition on project performance
5.2.1 Impact analysis overview
Analysis of the impact of competition between two key project participants (the client and the engineering consultant) on project performance was conducted in three stages. First (section 5.2.2), the data gathered for the first set of unique raw water infrastructure projects (ten asset management planning and support-related projects) were used to conduct two simulations (using the associated calibrated system dynamics simulation model discussed in Section 5.1.2) for each project. The first simulation was without competition: only the engineering consultant project time schedule control (work intensity) and its associated unintended effect were activated in the system dynamics model; no client project cost controls and their associated unintended effects were activated; and no engineering consultant project revenue controls and their associated unintended effects were activated. The second simulation was with competition: all the said controls and their unintended effects were activated in the system dynamics model. The impact of competition on project performance for each project was then assessed through the determination of two impact ratios: impact ratio on project time schedule performance, and impact ratio on project cost performance. A behaviour mode sensitivity analysis was then conducted, using the Monte Carlo sensitivity analysis module of Vensim DSS software [30], to assess, for each project, the sensitivity of the impact to uncertainty in key calibrated model parameters.
Second (section 5.2.3), the process followed in the preceding stage was repeated, but using data gathered for the second set of unique raw water infrastructure projects (eight asset renewal-related projects) and the associated calibrated system dynamics simulation model discussed in Section 5.1.3. Last (section 5.2.4), a comparison of the results (polarity and behaviour mode sensitivity of the impact) from the preceding two stages was made, with appropriate conclusions drawn about support for a related dynamic hypothesis, formulated in Section 4.
The three-stage analysis of the impact of competition on project performance, where the impact analysis and associated sensitivity analysis were conducted separately for each of the two sets of unique raw water infrastructure projects considered, with subsequent comparison of results from the two sets, assisted in enhancing the validity of the key research results (section 5.2.4). This, in turn, helped to address a related gap identified in the reviewed literature (section 2). It is a novel contribution to the enhancement of the existing system dynamics simulation model validation - in particular, the impact and sensitivity analyses, processes, and procedures - and this is expected to benefit future system dynamics research.
In this article, the schedule performance index (SPI) is a measure of schedule efficiency, and is determined as a ratio of planned project time schedule duration to actual/simulated project time schedule duration, similar to Parvan [38]. An SPI of less than 1 indicates that the project is behind schedule (inefficient); 1 indicates that the project is on schedule (efficient); and greater than 1 indicates that the project is ahead of schedule (highly efficient) [8] [33]. The cost performance index (CPI) is a measure of cost efficiency, and is determined as a ratio of planned project cost to actual/simulated project cost, similar to Anbari [33], Parvan [38] and Project Management Institute [8]. A CPI of less than 1 indicates that the project is over budget (inefficient); 1 indicates that the project is on budget (efficient); and greater than 1 indicates that the project is under budget (highly efficient) [8] [33].
Impact ratio on project performance, in this article, is a measure of the decrease/increase (deterioration/improvement) of a project performance index (SPI or CPI) as a result of competition between the client and the engineering consultant during project execution. In other words, it indicates the decrease/increase below/above what the SPI or CPI would have been if there had been no competition. Thus the impact of the competition, in this article, was assessed through two impact ratios: impact ratio on project time schedule performance and impact ratio on cost performance. The impact of competition on project time schedule performance was determined as impact ratio on project time schedule performance = SPI (without competition) / SPI (with competition). The impact of the competition on project cost performance was determined as impact ratio on project cost performance = CPI (without competition) / CPI (with competition). These formulations are comparable to those used by Parvan [38], who assessed the impact of building information modelling on project performance. An impact ratio on project performance of less than 1 indicates that competition positively influenced (improved) project performance; 1 indicates that the competition had no impact on project performance; and greater than 1 indicates that the competition negatively influenced (worsened) project performance. The next sub-section discusses key results from the first stage of the impact analysis.
5.2.2 Impact analysis (asset management planning and support-related projects)
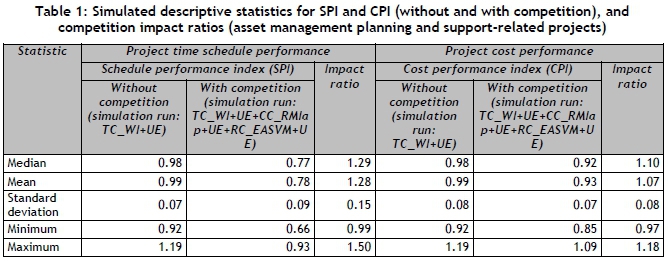
Table 1 shows the simulated descriptive statistics for the SPI and CPI (without and with competition), and the associated impact ratios (of competition between the client and the engineering consultant during project execution) on both project time schedule performance and project cost performance for the first set of unique raw water infrastructure projects (ten asset management planning and support-related projects) that were considered. On average, the competition negatively influenced project performance; both the project time schedule performance and the project cost performance have mean impact ratios greater than 1 - i.e., 1.28 and 1.07 respectively.
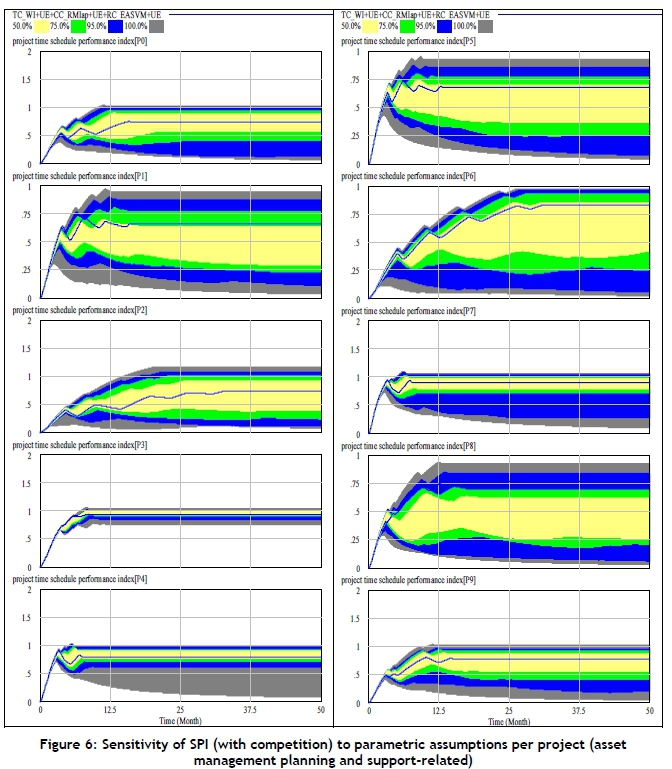
A multivariate Monte Carlo behaviour mode sensitivity analysis, conducted to assess the sensitivity of the impact of competition on project performance to uncertainty in some key calibrated model parameters, was limited to only the calibrated parameters whose values changed between the 'without competition' and 'with competition' simulations. It entailed automatically and randomly varying all selected parameters in 200 simulations (using the 'with competition' simulation) per project, saving SPI and CPI. Figure 6 shows sensitivities of the SPI per project.
As is evident in Figure 6, although there were effects in absolute values (i.e., numerical sensitivity was exhibited), the SPI exhibited no behaviour mode sensitivity: both the base case (based on calibrated parameter values, and represented by the blue single line) and the random cases (based on the 200 sets of randomly selected parameter values, represented by the solid envelopes) exhibited an S-shaped growth with overshoot and collapse behaviour mode for all the 10 projects. Similar results were obtained for sensitivities of the CPI for all the 10 projects. The next sub-section discusses key results from the second stage of the impact analysis.
5.2.3 Impact analysis (asset renewal-related projects)
Table 2 shows the simulated descriptive statistics for the SPI and CPI (without and with competition), and the associated impact ratios (of competition between the client and the engineering consultant) on both project time schedule performance and project cost performance for the second set of unique raw water infrastructure projects (eight asset renewal-related projects). On average, competition negatively influenced project performance; both the project time schedule performance and the project cost performance have mean impact ratios greater than 1 - i.e., 1.22 and 1.03 respectively.
The results of the multivariate Monte Carlo behaviour mode sensitivity analysis were similar to those of the first set of unique projects (Section 5.2.2). The SPI and CPI exhibited no behaviour mode sensitivity, although they exhibited numerical sensitivity; both the base case and the random cases exhibited an S-shaped growth with overshoot and collapse behaviour mode for all the eight projects. The next sub-section is the third stage of the impact analysis.
5.2.4 Comparisons and discussions (impact and behaviour mode sensitivity)
Table 3 (see Tables 1 and 2 for more details) shows the descriptive statistics for the impact ratios of competition on project time schedule performance and project cost performance for the two sets of unique raw water infrastructure projects (ten asset management planning and support-related, and eight asset renewal-related) that were considered. For both sets of projects, the mean values for impact ratios on both project time schedule performance and project cost performance were greater than 1. This means that, on average, the competition negatively influenced both project time schedule and cost performances for both sets of projects. The mean impact ratio on project time schedule performance was much higher than that on project cost performance for both sets of projects, as shown in Table 3. This means that the competition much more negatively influenced project time schedule performance than project cost performance, in both sets of projects considered. For instance, on average, the competition led to a 28 per cent project time schedule delay (overrun), and a much lower seven per cent project cost overrun for the asset management planning and support-related projects.
The multivariate Monte Carlo behaviour mode sensitivity analysis results (Sections 5.2.2 and 5.2.3) showed that the SPI and CPI exhibited no behaviour mode sensitivity, although they exhibited numerical sensitivity; both the base cases (based on calibrated parameter values) and the random cases (based on 200 sets of randomly selected parameter values) exhibited an S-shaped growth with overshoot and collapse behaviour mode for all the 18 projects. Thus the impact of competition on project performance (measured by project time schedule duration and cost) was insensitive to uncertainty in the key calibrated model parameters that were considered.
The preceding research results suggested no difference - in either polarity (which was negative), or in behaviour mode insensitivity of the impact of competition on project performance - between the two sets of unique projects. They supported the following dynamic hypothesis formulated in Section 4: The client project cost controls and the engineering consultant project revenue controls tend to oppose (compete with) each other, generating some unintended and counteractive consequences (unintended effects) that negatively influence project performance (increasing both 'project time schedule delay' and 'project cost overrun'). This finding is counterintuitive, at least on the part of the client, considering that the client project cost controls were aimed at eliminating 'project cost overrun'. It highlights the dynamic complexity of competition between the two key project participants, which was illuminated through the use of system dynamics. Indeed, system dynamics is a multi-disciplinary approach whose goal is to help managers to improve their understanding of systems that are characterised by dynamic complexity, and to use such understanding to design and develop more effective, high-leverage policies and structures that solve real-world problems and improve the performance of the systems [10] [25]. The preceding research results are thus a key step towards a full understanding of the dynamic complexity of such competition.
6 CONCLUSION AND RECOMMENDATIONS
The objectives of this article were: to formulate (from a combination of the existing literature, empirical study, and systems thinking) an appropriate system dynamics model of competition between two key project participants (client and engineering consultant) during project execution; to calibrate the model; and to investigate how the competition influences project performance. These objectives were achieved through a mixed methods research (MMR) methodology [23] [24], incorporating the system dynamics approach [10] [25]. The type of MMR design chosen for this article was qualitatively-driven with sequential quantitative and qualitative supplementary components, conducted simultaneously - i.e., QUAL -- quan+qual. It was in effect a two-stage research design.
In the first stage (qualitative, embedded multiple-case study), appropriate dynamic hypotheses and a system dynamics conceptual model of the competition were formulated from a combination of the existing literature; key findings from an embedded multiple-case study [26] that captured relevant mental models of the two key project participants (contemporary client and engineering consultant project managers) [10] [25]; and systems thinking [10] [31]. The conceptual model suggested that client project cost controls aim at eliminating 'project cost overrun' by reducing 'estimated project cost at completion' (a 'win-lose' control in favour of the client); while the engineering consultant's project revenue controls aim at eliminating 'project revenue shortfall' by increasing 'estimated project cost at completion' (a 'win-lose' control in favour of the engineering consultant). Project controls of one project participant are often intendedly rational [10]. However, their mutually exclusive and 'win-lose' solution orientation, coupled with the reactive project controls of the other participant that are also mutually exclusive and 'win-lose' orientated, effectively mean the use of competition (aimed at 'win-lose' end results) as a conflict-handling style.
In the second stage (causal explanatory research, involving multiple projects), a system dynamics simulation model of the competition, formulated using Vensim DSS software [30] from the conceptual model, was used to assess the impact of the competition on project performance. Project-specific data gathered for 18 unique raw water infrastructure-related projects were used for model calibration, simulation experiments, and impact analyses. In this article, two measures of project performance (project time schedule duration and cost) were used, similar to some previous models [18] [36]. The simulation and impact analyses results suggested that the competition negatively influenced project performance. The competition resulted in project time schedule delay and project cost overrun. This finding was also supported by multivariate Monte Carlo behaviour mode sensitivity analyses that were conducted to assess the sensitivity of the impact to uncertainty in some key calibrated model parameters. This result is counterintuitive, at least on the part of the client, considering that the client project cost controls were aimed at eliminating the project cost overrun.
Some researchers [11] [12] [13] highlighted the prevalence of competition (aimed at win-lose results) as a conflict-handling style among project participants as one of the key challenges encountered during project execution. Lyneis and Ford [11] called for research into the modelling and improvement of such competition. Yet no appropriate study could be identified in the reviewed literature that specifically investigated how such competition influences project performance. Thus the system dynamics model of competition between two key project participants (client and engineering consultant) formulated in this article, and the above-stated research findings (particularly the negative influence of the competition on project performance) help to address the identified gap in the literature. They also help to deepen project managers' understanding of project dynamics.
The model calibration, simulation experiment, impact analysis, and sensitivity analysis process conducted in this article, using two sets of unique projects belonging to two types of raw water infrastructure projects, is a novel extension of the existing system dynamics simulation model testing and validation body of knowledge. It is expected to benefit future system dynamics research. This is because model calibration and the subsequent simulation experiments and analyses in the reviewed literature are limited to either only one project [17] [35] or multiple projects of the same type [36] [38].
A future research publication by the authors of this article will, among other objectives, investigate how the competition influences the engineering consultant's project business performance, and how to improve the competition, yielding 'win-win' long-term results for the two key project participants. Further studies may also consider the construction contractor's performance controls in projects involving design and construction.
REFERENCES
[1] Chitongo, A.M. & Pretorius, L. 2016. Competition among project participants: A preliminary system dynamics conceptual model. 12th INCOSE SA Systems Engineering Conference. Pretoria: INCOSE SA. [ Links ]
[2] Molloy, E. & Chetty, T. 2015. The rocky road to legacy: Lessons from the 2010 FIFA World Cup South Africa stadium program. Project Management Journal, 46(3), pp. 88-107. [ Links ]
[3] Morris, R.A. 2008. Stop the insanity of failing projects. Industrial Management, 50(6), pp. 20-24. [ Links ]
[4] The Standish Group. 2014. Chaos [Online]. Available from: https://www.projectsmart.co.uk/white-papers/chaos-report.pdf [Accessed 22nd July 2016]. [ Links ]
[5] Dogbegah, R., Owusu-Manu, D. & Omoteso, K. 2011. A principal component analysis of project management competencies for the Ghanaian construction industry. Australasian Journal of Construction Economics and Building, 11(1), pp. 26-40. [ Links ]
[6] Morris, P. 2013. Reconstructing project management reprised: A knowledge perspective. Project Management Journal, 44(5), pp. 6-23. [ Links ]
[7] Cha, J., Newman, M. & Winch, G. 2018. Revisiting the project management knowledge framework: Rebalancing the framework to include transformation projects. International Journal of Managing Projects in Business, 11(4), pp. 1026-1043. [ Links ]
[8] Project Management Institute. 2017. A guide to the project management body of knowledge (PMBOK® Guide), 6th ed. Pennsylvania: Project Management Institute. [ Links ]
[9] Barki, H. & Hartwick, J. 2001. Interpersonal conflict and its management in information system development. MIS Quarterly, 25(2), pp. 195-228. [ Links ]
[10] Sterman, J.D. 2000. Business dynamics: Systems thinking and modeling for a complex world, 1st ed. Chicago: Irwin/McGraw Hill. [ Links ]
[11] Lyneis, J.M. & Ford, D.N. 2007. System dynamics applied to project management: A survey, assessment, and directions for future research. System Dynamics Review, 23(2-3), pp. 157-189. [ Links ]
[12] Mohammed, U.K., White, G.R. & Prabhakar, G.P. 2009. Culture and conflict management style of international project managers. International Journal of Business and Management, 3(5), pp. 3-11. [ Links ]
[13] Sutterfield, J.S., Friday-Stroud, S.S. & Shivers-Blackwell, S.L. 2007. How not to manage a project: Conflict management lessons learned from a DOD case study. Institute of Behavioral and Applied Management, 8(3), pp. 218-238. [ Links ]
[14] Hwang, B.-G. & Ng, W.J. 2013. Project management knowledge and skills for green construction: Overcoming challenges. International Journal of Project Management, 31(2), pp. 272-284. [ Links ]
[15] Marques, F., Lourenço, P., Dimas, I. & Rebelo, T. 2015. The relationship between types of conflict, conflict handling strategies and group effectiveness. Journal of Spatial and Organizational Dynamics, 3(1), pp. 58-77. [ Links ]
[16] Chitongo, A.M. & Pretorius, L. 2017. Engineering consultant project revenue controls: A system dynamics conceptual model. 5th Annual System Dynamics Conference in South Africa. Johannesburg. [ Links ]
[17] Chitongo, A.M. & Pretorius, L. 2018. Unintended negative effects of client project cost controls: A system dynamics approach. South African Journal of Industrial Engineering, 29(3), pp. 121-131. [ Links ]
[18] Ford, D.N., Lyneis, J.M. & Taylor, T. 2007. Project controls to minimize cost and schedule overruns: A model, research agenda, and initial results. 2007 International System Dynamics Conference. Boston. [ Links ]
[19] Nasirzadeh, F. & Nojedehi, P. 2013. Dynamic modeling of labor productivity in construction projects. International Journal of Project Management, 31(6), pp. 903-911. [ Links ]
[20] Forrester, J.W. 2007. System dynamics: A personal view of the first fifty years. System Dynamics Review, 23(2-3), pp. 345-358. [ Links ]
[21] Ngacho, C. & Das, D. 2014. A performance evaluation framework of development projects: An empirical study of Constituency Development Fund (CDF) construction projects in Kenya. International Journal of Project Management, 32(3), pp. 492-507. [ Links ]
[22] Luna-Reyes, L.F. & Andersen, D.L. 2003. Collecting and analyzing qualitative data for system dynamics: Methods and models. System Dynamics Review, 19(4), pp. 271-296. [ Links ]
[23] Cameron, R., Sankaran, S. & Scales, J. 2015. Mixed methods use in project management research. Project Management Journal, 46(2), pp. 90-104. [ Links ]
[24] Morse, J.M. & Niehaus, L. 2009. Mixed method design: Principles and procedures, 1st ed. California: Left Coast Press Inc. [ Links ]
[25] Martinez-Moyano, I.J. & Richardson, G.P. 2013. Best practices in system dynamics modeling. System Dynamics Review, 29(2), pp. 102-123. [ Links ]
[26] Yin, R.K. 2014. Case study research: Design and methods, 5th ed. Thousand Oaks: SAGE Publications. [ Links ]
[27] Manu, E., Ankrah, N., Chinyio, E. & Proverbs, D. 2015. Trust influencing factors in main contractor and subcontractor relationships during projects. International Journal of Project Management, 33(7), pp. 1495-1508. [ Links ]
[28] Miles, M.B., Huberman, A.M. & Saldana, J. 2014. Qualitative data analysis: A methods sourcebook, 3rd ed. Los Angeles: SAGE Publications. [ Links ]
[29] Atlas.Ti. 2016. ATLAS.ti manuals and documents [Online]. Available from: http://atlasti.com/manuals-docs/ [Accessed 04 April 2016]. [ Links ]
[30] Ventana Systems. 2018. Vensim manuals [Online]. Available from: http://vensim.com/documentation/ [Accessed 31 July 2018]. [ Links ]
[31] Monat, J.P. & Gannon, T.F. 2015. What is systems thinking? A review of selected literature plus recommendations. American Journal of Systems Science, 4(1), pp. 11-26. [ Links ]
[32] Welman, C., Kruger, F. & Mitchell, B. 2012. Research methodology, 3rd ed. Cape Town, South Africa: Oxford University Press Southern Africa. [ Links ]
[33] Anbari, F.T. 2003. Earned value project management method and extensions. Project Management Journal, 34(4), pp. 12-23. [ Links ]
[34] Turner, J.R. 2004. Farsighted project contract management: Incomplete in its entirety. Construction Management and Economics, 22(1), pp. 75-83. [ Links ]
[35] Oliva, R. 2003. Model calibration as a testing strategy for system dynamics models. European Journal of Operational Research, 151(3), pp. 552-568. [ Links ]
[36] Parvan, K., Rahmandad, H. & Haghani, A. 2015. Inter-phase feedbacks in construction projects. Journal of Operations Management, 39(2015), pp. 48-62. [ Links ]
[37] Rahmandad, H. & Sterman, J.D. 2012. Reporting guidelines for simulation-based research in social sciences. System Dynamics Review, 28(4), pp. 396-411. [ Links ]
[38] Parvan, K. 2012. Estimating the impact of building information modeling (BIM) utilization on building project performance. PhD thesis. University of Maryland. [ Links ]
Submitted by authors 3 Oct 2019
Accepted for publication 8 Jul 2020
Available online 31 Aug 2020
# The author was enrolled for a PhD (Project Management) degree in the Department of Engineering and Technology Management, University of Pretoria, South Africa.
* Corresponding author: u12279422@tuks.co.za

