


Services on Demand
Article
 English (pdf)
 Article in xml format
 Article references
Indicators

Related links
-
 Cited by Google
 -
 Similars in Google
Share

 Permalink
South African Journal of Industrial Engineering
On-line version ISSN 2224-7890
Print version ISSN 1012-277X
S. Afr. J. Ind. Eng. vol.31 n.1 Pretoria May. 2020
http://dx.doi.org/10.7166/31-1-2294
CASE STUDIES
Using failure modes and effects analysis as a problem-solving guideline when implementing SPC in a South African chemical manufacturing company
L.M. Appollis#; W.A. van Dyk; S. Matope*
Department of Industrial Engineering, Stellenbosch University, South Africa
ABSTRACT
Quality management has ceased to be an operational extra, and has become imperative to doing business in a saturated market environment with demanding clients. It is now a significant component of holistic operational management. The ultimate aim remains customer satisfaction, using the most effective techniques to ensure the most efficient and cost-effective process. Statistical process control (SPC) and statistical quality control have been widely used in quality management to enhance process performance by reducing process variation. However, SPC can only be effective if implemented with a structured problem-solving tool. The diagnostic ability of statistics, coupled with a failure modes and effect analysis (FMEA) as the problem-solving methodology during an out-of-control action plan, creates an environment conducive to improving processes and empowering employees. The failure modes and effect analysis was used to identify and eliminate sources of variation, which led to a reduction in process variation by 63 per cent and a decrease in defects by 160 961 per million opportunities.
OPSOMMING
Gehaltebestuur is meer as net 'n operasionele ekstra, en het noodsaaklik geword vir besigheidsverwesenliking in 'n versadigde markomgewing met keurige kliënte. Dit het ontwikkel vanaf 'n operasionele ekstra tot 'n beduidende komponent van holistiese operasionele bestuur. Die uiteindelike doelwit bly kliënt tevredenheid, deur die mees effektiewe tegnieke te gebruik om die doeltreffendste en mees koste-effektiewe proses te verseker. Statistiese prosesbeheer en statistiese gehaltebeheer is wyd gebruik in kwaliteitsbestuur om proses optrede te verbeter deur die variasie te verminder. Statistiese prosesbeheer kan egter slegs effektief wees as dit met 'n gestruktureerde probleemoplossings hulpmiddel geïmplementeer word. Die diagnostiese vermoë van statistiek, tesame met 'n mislukkingsmetodes en effekte-analise as die probleem-oplossingsmetode tydens 'n probleem oplossing-aksieplan, skep 'n omgewing wat bevorderlik is vir prosesverbetering en die bemagtiging van werknemers. Die mislukkingsmetodes en effekte-analise is gebruik om bronne van variasie te identifiseer en uit te skakel, wat gelei het tot 'n afname in prosesvariasie met 63 persent en 'n afname in defekte met 160 961 per miljoen geleenthede.
1 INTRODUCTION
The introduction of statistical methods in quality management systems has revolutionised how manufacturing companies operate [1]. An increasing number of companies are using various continuous improvement tools to enhance customer satisfaction [2-5]. The literature supports the success of implemented SPC programmes in machining and assembly [6]; the food manufacturing industry [7]; heating, ventilation, and air-conditioning [8]; maintenance and reliability [9]; software development [10]; medicine [11]; and project management [12]. Grigg and Walls (2007) state that companies are motivated to implement a statistical control tool for two main reasons: the proactive desire to develop a competitive edge and to realise specific operational benefits. These benefits are driven by a reduction in variation that might increase efficiency, improve quality, and also reduce operational costs [3].
The primary benefit of statistical process control (SPC) is establishing the ability to identify and remove assignable cause variation, thus ensuring the consistent manufacturing of compliant products [14]. SPC requires a specific and logical thought process for its effective implementation. Antony and Taner (2003) argue that employing the incorrect methodology when implementing an SPC programme largely contributes to the lack of SPC success in companies. Therefore it is essential to employ the correct methods when implementing SPC. This increases the potential value of implementing SPC. The correct methods, as proven by the literature, involve a well-articulated problem-solving methodology.
This paper investigates the application of failure modes and effects analysis (FMEA) in a South African chemical manufacturing company as the baseline for the problem-solving methodology when implementing SPC. The FMEA highlights the potential failures of a process, thus identifying potential deviations from process requirements [16] and so assisting the operations team during troubleshooting.
Problem-solving is executed using an out-of-control action plan (OCAP). The OCAP is a set of pre-established actions that provide operators with the diagnostic capability to determine the cause of assignable cause variation (the out-of-control point) and to identify the necessary steps and actions to address and nullify the root cause [17]. The FMEA forms part of the OCAP.
The OCAP was mentioned in a small percentage of the reviewed published literature; however, the reader was given little or no detail on how to proceed when an out-of-control point occurs. The bulk of the implementation frameworks lacked any problem-solving methodology; therefore this paper will attempt to close this gap by providing a structured approach to dealing with out-of-control points by complementing the SPC programme with the FMEA.
2 BACKGROUND INFORMATION
This section elaborates on concepts that are relevant to the research study.
2.1 Statistical process control
A fundamental trait of our everyday environment is that no subsequent event is precisely repeatable [18]. Despite the best efforts of manufacturing entities, the probability is low that two consecutive batches of material will have exactly the same characteristics [19,20]. Variation is inherent to processes, as a combination of people, materials, methods, machines, and the environment contribute to a natural variation around a process mean [3,8,18,21,22]. This variability can only be expressed using statistical terms.
SPC is a set of statistical problem-solving tools with the aim of achieving and maintaining process stability and improving process capability by minimising variability [20,23,24]. Statistics provides a platform to evaluate the performance of a process by establishing an associated measure of goodness of a dataset and translating this into process performance [25].
2.2 Variation
The cause of variation can be classified as either common cause variation or assignable cause variation [8,13,18,20,26,27]. Using control charts, the cause of variation can be isolated by identifying characteristic patterns [28].
Common cause variation - This entails natural fluctuation around the process mean indicating inherent and stable variation. No process adjustment is required for this natural variation [18]. As this is the natural state of the process, this variation can be reduced by installing a fundamental process change [29]. Operators trained in SPC can distinguish between common and assignable causes to prohibit unnecessary process adjustments, as these may have a severely negative effect on process performance and product quality [13].
Assignable cause variation - This variation is out of the ordinary, and requires problem-solving tools in order to identify the source of the variation [13]. This variation contains outliers or specific trends in the dataset that are the root of unstable variation. Assignable cause variations display unusual trends, and thus 'unusual root causes' must be sought for this type of variation [18,22,30]. Once the source has been identified, an input variable or a possible process parameter can be adjusted to regulate the variation and return the process to its natural state [29].
Although feedback control loops are built into logic control systems to regulate process parameters, these control systems cannot distinguish between common and assignable cause variation, and will compensate for the latter by overadjusting a process parameter to ensure that the process stays within the specification limits [24,31]. However, the source of the variation will not be removed, and it is still up to human intervention to restore the process to its natural state.
The effective implementation of SPC requires the effective use of control charts, which may only be beneficial to an organisation if it knows how to react when assignable cause variation is detected [17]. This knowledge can be documented as the FMEA.
2.3 Out-of-control action plan
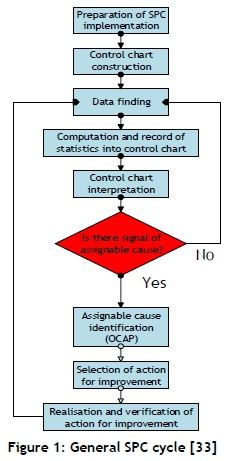
An out-of-control action plan is established by a cross-functional team to aid in rapid problem-solving once assignable cause variation has been identified [32]. The corrective actions are put in place by the SPC team to counteract the effects caused by the assignable cause variation. The team evaluates all the possible failures and their causes. This is documented as an easily readable document by the operators and owners of the SPC programme. Figure 1 illustrates the general SPC cycle when measuring and monitoring a characteristic, also illustrating the role of the OCAP in the cycle.
Out-of-control points trigger the out-of-control action plan. These points alert the operator or SPC system to assignable cause variation.
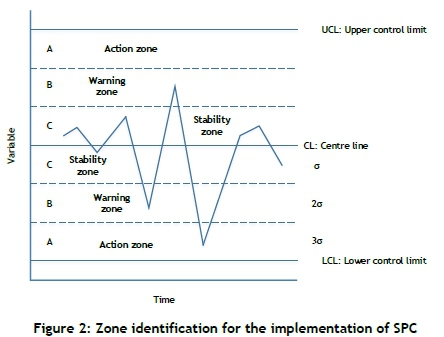
The criteria listed on the next page trigger the operator when assignable cause variation occurs, and raise operator awareness about natural process variation [15,26,34]. Figure 2 illustrates the zones mentioned in the section below in order to gain a better understanding of how to interpret Shewart control charts.
1. One or more points outside of the control limits.
2. Two or three consecutive points outside the two-sigma warning limits, but still inside the control limits.
3. Four or five consecutive points beyond the one-sigma limits.
4. A run of eight consecutive points on one side of the centre line.
5. Six points in a row steadily increasing or decreasing.
6. Fifteen points in a row in zone C (both above and below the centre line).
7. Fourteen points in a row alternating up and down.
8. Eight points in a row on both sides of the centre line with none in zone C.
9. An unusual or non-random pattern in the data.
10. One or more points near a warning or control limit.
Failure modes and effects analysis (FMEA) is a tool used to document and anticipate process failure by defining the potential failure modes of a process and proposing corrective actions. So it is particularly relevant when out-of-control points occur.
2.4 Failure modes and effects analysis
Failure modes and effects analysis (FMEA) and failure modes, effects and criticality analysis (FMECA) are procedures used and established by the USA Department of Defense [35] to:
... systematically evaluate and document, by item failure mode analysis, the potential impact of each functional hardware failure on mission success, personnel and system safety, system performance, maintainability, and maintenance requirement.
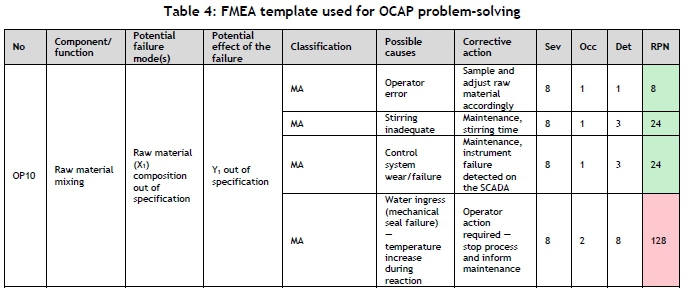
Pyzdek and Keller (2010) describe the FMEA as an outline that details all possible failures, the severity of the failure on the system (see Table 4 - 'Sev'), the likelihood (see Table 4 - 'Occ') that the failure might occur, and the probability that the failure might go undetected (see Table 4 - 'Det'). The product of these components generates the risk priority number (see Table 4 - 'RPN'), as illustrated below. The RPN highlights the level of risk, which the potential failure mode holds for the system by evaluating the severity, occurrence (likelihood), and probability of the possible causes using a relative scale of 1-10 for each index. Greater potential risk is associated with a higher RPN.

2.4.1 Severity and classification
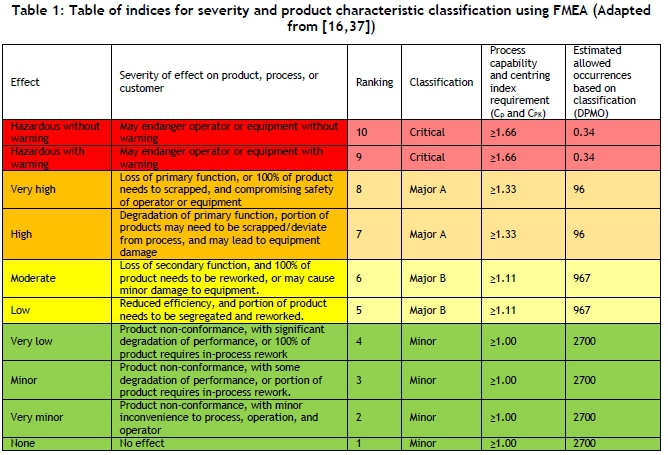
The severity ranks the impact of the failure mode on the process equipment, environment, and operator. Table 1 details the severity and the associated ranking when evaluating the effects of the process failures.
A classification is assigned, based on the severity of the cause, to identify the process controls required. The classifications used are Critical, Major A, Major B, and Minor, which are linked to process capability, as illustrated in Table 1.
The capability indices are tied to the severity of the failure mode. Table 1 contains the information used to classify the characteristics using the FMEA, which then determines the capability index. The descriptions, effect, and significance to the process of each ranking are discussed in the table and defined below, and are adapted from an internal company procedure, the literature, and the author's experience in the field of process safety management (see Table 1).
Critical
A critical defect or failure is likely to result in:
• Hazardous or unsafe conditions for individuals using, maintaining, or depending upon the product.
• Hazardous or unsafe conditions for the equipment used.
• The prevention of the performance of the tactical function of a major end item such as a ship, aircraft, tank, missile, space vehicle, communications system, land vehicle, surveillance system, or major part thereof.
Major A
A defect or failure that is likely to result in a failure of the unit or product for its intended purpose.
Major B
A defect or failure, other than Critical or Major A, that is likely to result in the reduction of the efficiency of the unit or product for its intended purpose.
Minor
A minor defect or failure that is not likely to reduce the efficiency of the unit or product for its intended purpose, although it can have negative implications for cost and schedule.
2.4.2 Occurrence
The occurrence rating ranks the frequency of the cause of the failure mode. The ranking criteria are illustrated in the table below. This is a relative ranking, and not an absolute value.

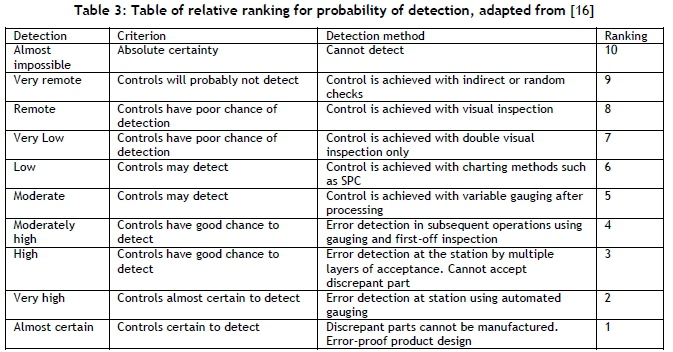
2.4.3 Detection
Detection relates the probability of detecting the cause of the failure mode to a relative ranking.
Problem-solving forms a major part of continuous improvement, as the elimination of root causes and the implementation of preventive actions greatly supports the drive for continuous improvement.
The next section will elaborate on the application of the OCAP and FMEA in a South African chemical manufacturing company.
3 CASE STUDY
3.1 Overview of the out-of-control action plan (OCAP)
The main objective of an SPC programme is the reduction of variation of an output characteristic by identifying, changing, and controlling an input variable [33]. The identification of assignable cause in an output characteristic is triggered by a control chart; however, identifying and removing the source of the assignable cause variation is achieved by supporting the SPC programme with a well-integrated and functional problem-solving methodology [38].
The out-of-control action plan (OCAP), as shown in Figure 3, was adapted from Rantamäki et al. (2013). Figure 3 illustrates the cycle for when assignable cause has been detected. The cycle loops through the detection of assignable cause variation and the sequence of how the operator should react to the identification of an assignable cause variability.
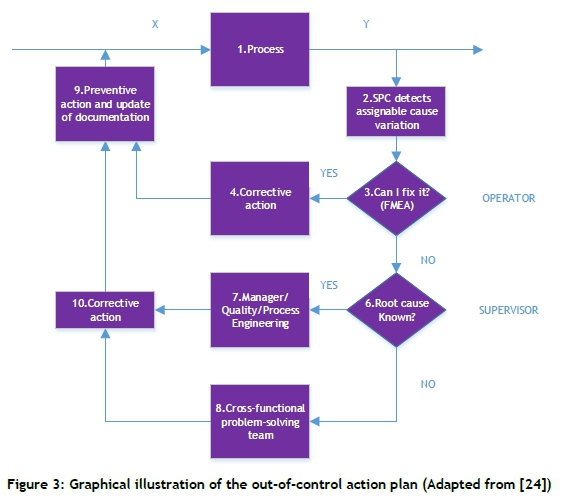
The OCAP was implemented with a pre-completed and configured FMEA as the basis of the problem-solving, as this might ensure a significant timesaving on improvement actions and problem-solving [34].
The cycle is divided into two critical sections of involvement. The first is the operator level of control. This is done to ensure that employee empowerment is integrated into the programme, as well as organisational learning. Not only will the operator be responsible for solving the problem, but the operator will also be expected to acknowledge all shortcomings of the FMEA and prompt the SPC facilitator to update the documentation to ensure that the operator is able to fulfil their duty when a similar problem occurs. The FMEA is a tool used to identify and prioritise potential causes of variation of a specific failure mode, and subsequently, to present possible corrective actions [20].
The operator is expected to:
1. Identify that assignable cause variation is present in the process.
2. Use the failure modes and effect analyses report to address the problem.
If the operator is unable to address the problem using the FMEA, the facility's management may assist with the problem-solving. The facility's management then has the option to pursue the problem themselves or to assign it to the cross-functional team to assist. This will take longer to restore the process to its normal state. The main aim should always be to ensure the safest and most effective method of addressing the issue. A key outcome is the review and update of the manufacturing instructions and standard operating procedures [25].
3.2 Monitoring and control of OCAP
The problem-solving approach uses the FMEA, which will be a working and live document that is frequently updated as new problems and solutions surface. The FMEA serves as an approach to address potential or reoccurring issues. A more in-depth problem-solving approach is the 8D methodology. One of the essential differences between the two methods is that the 8D methodology is applied when attempting to remedy faults and eliminate their causes after the non-conformance occurs, by following an in-depth problemsolving methodology [39]. In contrast, the FMEA is a proactive analysis tool that allows for the definition and identification of known potential failures and their causes [37,40]. Therefore the FMEA may contain the root cause for a possible failure, whereas the 8D will require time to evaluate possible causes.
The link between the FMEA and SPC is the monitored characteristic, also called the process failure. As mentioned, the FMEA is used to document potential process failures. Assignable cause variation, when monitoring a process, is caused by a process failure. The FMEA document will thus be composed of possible failures for characteristics monitored using SPC.
The following sequence of events is followed when monitoring processes for assignable cause variation.
3.2.1 Step 1 - Monitor process for assignable cause variation
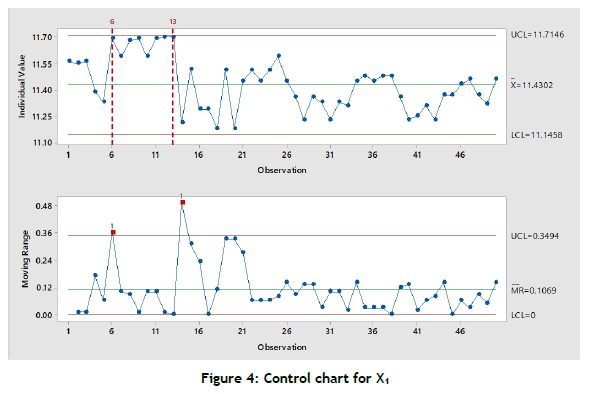
Assignable cause variation is identified by applying the out-of-control criteria discussed in Section 2.3. The below steps are the guidelines to be followed when reviewing control charts. It is essential not to make process changes to processes that are only experiencing common cause variation, as this may have a negative effect on the process and the process outputs, because unnecessary process adjustments have been made (refer back to Figure 2). The monitored characteristic is the raw material concentration, X1.
Figure 4 portrays the monitoring results for X1 plotted on a control chart. When applying the above-mentioned points, it is clear that at observation 6 the process was running out of control, as explained by rule numbers 1 and 2. The continuous process was not altered during the FMEA evaluation time, between observation 6 and 13. This triggered the out-of-control action plan, as indicated in Figure 3. Minitab® was used to generate the control charts for reporting purposes.
However, in the case study environment, the identified characteristic is inspected and recorded by an analytical chemist using an analytical instrument, and the result is stored in an Excel sheet. The data is then processed in Excel, using standard control chart formulae [41] (which can be found in Montgomery and Runger (2007)), and is presented using a dashboard reporting system and displayed on computers in the control rooms of the manufacturing facility for operators to monitor.
3.2.2 Step 2 - Immediate action using the FMEA
Upon indication of the assignable cause variation, the initial reaction to the situation will be the use of the pre-completed FMEA by the process operator. The core structure of the FMEA is presented and illustrated as a failure mode (for X1) in Table 4. Therefore the purpose of the FMEA is to be a live document in which all possible failure modes of the process can be documented. The operator will consult the FMEA in the case of a 'process failure' (the assignable cause variation), and can then implement the appropriate corrective action in an attempt to restore the process to its natural state. The custodian of the FMEA document is process engineering, with inputs from the operations department. The operator progresses through the failure modes, using the RPN number as a directive (in descending order), thus verifying the criticality of the potential causes of the failure modes based on the RPN number. The operator identifies the possible root cause of the failure mode and implements the appropriate corrective action. Upon implementation, the process is monitored for the effectiveness of the corrective action, which becomes a permanent action if the process returns to its natural operating state. The process is documented, and all relative manufacturing documentation can be updated.
If the failure mode is not documented in the FMEA, the next step will be for management to intervene. They will address the problem if the appropriate expertise is present. Otherwise, the problem can be converted to an 8D report, which is beyond the scope of this paper.
In the present case, the X1 component of the raw material has triggered the out-of-control criteria, indicating a possible problem in the process. Given that the X1 component has a causal relationship with the Y1 characteristic of the final product, the swift reaction of the operator is required to assess whether there really is a problem, to ensure that the X1 content of the batch of material does not lead to a non-conformance at final inspection. The operator consults the FMEA, checking for possible causes of failure in raw material composition (X1).
The operator reviews the operation, using the FMEA to troubleshoot the process deviation, specifically referring to the 'Possible causes' column. Using the process of elimination, guided by the RPN number, the operator inspects and evaluates the probability of each cause. Upon evaluating all the possibilities, the operator notices the increase in reaction temperature, coupled with a drop in discharge pressure. This immediately triggers the operator to alert his superior and request him to summon the maintenance department to assess the damage to the mechanical seal of the pump. A change in pressure at the mechanical seal of the pump indicates water ingress into the product line from the seal side, which then reacts with the material in the pipe, causing a neutralisation reaction, which generates heat. The water ingress decreases the concentration of component X1 in the composition of the feed to the reactor. Non-conforming raw material composition (X1 concentration) will lead to a non-conforming batch of product (Y1 characteristic), if not corrected in time. The operator contacts his colleague in the receiving building and informs him that he will be stopping the process for the pump to be inspected before they begin the next batch. As stated by Ali (1992), the application of SPC, supported by the FMEA, fosters quality material by identifying the problem in process before it severely affects the final product. Therefore the FMEA is used to diagnose the cause of a failure mode, thus preventing the potential negative consequence on Y1 by controlling X1.
3.2.3 Review documentation and process conditions
Upon completion of the problem-solving exercise, and with the process returned to its natural state, the prerogative should now be to update the manufacturing documentation to incorporate all new failure modes and actions that have been set in place, to prevent these issues form re-occurring, if necessary.
If implemented successfully with a fully functional problem-solving methodology, SPC can improve process performance. The next section evaluates the process data before and after the implementation of SPC. Notably, when implemented correctly, SPC will improve the process, thus highlighting the value of the FMEA when correctly prepared and structured, fostering effective support for the SPC programme.
3.3 Process performance
The previous section explained the potential use of the FMEA when assignable cause variation has been detected. The SPC programme was implemented as a case study, with the FMEA component used as the problem-solving methodology. SPC and the FMEA were implemented in a manufacturing process in which a mixed acid is used as a raw material. Using process prioritisation techniques, the Y1 characteristic was identified as the problematic output characteristic, with X1 highlighted as the most critical raw material component affecting the output of Y1. The next section details the effect of the SPC program on the Y1 characteristic, thus supporting the potential role that the FMEA can play in variation reduction.
3.3.1 Process stability
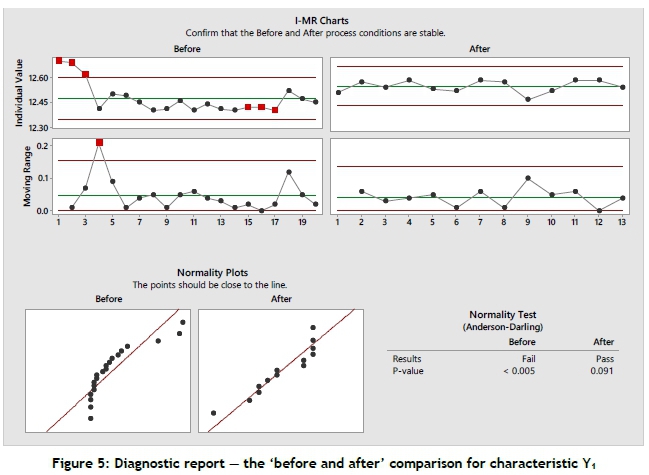
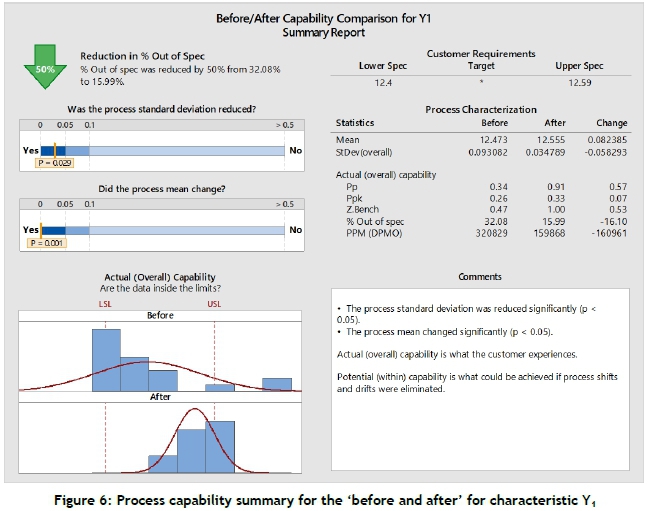
The performance of the process prior to the implementation of SPC is consistent with the assumption that the process was running on the LCL with a large natural variation. Therefore the process had a greater probability of generating defective material. An attempt was made to address the variation by implementing SPC. Evaluating Figure 5 and Figure 6, the overall standard deviation of the process was reduced from 0.093082 to 0.034789. The standard deviation for the part-to-part variation was reduced by 11.3 per cent, and the overall process variation shows a reduction of 63 per cent, thus highlighting the influence of SPC, coupled with the use of an effective problem-solving methodology, to identify and remove the sources of variation, as demonstrated in Figure 4 and Table 4.
Following the confirmation of the process stability, the process capability is evaluated.
3.3.2 Process variation
The process capability evaluation estimates how well a specific dataset fits within the required tolerance band, a method widely employed to evaluate process performance. Complementing the above I-MR chart, the diagram below highlights the stability of the process. Figure 5 indicates that the process is more stable and normally distributed following the implementation of SPC. The figure below also highlights the nonnormal distribution prior to the implementation of SPC.
Figure 6 evaluates the process performance before and after the implementation of SPC. Figure 6 illustrates the before-and-after performance, and highlights the difference in process performance between the two datasets. It should be noted that the second dataset contains 13 measurements, while the initial dataset has 20 measurements. A larger sample size can be evaluated in time. The improvement highlighted in Figure 6 is a reduction of 50 per cent (32 to 16) of out-of-specification products. This improvement is only possible with an influential and effective problem-solving methodology. SPC will only generate positive results when the cause of assignable variation is removed, which for this study was made possible using the FMEA.
The defects per million opportunities (DPMO) were also reduced by 160 961 per million opportunities. A reduction in variation and DPMO can only be achieved with the removal of the sources of variation. Control charts are used to identify the points of assignable cause variation, which were then removed using the FMEA. This is supported with p = 0.029.
4 CONCLUSION
The paper focused on the application of the failure mode and affects analysis document as a support during the problem-solving phases of SPC implementation in a South African chemical manufacturing company. The decision was made to use the current FMEAs, which were standalone documents and not used at the facility, and to apply the already defined possible causes of certain failure modes as an approach to problem-solving when implementing SPC. Section 4 validates the proposed methodology by systematically progressing through each step proposed in the out-of-control action plan, and providing detail on how to implement the FMEA. The section illustrates the practicality of the proposed methodology and, finally, displays the ability of SPC to reduce process variation when implemented correctly, using the FMEA as the problem-solving methodology. This is supported by a reduction in process variation by 63 per cent and a decrease in defects per million opportunities by 160 961 per million opportunities. Therefore the outcome supports the use of the FMEA as a simple and effective tool when implementing SPC.
REFERENCES
[1] Hung, H.C. & Sung, M.H. 2011. Applying six sigma to manufacturing processes in the food industry to reduce quality cost. Sci. Res. Essays, 6(3): 580-591. [Online]. Available from: http://www.academicjournals.org/SRE/PDF/pdf2011/4Feb/Hung_and_Sung.pdf. [ Links ]
[2] Yunus, M.F.M., Taib, C.A. & Iteng, R. 2016. A preliminary study on the application of statistical process control (SPC) towards process efficiency: Case study in food industries. Sains Humanika, 8(4-2): 25-31. [ Links ]
[3] De Toledo, J.C., Lizarelli, F.L. & Santana Jr, M.B. 2017. Success factors in the implementation of statistical process control: Action research in a chemical plant. Production, 27: 1-14. [Online]. Available from: http://www.scielo.br/scielo.php?script=sci_arttext&pid=S0103-65132017000100312&lng=en&tlng=en. [ Links ]
[4] Antony, J., Kumar, M. & Labib, A. 2008. Gearing Six Sigma into UK manufacturing SMEs: Results from a pilot study. J Oper Res. Soc. , 59(4): 482-493. [ Links ]
[5] Amasaka, K. 2013. The development of a total quality management system for transforming technology into effective management strategy. Int. J. Manag., 30(2): 610-631. [ Links ]
[6] Zhang, Y. & Yang, M. 2009. A coordinate SPC model for assuring designated fit quality via quality-oriented statistical tolerancing. Comput. Ind. Eng., 57(1): 73-79. [Online]. Available from: http://dx.doi.org/10.1016Aj.cie.2008.12.006. [ Links ]
[7] Lim, S. A. H., & Antony, J. 2013. Statistical process control implementation in the food industry: A systematic review and implications for future research. 11th Int. Conf. Manuf. Res., (September): 593-598. [ Links ]
[8] Siddiqui, Y.A., Saif, A.-W.A., Cheded, L., Elshafei, M. & Rahim, A. 2015. Integration of multivariate statistical process control and engineering process control: A novel framework. Int. J. Adv. Manuf. Technol., 78(1-4): 259268. [Online]. Available from: http://link.springer.com/10.1007/s00170-014-6641-6. [ Links ]
[9] Prabhuswamy, M.S., Nagesh, P. & Ravikumar, K.P. 2013. Statistical analysis and reliability estimation of total productive maintenance. IUP J. Oper. Manag., 12(1): 7-20. [Online]. Available from: http://search.proquest.com/docview/1321937535/fulltextPDF/D4859CFC1404C99PQ/33?accountid=38628. [ Links ]
[10] Mahanti, R. & Evans, J.R. 2012. Critical success factors for implementing statistical process control in the software industry. Benchmarking: An Int. J. 19(3): 374-394. [Online]. Available from: http://www.emeraldinsight.com /doi/10.1108/14635771211244309. [ Links ]
[11] Gerard, K., Grandhaye, J., Marchesi, V., Aletti, P., Husson, F., Noel, A., & Kafrouni, H. 2009. Feasibility study of using statistical process control to optimize quality assurance in radiotherapy. J. Qual. Maint. Eng., 15(4): 331343. [Online]. Available from: http://www.emeraldinsight.com/doi/10.1108/13552510910997715. [ Links ]
[12] Colin, J. & Vanhoucke, M. 2015. Developing a framework for statistical process control approaches in project management. Int. J. Proj. Manag. 33(6): 1289-1300. [Online]. Available from: http://dx.doi.org/10.1016/j.ijproman.2015.03.014 [ Links ]
[13] Grigg, N.P. & Walls, L. 2007. Developing statistical thinking for performance improvement in the food industry. Int. J. Qual. Reliab. Manag., 24(4): 347-369. [Online]. Available from: http://www.emeraldinsight.com/doi/10.1108/02656710710740536. [ Links ]
[14] Besseris, G.J. 2013. Robust quality controlling: SPC with box plots and runs test. The TQM Journal, 25(1): 89-102. [Online]. Available from: http://www.emeraldinsight.com/doi/10.1108/17542731311286450. [ Links ]
[15] Antony, J. & Taner, T. 2003. A conceptual framework for the effective implementation of statistical process control. Bus. Process Manag. J., 9(4): 473-489. [ Links ]
[16] Ford. 2011. Failure mode and effects analysis. 4.2. Dearborn, Michigan: Ford Motor Company. [ Links ]
[17] Does, R., Trip, A. & Schippers, W. 1997. A framework for implementation of statistical process control. Int. J. Qual. Sci., 2(3): 181-198. [Online]. Available from: http://www.emeraldinsight.com/journals.htm?articleid=843623&show=abstractLinks ] Arial, Helvetica, sans-serif" size="2">.
[18] Ali, S.W. 1992. Statistical process control for total quality. Johns Hopkins APL Tech. Dig., 13(2): 317-325. [ Links ]
[19] Yeh, T.M. & Sun, J.J. 2013. Using the Monte Carlo simulation methods in gauge repeatability and reproducibility of measurement system analysis. J. Appl. Res. Technol., 11(5): 780-796. [Online]. Available from: http://dx.doi.org/10.1016/S1665-6423(13)71585-2. [ Links ]
[20] Montgomery, D.C. 2009. Introduction to statistical quality control, 6th ed. Jefferson City: John Wiley & Sons, Inc. [Online]. Available from: http://scholar.google.com/scholar?hl=en&btnG=Search&q=intitle:Introduction+to+Statistical+Quality+Control#0. [ Links ]
[21] Beckford, J. 2001. Quality: A critical introduction. New York: Routledge. [ Links ]
[22] Woodall, W. & Montgomery, D. 1999. Research issues and ideas in statistical process control. J. Qual. Technol. 31(4): 376-386. [Online]. Available from: https://secure.asq.org/perl/msg.pl?prvurl=/data/subscriptions/jqt_open/1999/oct/jqtv31i4woodall.pdf. [ Links ]
[23] Skulj, G., Vrabic, R., Butala, P. & Sluga, A. 2013. Statistical process control as a service: An industrial case study. Procedia CIRP, 7: 401 -406. [ Links ]
[24] Rantamäki, J., Tiainen, E.L. & Kässi, T. 2013. A case of implementing SPC in a pulp mill. Int. J. Lean Six Sigma, 4(3): 321-337. [ Links ]
[25] Carter, D.W. 1993. Effective implementation of SPC in wide area manufacturing systems (A case study). Comp. Euro. Proc. Comput. Des. Manuf. Prod., 132-138. [Online]. Available from: http://ieeexplore.ieee.org/document/289811/. [ Links ]
[26] Sharma, R. & Kharub, M. 2014. Attaining competitive positioning through SPC - an experimental investigation from SME. Meas. Bus. Excell., 18(4): 86-103. [Online]. Available from: http://www.emeraldinsight.com/doi/10.1108/MBE-10-2013-0050. [ Links ]
[27] Goh, T.N. & Xie, M. 2003. Statistical control of a Six Sigma process. Qual. Eng., 15(4): 587-592. [ Links ]
[28] Duffuaa, S.O., Khursheed, S.N. & Noman, S.M. 2004. Integrating statistical process control, engineering process control and Taguchi's quality engineering. Int. J. Prod. Res., 42(19): 4109-4118. [ Links ]
[29] Gejdos, P. 2015. Continuous quality improvement by statistical process control. Procedia Econ. Financ., 34(15): 565-572. [Online]. Available from: http://linkinghub.elsevier.com/retrieve/pii/S221256711501669X. [ Links ]
[30] Chen, P.W. & Cheng, C.S. 2011. On statistical design of the cumulative quantity control chart for monitoring high yield processes. Commun. Stat. - Theory Methods, 40(11): 1911-1928. [ Links ]
[31] MacGregor, J.F. & Kourti, T. 1995. Statistical process control of multivariate processes. Control Eng. Pract., 3(3): 403-414. [ Links ]
[32] Lim, S. A. H., Antony, J., Garza-Reyes, J.A. & Arshed, N. 2015. Towards a conceptual roadmap for statistical process control implementation in the food industry. Trends Food Sci. Technol., 44(1): 117-129. [Online]. Available from: http://dx.doi.org/10.1016Aj.tifs.2015.03.002. [ Links ]
[33] Noskievicová, D. 2010. Effective implementation of statistical process control. In: Dudas, L. (ed.), Engineering the future.ISBN: 978-953-307-210-4, InTech, p. 311-328. [Online]. Available from: http://www.intechopen.com/books/engineering-the-future/effective-implementation-of-statistical-processcontrol. [ Links ]
[34] Ben Romdhane, T., Badreddine, A. & Sansa, M. 2017. A new model to implement Six Sigma in small- and medium-sized enterprises. Int. J. Prod. Res., 55(15): 4319-4340. [Online]. Available from: http://dx.doi.org/10.1080/00207543.2016.1249430. [ Links ]
[35] USA Department of Defense (DOD). 1980. MIL-STD-1629 procedures for performing a failure mode, effects and criticality analysis. Washington: Department of Defense USA. [ Links ]
[36] Pyzdek, T. & Keller, P. 2010. The Six Sigma handbook. New York: McGraw-Hill. [ Links ]
[37] Kulkarni, P.V. & Shrivastava, P.R.K. 2013. Failure mode effect analysis: Process capability enhancement - A case study. Int. J. Eng. Res. Technol., 2(4): 1859-1868. [ Links ]
[38] Lim, S. A. H., Antony, J., Arshed, N. & Albliwi, S. 2015. A systematic review of statistical process control implementation in the food manufacturing industry. Total Qual. Manag. Bus. Excell., 28(1-2): 176-189. [Online]. Available from: https://www.tandfonline.com/doi/full/10.1080/14783363.2015.1050181. [ Links ]
[39] Kumar, T.S.M. & Adaveesh, B. 2017. Application of "8D methodology" for the root cause analysis and reduction of valve spring rejection in a valve spring manufacturing company: A case study. Indian J. Sci. Technol., 10(11): 1-11. [ Links ]
[40] Alexa, V. & Kiss, I. 2018. Complaint analysis using 8D method within the companies in the field of automotive. Analecta Tech. Szeged., 10(1): 16-21. [ Links ]
[41] Montgomery, D.C. & Runger, G.C. 2007. Applied statistics and probability for engineers, 4th ed. Jefferson City: John Wiley & Sons. [ Links ]
Submitted by authors 3 Dec 2019
Accepted for publication 16 April 2020
Available online 29 May 2020
# Author was enrolled for an MEng (Engineering Management) degree in the Department of Industrial Engineering, Stellenbosch University, South Africa
* Corresponding author: smatope@sun.ac.za

