


Services on Demand
Article
 English (pdf)
 Article in xml format
 Article references
Indicators

Related links
-
 Cited by Google
 -
 Similars in Google
Share

 Permalink
South African Journal of Industrial Engineering
On-line version ISSN 2224-7890
Print version ISSN 1012-277X
S. Afr. J. Ind. Eng. vol.31 n.1 Pretoria May. 2020
http://dx.doi.org/10.7166/31-1-2184
CASE STUDIES
Hybrid manufacturing framework to improve small to medium-sized manufacturers' flexibility to market turbulence in a multi-product environment: case study of a manual assembly line
T.A. Mukalay*
Department of Industrial Engineering, Tshwane University of Technology, Pretoria, South Africa
ABSTRACT
Market flexibility can be described as the ability to react competently to customers' fluctuating demands. This ability has become critical to the survival of small to medium-sized enterprises. This study aimed at improving small to medium-sized manufacturers' flexibility. The framework proposed in this paper has a mixed make-to-order and make-to-stock strategy, supported by a manual assembly line setup based on workers' movements at its core. The hybrid system designed through this study allows small to medium-sized manufacturers to improve their responsiveness to the current dynamically changing market environment, and to stay competitive by providing them with the tools for fast customer response and financial expansion.
OPSOMMING
Markbuigsaamheid kan beskryf word as die vermoë om op 'n bekwame wyse te reageer op kliënte se wisselende behoeftes. Hierdie vermoë is krities vir die oorlewing van klein- tot mediumgrootte ondernemings. Hierdie studie poog om klein- tot mediumgrootte vervaardigers se markbuigsaamheid te verbeter. Die voorgestelde raamwerk bestaan uit 'n gemengde maak-vir-bestelling en maak-vir-voorraad strategie wat ondersteun word deur ' handmonteerlyn wat op werker bewegings gebaseer is. Die hibriede stelsel laat klein- en mediumgrootte vervaardigers toe om hulle reaksie op huidige, dinamiese markomgewings te verbeter en sodoende kompeterendte bly.
1 INTRODUCTION
In the current multi-product environment, small to medium-sized manufacturers (SMMS) experience mounting challenges due to robust competition from larger manufacturers, emerging technologies, and high product specifications from customers. Customers request an extensive variety of high-quality products, with new models regularly introduced at affordable prices. This leads more manufacturers to implement make-to-order (MTO) as their manufacturing strategy [1].
MTO is a manufacturing approach that provides manufacturers with the ability to be flexible towards market trends, deliver products according to customers' specifications, maintain low inventory costs as production planning focuses on order execution, and reduce the risk of obsolete stock. However, product availability, longer delivery lead times, and high product prices remain the main drawbacks [2]; [3].
The paradigm shift from a supplier-centred environment to a customer-centred one causes manufacturers to be faced with a wide range of product demand and volatile order volumes. The lack of flexibility of SMMs towards market turbulence can have detrimental effects, such as delays in delivery, destabilisation of the equilibrium supply chain, and loss of markets to larger or better resourced manufacturers [4]; [5]; [6]; [7]; 8]; [9]; [10]. Therefore, we address the following research question: How can SMMs improve their flexibility in a dynamically changing market in a multi-product environment?. This question is broken down into three sub-questions:
• How to classify products to determine an effective product delivery strategy (PDS).
• How to mitigate the high cost of multi-product manufacturing.
• How to measure the performance of as-is and proposed manufacturing configurations.
This study presents an innovative approach to improve SMMs using a manual assembly line system's flexibility towards market change. The aim of this work is to define a hybrid manufacturing strategy that will combine the advantages of make-to-order and make-to-stock manufacturing systems coupled with a flexible manual assembly line setup. This will allow SMMs to achieve benefits such as mass production efficiency, high-level responsiveness, and customer satisfaction. This innovative approach was developed following a hierarchical framework of three steps: determining a product delivery strategy (PDS) in MTO or MTS through the Olhager model; re-configuring a manual assembly line system based on an operator's movement; and developing discrete event simulation (DES) models of as-is and proposed manufacturing systems in Arena. Each step provided an answer to a research sub-question formulated above. The hypothesis of this research is that this study will provide a conceptual framework that will improve SMMs' flexibility to market turbulence in a multi-product environment.
2 LITERATURE
The literature in this study has been divided into four segments: turbulent environment, flexible manufacturing system, concept strategies, and proposed strategy.
2.1 Turbulent environment
Advances in production techniques have brought about a massive amount of change in the world, and the business environment was not spared. Wadhwa [11] stated that companies are compelled to become flexible by changes in the conditions in which they operate. These changes are driven by variations in order volume and product specifications in internal activities, and changes and ambiguity in the environment. This dynamism is influenced by the nature of the current market; customers' requirements are individualistic and inconsistent, and this creates a turbulent market environment. For Brown and Eisenhardt [12], this type of environmental setting is described as one that is exposed to incessant and considerable variations that are not predictable and are difficult to understand.
2.2 Flexible manufacturing system (FMS)
Spena et al. [13] defined FMS as a manufacturing system that can be adjusted within a given flexibility corridor. Therefore, 'flexibility' describes the ability of a manufacturing setup to adjust quickly to encountered variations with as little cost and interruption in production as possible, due to setting up between systems. The distinct types of flexibility to be exhibited in a FMS are: machine, production, batch/mix, product, routing, volume, expansion/development, operation, and processing machine flexibility [14].
2.3 Concept strategies
Automation and smart manufacturing (SM) have recently emerged as solutions to manufacturing companies' environment flexibility issues.
2.3.1 Developing countries' SMMs and automation
Lourens and Jonker [15] stated that the level of automation a company implements is directly proportional to the level of profit it will achieve. They suggested that SMMs must aim to compete at a high level of reliability, quality, and design diversity. The assumption that acquiring and implementing technology might provide businesses with a greater competitive advantage underlies these propositions. Studies conducted by Da Costa and De Lima [16], Lui and Barrar [17], and Small [18] are mostly relevant in the context of developing a technology approach for SMEs.
Production technologies can allow small businesses to supply the mass market, mix batches, and customise products to facilitate a diversity strategy and lower costs simultaneously. However, Aboelmaged [10] contradicted Lourens and Jonker's [15] theory, saying, "the significance of technology drivers was not confirmed in SMEs". This is certainly due to the fact that, in developing countries, SMEs lack technical capacity.
2.3.2 Developing countries' SMMs and smart manufacturing
Helu et al. [19] defined smart manufacturing as a production environment combining high-level manufacturing capability and alphanumerical technology at each product life cycle stage. However, the pertinent question is: Would developing countries' SMMs afford the cost of acquiring, installing, and maintaining these systems? Affordability would be the main characteristic, specifically for investment capital. In 2012, it was reported that, across the US, the UK, France, Germany, Sweden, China, and India, 76 per cent of manufacturing firms have a smart factory plan that is underway, or they are developing plans for one; and over 50 per cent of manufacturing firms (56%) have invested R1, 230.00 million or more towards smart factories. This type of intensive capital investment is not available to SMEs in developing countries [20].
2.4 Proposed strategy
The literature fueling this study's proposed strategy is reviewed. Spath et al. [21] pointed out that an efficient FMS must satisfy market requirements, prevent excessive investment in the long run, and offer enough flexibility to meet customers' requirements in times of uncertainty.
2.4.1 Response strategy
Kurtz, Menezes and Rados [6] stated that businesses require resources, operations, and a framework that allows strategic flexibility and a system for businesses to capture opportunities and support detection. As the market changes, SMMs' business strategy must also evolve. Spena et al. [13] stated that there is no well-known methodological approach to enable SMEs to cope with market turbulence and to meet the unknown; manufacturing systems have to be designed to fulfil peak performance and offer a high degree of flexibility. Saniuk and Waszkowski [9] support Spena et al. 's views, stating that manufacturing companies need tools that assist in providing a quick response to market. This tool or strategy must allow both product customisation and a high production volume.
Kaminsky and Kaya [5] showed, through computational analysis, that high manufacturing flexibility and efficiency can be achieved by using a combination of MTO and MTS strategies, rather than one system over the other. Rabbani and Rafiei [22] substantiated Kaminsky and Kaya's [5] view, stating that, in today's competitive and unpredictable market involving high-level customisation, in a manufacturing context the mixed MTO/MTS system is the ideal one to stay competitive. A mixed MTO/MTS system combines the advantages of both pure MTO and MTS, while eliminating their individual drawbacks [23] (see Table 1).

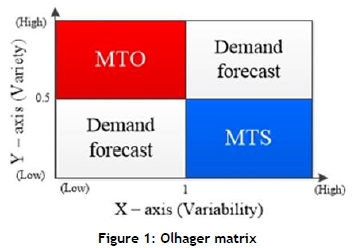
However, for many researchers, when implementing a mixed MTO/MTS system, the predicament arises from the choice of the technique to determine PDS [24]. The potential manufacturing solution lies with striving for a manufacturing setup that can adapt and operate within an agile and dynamic environment [8]. This study made use of a more dynamic concept that was developed by Jan Olhager in 2003, referred to as the 'Olhager model', to determine PDS [25]. This model allows for the determination of PDS in a dynamic environment through a four-celled matrix that shows the pattern-specific products that will follow (see Figure 1).
2.4.2 Manufacturing floor setup
In designing a manufacturing floor setup to support a mixed MTO/MTS system for SMMs in developing countries, the resources constraint (capital, equipment, labour, etc.) must be considered; consequently, the design should be based on the ability of labour to carry out various tasks. Wang, Owen and Mileham [26] pointed out that there are two types of production line(s) configurations based on workers' movement:
• The linear fixed-worker (FW), or traditional production line, has one or more workers positioned at a specific workstation to complete a task and, when it is completed, the part moves to the next station.
• The walking workers (WW) production line system, where workers are cross-trained to perform all line activities from start to finish; they accomplish this by walking with the part along the assembly line.
An FW line system allows limited flexibility (product design), and requires a constant flow of orders, which makes it suitable for an MTS strategy. On the other hand, a WW line system struggles to sustain a high production capacity. However, it allows high level flexibility (product design), and the adaptability in the number of workers satisfies the line throughput requirements, which makes it suitable for an MTO strategy [27]. From the above literature, it has been shown that the ideal manufacturing strategy for SMMs to be successful is a mixed MTO/MTS system.
Furthermore, to achieve manufacturing flexibility, the manufacturing strategy and the floor setup must be compatible [28]. Therefore there is a need to provide the mixed MTO/MTS system with a manufacturing floor setup based on workers' movements, integrating both FW and WW line systems (see Figure 2. The WW line system has been validated using Al-Zuheri's [29] WW line validation model, which considers variabilities in operating time, workers' skills levels, and the fatigue factor.

3 MATERIALS
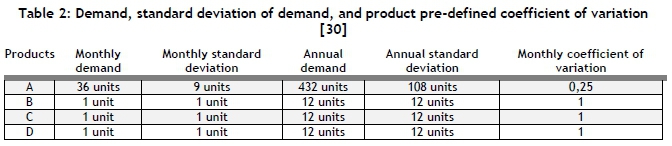
The data to be used in this study are secondary manufacturing data used in the second case study in the paper of Prakash and Chin [30], 'Comparison between production controls in multi-stage multi-product manufacturing environments: Two case studies'. This case study [30] provides an expensive way of testing this work's hypotheses, as it describes a job shop environment that manufactures composite sub-assemblies following an assembly line setup. This manufacturing environment falls under SMMs categories, as its production output ranges between 1 and 10 000 units per year [31]. Prakash and Chin's case study [30] provides the necessary data, such as a description of the manufacturing processes, the sequence of operations, the product range, the monthly demand, the demand standard deviation, the coefficient of variation, and the production cycle times for an effective assessment of the proposed hypotheses.
3.1 Secondary data
3.1.1 Data set presentation
Table 2 provides a summary of the data extracted from the case study.
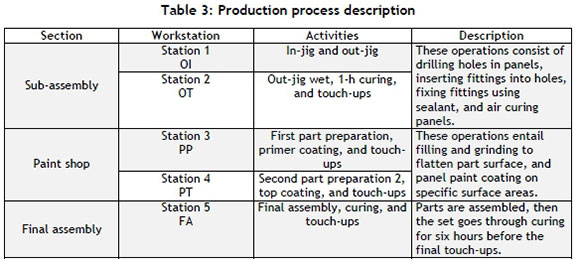
3.1.2 Production process description
Table 3 summarises the production processes that start with the sub-assembly section, are followed by the paint shop, and end in the final assembly section.
3.1.3 Data shortcomings
From the set of data extracted, the following shortcomings of the ongoing study have been observed:
• Number of operators per workstation and on the additional production line(s)
• Available production hours
• Distance between workstations
• Operation cycle times
• Worker's walking speed
• Manufacturing floor surface grade ratio
• Cash flow - receipts and payments
As a response to these limitations, assumptions have been made about the listed system elements.
3.2 Study assumptions
a. Number of operators: It has been assumed that there is one operator per station in the current system, and one additional operator will be assigned to the WW MTO line(s).
b. Production hours available: The experiment has been designed for a monthly production time window of 276 available hours. It has been assumed that the factory runs for 16 hours per day (double shift), five days per week, with a total lost time of 44 hours.
c. Part travelling distance: It has been assumed that there is a distance of two meters between stations of the same section (e.g., OI - OT). There is a distance of four meters between the last workstation in the preceding section and the following station in the next section (e.g., OT - PP).
d. Cycle times: It has been assumed that an operation's cycle times follow a triangular distribution to reflect the minimum value, which refers to the least time the operator can take to complete the task. The mean value refers to the most likely time the operator can take to complete the task, and the maximum value refers to the longest time the operator can take to complete the task (see Table 4).

e. Worker's walking speed: It has been assumed that the workforce in this manufacturing system is under 50 years old and is a mixture of males and females. It has been assumed that 1.4 m/s is a worker's standards walking speed, in order to accommodate female workers [32].
f. Manufacturing floor surface grade ratio: It has been assumed that the working surface is at a 90° angle super flat - with tolerances for concrete surfaces [33].
g. Cash flow - receipts and payments: Assumptions about the amount of money being transferred into the business through sales (receipts) and out through expenses (payments) of the business have been made, and are limited to the elements below:
• All products are sold for R3,000.00
• Operator's hourly rate is R80.00
• A workstation (machine, equipment, etc.) amounts to R4,000.00 and has to be paid off over a period of 12 months.
4 METHODOLOGY
The methodology is divided into three sections. Each section addresses a research sub-question.
4.1 Determining PDS in MTO or MTS through the Olhager model
4.1.1 Data description
Data to be collected from the case study are: demand volume, product range, customer's desired lead time, and production lead time.
4.1.2 Data analysis
The main factors affecting the strategic planning of product delivery strategy (PDS) are the production (P) and delivery (D) lead times' ratio (P/D), and the coefficient of variation (C). The P/D ratio and C vary from low to high; and by juxtaposing them in a diagram, four basic scenarios can be identified. Thus these two factors lead to four combinations of different properties for selecting a PDS (see Figure 1 again).
4.1.3 Practicality of the Olhager model
Products are plotted in the matrix according to the x,y coordinates:
• Y or coefficient of variation (the relative volatile demand) represents the ratio of o (standard deviation) over u (demand mean).
• X is the PLT ratio (manufacturing lead time) over C (customers' ideal delivery time).
In the Olhager model, the results are interpreted as follows:
• Low coefficient of variation (CV) or CV <0.5 correlates to high demand
• High CV or CV >0.5 correlates to low demand.
In the Olhager model (see Figure 1), the top left cell corresponds with MTO. It extends from 0.5 on the Y-axis and from 0 to 1 on the X-axis. Items whose coordinates are plotted in the top left cell as a result of the calculations (Equations 3-1 to 3-3) will be manufactured under the MTO class. The bottom right cell corresponds with MTS. It extends from 0 to 0.5 on the Y-axis, and from 1 on the X-axis. Items whose coordinates are plotted in this cell as a result of the calculations will be manufactured under the MTS class. However, items that fall in the bottom left cell (from 0 to 0.5 on the Y-axis and 0 to 1 on the X-axis) and the top right cell (from 0.5 on the Y-axis and from 1 on the X-axis) will have their demand forecasted (following equations 3-1 to 3-3), and are dealt with according to the trend their forecasted demand presents.
Equations:
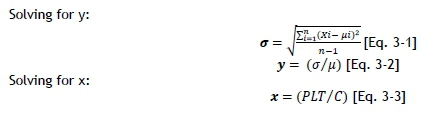
where n: size of population sample, Xi: value in sample, μi: individual demand mean, and μ: annual demand mean.
4.2 Re-configuring manual assembly line(s) system based on operator's movement
4.2.1 Data description
Data to be gathered from the case study are: floor process map, desired output, cycle time per element, overall cycle time, and number of stations per production line.
4.2.2 Facility planning and design
In this section, the number of production lines and the floor setup necessary to support a system that manufactures both MTO and MTS products will be determined.
Equations:
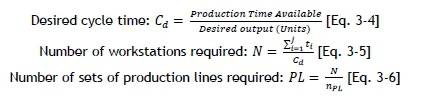
where Cd: desired cycle time, N: theoretical minimum number of workstations, ti: completion time for element i, j: number of work elements, PL: number of production lines, nPL: number of stations per production line, Ca: actual cycle time, and n: actual number of workstations.
4.2.3 Manual assembly line(s) configuration based on operator's movement
This floor setup will integrate both the FW and the WW line systems, as shown in Figure 2.
4.2.4 Mathematical model validation
a. Fixed workers (FW)/MTS line system assumptions: It has been assumed that one worker is required per workstation. It will also be assumed that the working speed and skills level of all workers on MTS line(s) are equal.
b. Walking workers (WW)/MTO line model validation: The configuration of the WW line will be determined through Al-Zuheri's mathematical validation model [29].
Equations:
Amount of operating time during given cycle n is:

where tokm: operation time of worker m to perform manual task at workstation K (sec), EK: average working time needed by worker to complete task at workstation K, VK: variance of completing task at workstation K, μ: average level of worker skill, and σ: worker skill level standard deviation.
Overall walking time Wc (n), during given cycle n is:

where Wc (n): overall walking time during given cycle n, g: walking surface grade (%), tkWm: worker m walking time from workstation K to workstation K + 1 - K* to 1,if K = Kn, (xK,yK): worker position at workstation K, (xK+1,yK+1): worker position at workstation K + l, and V0: worker walking speed (meters/sec).
Overall cycle time Tca(n) that walking worker m spends to assemble one product is given by:
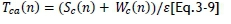
where £ is the penalty function added to the overall cycle time to reflect the effect of fatigue on worker's performance. £ is a constant, and is equal to 0.97 [29].
4.3 Discrete event simulation (DES) modelling of as-is and proposed systems in Arena simulation software
4.3.1 DES modelling approach
A systematic approach of six steps is followed to develop DES models:
Step 1 - Identify the scope and assumptions
a. Scope: DES models to be designed are to represent the functioning of as-is and the proposed manufacturing systems developed from extracted and assumptions data.
b. Assumptions: The following assumptions have been made for the modelling constraints:
• Modelling constraint - It has been assumed that products are processed through the system according to their assigned level of priority (attributes), and a machine setup time of 0.25 hours is required at the beginning of each shift.
• Run setup - Number of replications: 1, warm-up period: 0.0, replication length: 276 hours (which represents the monthly production time available), and hours per day: 24 hours (standard setting in Arena).
Step 2 - Define objectives of simulation
From as-is and the proposed system, four objectives will be defined:
• To develop as-is system
• To develop the proposed system
• To assess as-is and proposed system's performance
• To quantify proposed system's impact on company performance.
Step 3 - Determine modelling elements
Before developing the simulation model, the following elements will be identified:
• Entities represent objects flowing through the system - Products A, B, C, and D.
• Variables represents some system characteristics - queuing priority.
It has been assumed that the models operate under a queue priority system component. Under the as-is system, product A has priority over the remaining set, with an attribute value set at 4; product B has priority over products C and D with an attribute value set at 3; product C has priority over product D with a set attribute value of 2; and finally, product D has a set attribute value of 1. The queue priority was regulated through the set-data module as type: highest attribute value, and name: attribute 2, which refers to product A's attribute value.
Under the proposed system, it has been assumed that the MTO line operates with a queue priority component. Product B has priority over products C and D with an attribute value set at 3; product C has priority over product D with a set attribute value of 2; and finally, product D has a set attribute value of 1. The queue priority was regulated through the set-data module as type: highest attribute value, and name: attribute 3, which refers to product B's attribute value.
For both systems, it has been assumed that the time between product arrival is set as follows: type of distribution is set as random (expo), and the time value between product arrival into the system is set at 0 hours, since it has been assumed that the parts to be assembled are in the inventory.
• Resource represents the system assets, such as machines, labour, etc.
The process logic followed is set as: action: seize, delay, release, as the product that arrives waits until a worker is free, it will seize the worker, wait for the process to be completed, and then release the worker. The process' operating time is set as: delay type: constant, allocation: value added (as this process adds value to the nature of the product), and triangular distribution hours as the time values (see Table 4 for process' cycle times).
Step 4 - Determine modelling constraints
The factors affecting the system will also be identified, for instance:
• Process times - see Table 3
• Cleaning (cleaned in place/CIPs) - proportion of lost time
• Changeovers (change of hardware pieces on equipment) - proportion of lost time
Step 5 - Input simulation data
The input data will be at three levels:
• Product (quantity) - see Table 2
• Process' description - see Table 3
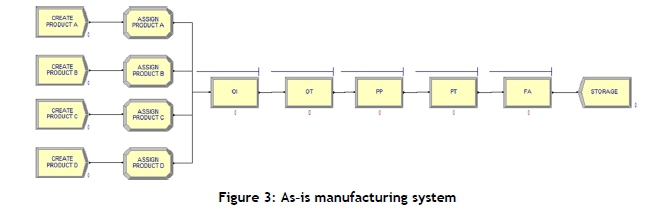
The current manufacturing system represents a multi-product single-lined manufacturing system, as displayed in Figure 3.
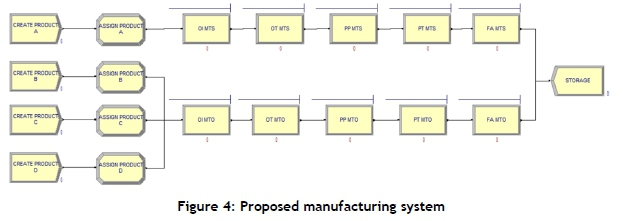
The model developed represents a multi-production line manufacturing system as displayed in Figure 4.
• System requirements
One hundred replicates of both systems were run following a stochastic model to try to mimic real-life working conditions, and to substantiate the results obtained.
Step 6 - Define key performance parameters
To assess the impact of the designed approach, key performance parameters will be defined at three levels (see Table 3.3):
a. Project level - system cost: A cost benefit analysis (monetary unit) of the status quo (as-is system) and the proposed system will be conducted to assess both systems' profitability for the business.
b. Process level: At this level, three parameters will be assessed:
• Efficiency: Comparing how long it actually takes to achieve the targeted output under the current system with how long it takes to achieve the same results under the proposed system in the same production available time. Actual production times are collected from simulation data.

• Throughput: This refers to the production output of the system, expressed in finished manufactured units, for the simulation time period.
• Resources utilisation: This represents the proportion of the available time (expressed as a percentage) for which an operator, a piece of equipment, or a system is operating.
c. Operations level: At the lowest level of performance assessment, cycle time, queuing, and work in process will be assessed.
• Actual production time: This refers to the time it takes a system to achieve the targeted output.
• Queuing time: This refers to the period a part spends in line before being processed.
• Work in progress: This refers to semi-finished goods waiting for completion.
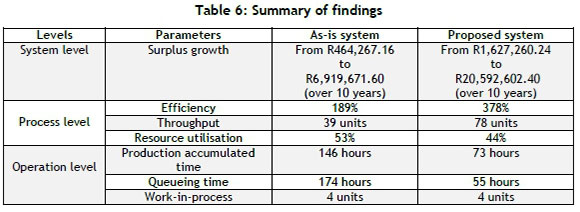
5 SUMMARY OF FINDINGS
5.1 Research findings
5.1.1 How to classify products to determine an effective product delivery strategy.
Under the hybrid manufacturing system defined in this study, product A is to be produced to stock, and products B, C, and D are to be manufactured to order, as a result of the equations 3-1 to 3-3 computation.
5.1.2 How to mitigate the high cost of multi-product manufacturing.
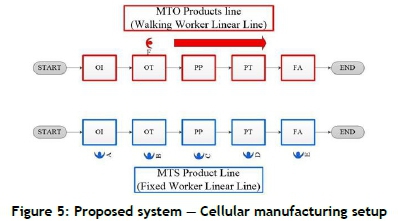
To allow SMMs to match mass production efficiency, be responsive to market change, and achieve high levels of customer satisfaction, the manual assembly lines are to be set as shown in Table 5. Figure 5 displays the proposed system cellular manufacturing setup.

5.1.3 How to measure the performance of as-is and proposed manufacturing configurations.
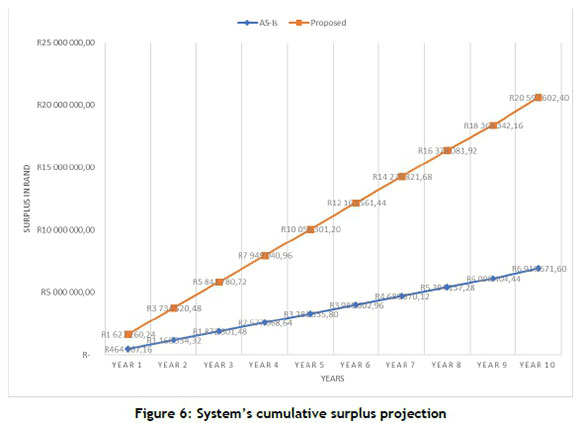
It can be concluded that the designed hybrid system has a faster surplus growing rate than the current manufacturing system, based on payment and receipt values - see Figure 6.
5.2 Conclusion
Through this project, a manufacturing setting combining MTO and MTS systems, supported by a flexible manual assembly line setup, was developed. The hybrid manufacturing system development followed a hierarchical framework comprising three steps: product classification, facility planning, and design and hypothesis testing (discrete event simulation). Therefore, to fulfil this study's purpose, the findings obtained are outlined in order to answer the three research sub-questions.
The first step in achieving the study's aim was to determine the product delivery strategy to classify the manufactured parts in either MTO or MTD class through the Olhager model. This Olhager model determines the PDS in a dynamic environment through a four-celled matrix that shows the pattern that specific products will follow.
The second step in achieving this study's aim was to re-configure a manual assembly line setup based on an operator's movement. This will mitigate the long production lead time, and high manufacturing, inventory, and investment costs. It was determined that a single set of production lines was required in the proposed system (one MTO and one MTS assembly line). The MTS line was set up as an FW linear line, and the MTO line was set up as a WW linear line.
The last step in achieving this study's aim was to test the formulated hypotheses by developing DES models of both systems in Arena simulation software to test their respective performances based on three levels; operation, process, and project levels.
Through discrete event simulation modelling and cost projection, the hybrid manufacturing system's high flexibility and cost effectiveness have thus been demonstrated. This system aimed at improving SMMs, which are using a manual assembly line(s) system to respond to the current dynamically changing market environment and overall performance. It will enable SMMs to stay competitive by providing them with the tools for fast customer response and financial expansion. This study will assist in designing and applying demand-profile systems in the manufacturing sector.
5.3 Limitations
This research's limitation lies in its research strategy of being a 'case study'. Although case studies examine the present real world, they are criticised because they lack weight as a research instrument, compared with field experiments [34].
The second limitation of this work lies in the applicability of the proposed system, as it can only be implemented in an environment where customer demand is growing dynamically. In an environment with dwindling customer demand, it will become too costly to be implemented due to the costs of hiring an additional worker(s), training worker(s) for walking, and setting up initial stations for the new line(s) to be added to the existing system.
5.4 Further work
The following topics have been identified as potential future work avenues:
a. Risk management: Assessment of the risks involved in developing and implementing the defined hybrid strategy (closer look at equipment, safety, etc.).
b. Hybrid services: Developing a hybrid system for service-based companies to improve their flexibility towards market change.
c. Customer co-design tool: Developing a customer co-design or process integration tool that allows the customer to be part of the manufacturing process, and improves communication between the market and the supplier.
REFERENCES
[1] Saniuk, A. & Waszkowski, R. 2016. Make-to-order manufacturing - new approach to management of manufacturing processes. IOP Conference Series: Materials Science and Engineering, 196(1), pp. 8-9. [ Links ]
[2] Christopher, M. & Towill, D. 2001. An integrated model for the design of agile supply chain. International Journal of Physical Distribution and Logistics Management, 31(1), pp. 235-246. [ Links ]
[3] Tse, T. & Soufani, K. 2012. Manufacturing strategies for small and medium in the new economy. Journal of Small Business and Enterprise Development, 8(1), pp. 219-220. [ Links ]
[4] Chang, S., Yang, C., Cheng, H. & Sheu, C. 2003. Manufacturing flexibility and business strategy: An empirical study of small and medium sized firms. Int. J. Production Economics, 83(4), pp. 13-26. [ Links ]
[5] Kaminsky, P.M. & Kaya, O. 2006. MTO-MTS production systems in supply chains. NSF Design, Service, and Manufacturing Grantees and Research Conference, 36(1), pp. 30-34. [ Links ]
[6] Kurtz, D.J., Menezes, L.M. & Rados, G.L.V. 2012. Turbulent environments and SMEs: How to survive in an unpredictable world? International Business Review, 83(4), pp. 278-292. [ Links ]
[7] Jonker, J.A. & Lourens, A.S. 2013. An integrated approach for developing a technology strategy framework for small- to medium-sized furniture manufacturers to improve competitiveness. South African Journal of Industrial Engineering, 24(1), pp. 50-67. [ Links ]
[8] Radziwon et al. 2015. Exploring manufacturing solutions for SMEs. Industrial Marketing Management, 43(2), pp. 630-641. [ Links ]
[9] Aboelmaged, M. 2017. The drivers of sustainable manufacturing practices in Egyptian SMEs and their impact on competitive capabilities: A PLS-SEM model. Journal of Cleaner Production, 175(12), pp. 207-221. [ Links ]
[10] Wadhwa, R.S. 2012. Flexibility in manufacturing automation: A living lab case study of Norwegian metal casting SMEs. Journal of Manufacturing Systems, 31(1), pp. 444- 454. [ Links ]
[11] Brown, S. & Eisenhardt, K.M. 1997. The art of continuous change: Linking complexity and time-paced evolution in relentlessly shifting organizations. Administrative Science Quarterly, 42(3), pp. 1-34. [ Links ]
[12] Spena, P.R., Holzner, P., Rauch, E., Vidoni, R. & Matt, D.T. 2016. Requirements for the design of flexible and changeable manufacturing and assembly systems: A SME-survey. Procedia Engineering, 41(1), pp. 207-212. [ Links ]
[13] Kapitanov, A.V. 2017. Manufacturing system flexibility control. Procedia Engineering Elsevier LTD, 10(1), pp. 14701475. [ Links ]
[14] Da Costa, G.S.E. & De Lima, E.P. 2009. Advanced manufacturing technology adoption: An integrated approach. Journal of Manufacturing Technology Management, 20(1), pp. 1-10. [ Links ]
[15] Lui, H. & Barrar, P. 2009. Performance implications of strategy-technology connections: An empirical examination. Journal of Manufacturing Technology Management, 20(1), pp. 52-73. [ Links ]
[16] Small, M.H. 2007. Planning, justifying and installing advanced manufacturing technology: A managerial framework. Journal of Manufacturing Technology Management, 18(1), pp. 513-537. [ Links ]
[17] Helu, M., Morris, K., Jung, K., Lyons, K. & Leong, S. 2015. Identifying performance assurance challenges for smart manufacturing, PMC, 6(1), pp. 1-4 [ Links ]
[18] Wang, L. & Shih, A.J. 2016. Challenges in smart manufacturing. Challenges in Smart Manufacturing, 40(1), p. 1. [ Links ]
[19] Spath, D., Gerlach, S., Scholtz, O., Hämmerle, M. & Krause, T. 2012. Early alert cockpits for changeable manufacturing systems, Springer, 12(1), pp. 68-73. [ Links ]
[20] Rafiei, H. & Rabbani, M. 2014. Aggregate production planning with stochastic demands in MTS/MTO environments. Semantic scholar, 5(1), pp 37-39. [ Links ]
[21] Köber, J. & Heinecke, G. 2012. Hybrid production strategy between make-to-order and make-to-stock: A case study at a manufacturer of agricultural machinery with volatile and seasonal demand. Research gate, 17 (6), pp. 453-458. [ Links ]
[22] Heinecke, G., Syntetos, A.A. & Wang, W. 2011. Forecasting-based SKU classification. International Journal of Production Economics, 12(1), pp. 235-236. [ Links ]
[23] Olhager, J. 2003. Strategic positioning of the order penetration point. International Journal of Production Economics, 10(1), pp. 19-329. [ Links ]
[24] Wang, Q., Owen, G.W. & Mileham, A.R. 2005. Comparison between fixed- and walking-worker assembly lines. Proceedings of the institution of Mechanical Engineers, 3(8), pp. 845-848. [ Links ]
[25] Wang, Q., Lassalle, S., Milehama, A.R. & Owen, G.W. 2009. Analysis of a linear walking worker line using a combination of computer simulation and mathematical modeling approaches. Proceedings of the Institution of Mechanical Engineers, 28(12), pp 64-70. [ Links ]
[26] Al-zuheri, A. 2013. Modelling and optimization of walking worker assembly line for productivity and ergonomics improvement. Research gate, 26(1), pp. 68-255. [ Links ]
[27] Prakash, J. & Chin, J.F. 2014. Comparison between production controls in multistage multi-product manufacturing environments: Two case studies. Taylor & Francis Group, 2(1), pp. 490-496. [ Links ]
[28] Groover, M.P. 2008. Automation, production systems, and computer-integrated manufacturing, 3rd edition. Prentice Hall, West-Lafayette. [ Links ]
[29] Fujiyama, T. & Tyler, N. 2015. Predicting the walking speed of pedestrians on stairs. London: Research Gate. Available online: https://www.researchgate.net/publication/32885782_Pedestrian_speeds_on_stairs_an_initial_step_for_a_simulation_model [ Links ]
[30] Tolerances for Concrete Surfaces. 2005, CCAA, 5(1), pp. 3-5. Available online: https://www.ccaa.com.au/imis_prod/documents/DATA_SHEET_TOLERANCE_FOR_CONCRETE_SURFACES.pdf [ Links ]
[31] Zainal, Z. 2007. Case study as a research method. Journal Kemanusiaan, 9(1), pp. 1-6. [ Links ]
Submitted by authors 24 Jul 2019
Accepted for publication 4 Nov 2019
Available online 29 May 2020
* Corresponding author: thie7ry@gmail.com

