


Services on Demand
Article
 English (pdf)
 Article in xml format
 Article references
Indicators

Related links
-
 Cited by Google
 -
 Similars in Google
Share

 Permalink
South African Journal of Industrial Engineering
On-line version ISSN 2224-7890
Print version ISSN 1012-277X
S. Afr. J. Ind. Eng. vol.31 n.1 Pretoria May. 2020
http://dx.doi.org/10.7166/31-1-2150
CASE STUDIES
Evaluating healthcare performance using fuzzy logic
M.S. KhanI, *; M.A.A.MansourII, III; S.D.A. KhadarII; Z. MallickII
ISchool of Mechanical Engineering, KIIT University, India
IIDepartment of Industrial Engineering, King Khalid University, Saudi Arabia
IIIIndustrial Engineering Department, Zagazig University, Egypt
ABSTRACT
The basic determining elements of healthcare services are the patient's satisfaction with the service provided by hospitals, which includes behavioural and sentimental aspects and the quality and efficiency of the hospitals themselves. Patients are sometimes very confused, and so express their views very vaguely. These imprecise responses of patients add to the complexity of evaluating quality. The involvement of multiple criteria, uncertainty, and qualitative factors significantly complicates the evaluation of the quality of a healthcare service. Fuzzy logic is a method by which indistinct or hazy responses can be taken up for quality analysis, such as the prioritisation of hospitals, departments, dimensions, etc. A pilot study was carried out in this study comprising 18 private hospitals with more than 100 beds that were selected in the twin city of Bhubaneswar and Cuttack in the state of Odisha, India. Nine quality dimensions were also selected from those used in the literature. A questionnaire survey was conducted in different departments of the hospitals using the nine dimensions. Patients' responses on a five-point Likert scale were first analysed statistically. Then ranking the dimensions and the hospitals was carried out using fuzzy analysis. The results could be used by healthcare service providers continually to improve their organisation.
OPSOMMING
Die kern bepalende elemente van gesondheidsorgdienste is die pasiënt se bevrediging met die hospitaal se dienslewering. Dit sluit gedrag- en sentimentele aspekte en die gehalte en doeltreffendheid van die hospitale in. Pasiënte is soms verward en hulle menings is dikwels baie vaag. Die vae response van pasiënte dra by tot die kompleksiteit van gehalte assessering. Deur veelvuldige kriteria, onsekerheid, en kwalitatiewe faktore in te sluit maak die evaluasie van 'n gesondheidsorgverskaffer nog moeiliker. Vae response kan egter deur die wasigheidsleer gebruik word vir gehalte analise, soos om hospitale, departemente ensovoorts aan die hand van gehalte te evalueer. 'n Proefstudie is op agtien hospitale met meer as 100 beddens van stapel gestuur in 'n stad in Indië. Nege gehalte dimensies is gekies vanuit dié wat in die literatuur voorkom. 'n Meningspeiling is gebruik in verskillende afdelings van die hospitale aan die hand van die nege gehalte dimensies. Pasiënte se response op 'n vyf-punt Likert-skaal is aanvanklik statisties ontleed. Die rang van die hospitale is dan met 'n wasige analise bepaal. Hierdie resultate kan gebruik word deur gesondheidsorg diensverskaffers om hulle organisasie deurlopend te verbeter.
1 INTRODUCTION
A wide range of fundamental research studies on service quality have been carried out globally in the last two decades. Many authors have tried to define general service quality and its dimensions. Parasuraman et al. [1] indicated that the assessment of service quality is more difficult than that for the quality of goods because it is the result of a comparison of actual feelings - i.e., perception and expectation. Thus expectations can be seen as relating to the expected future performance of a product or service, whereas perceived service quality is the performance of the service as presently perceived by the customers. Service quality is also simultaneously affected by service output and service process. And sometimes is it difficult for customers to describe clearly the quality of the service they have received [1, 2].
A number of studies have been conducted to evaluate service quality in various fields, including retail [3], public agencies [4], banking [5], web services [6], airlines and airports [7,8], hotels [9], traffic and transportation [10], and supermarkets [11]. The quality of health service has also been studied extensively in various journals [12, 13]. Generally, healthcare service is associated with the emotions of the customer and with the nature of the service provided. So fulfilling the needs of patients and assessing the quality of the service provided to them have become critical challenges for hospital administrators [14].
The critical nature of a healthcare service can be attributed to its characteristics of direct contact with people, frequent communication with them, and providing customised and professional medical services. These include having the right equipment at the right time, along with an acceptable standard of medical care [15]. Other issues that are also related to hospital service quality include the patient admission and discharge processes, nursing, physicians, meals, rooms, technicians, visitor services, and the environment [16]. The quality of a hospital's service is also dependent on many aspects of patient behaviour. It is also associated with the patients' feelings, because poor service given to a patient may end in the loss of life. Further, the expectations of customers, especially in the healthcare industry, are constantly rising [17]. One of the key requirements of the customer in a healthcare service is the need to select the appropriate services from among the range of services available [18]. On the other hand, providers of a healthcare service require a better understanding of the weaker areas in their unit for the continuous improvement of the healthcare industry - and to stay in the market [18]. Therefore it is necessary to pay constant attention to the study of healthcare service quality. Prioritising healthcare items is one of the more widely used methods to evaluate service quality. Thus hospitals are now giving more attention to improving the quality and efficiency of their healthcare in order to retain their existing customers (patients) and to attract new ones [19].
The main objective of this paper is to prioritise the various hospitals and dimensions in order to offer some suggestions to the mangers of healthcare services for ways to improve continuously.
2 HEALTHCARE SERVICE QUALITY: A CRITICAL APPRAISAL OF THE LITERATURE
The quality of service in healthcare has been studied extensively in various respects in the literature [12, 13]. A study in Bangladesh compared private and public hospitals in urban areas, using a questionnaire survey with 24 questions in five dimensions. The comparison was made using multivariate and univariate ANOVA [20]. In Turkey, a similar study was carried out to examine the concept and the factors of health service quality for continuous quality improvement. A fuzzy AHP hybrid method was used to rank four hospitals using 19 criteria in six dimensions [21].
Akdaga et al. [22] applied multiple criteria decision-making (MCDM) to evaluate the service quality of some Turkish hospitals. They used triangular fuzzy numbers to represent the service performance measurement of the health service. The MCDM, TOPSIS, and Yager's min-max approaches were used to rank the hospitals. Finally, a comparison of all the methods used was presented. Similarly, a multilevel fuzzy model was suggested to evaluate a community health service by using five perspectives and the fuzzy comprehensive evaluation method [23].
Zarei et al. [24] proposed different dimensions of health service quality in the private hospitals of Iran from the patients' perspective by considering 21 items in five service quality dimensions. Statistical methods were used to compare the patients' perceptions and expectations.
Chang, [25] proposed a framework based on the concept of fuzzy sets theory and the VIKOR method to provide a rational, scientific, and systematic process for evaluating hospital service quality in a fuzzy environment.
Lin et al. [26] explored the use of a management tool such as the balanced scorecard (BSC) for managers to meet multiple strategic goals, and the fuzzy linguistic method to evaluate operation room performance.
Lorin et al. [27] examined the application of the original SERVQUAL scale in the context of public healthcare service in Romania. The validity and reliability of the SERVQUAL scale was assessed with Cronbach's alpha. In a recent study, a multiple-item scale known as 'M-S-QUAL' was designed to measure health service quality in the mobile environment, which included the essential characteristics of healthcare service such as conceptualising, constructing, refining, and testing [28].
A hybrid multi-criteria technique was used in another study that combined fuzzy AHP and fuzzy TOPSIS to evaluate a set of alternative hospital websites in order to identify the best alternative to satisfy the expectations of the customers [28]. Chang & Chang, [29] proposed a conceptual framework to identify the key drivers and offer guidance for enhancing dental care service quality. In this study, a questionnaire survey was also used, followed by a statistical analysis, in order to measure patients' satisfaction, based on demographic variables. Granja et al. [30] suggested new management strategies in order to minimise how long patients remain on waiting lists while reducing the costs and increasing (or at least maintaining) the quality of care. A simulation-based optimisation approach to the patient admission scheduling problem was also presented.
Mansour and Tahir [31] evaluated the patients' level of satisfaction in an ENT hospital. One-way ANOVA and an independent sample t-test were applied to check the differences in the levels of satisfaction. Rodrigo-Rincon et al. [32] investigated the quality perception gaps between employees and outpatients in a nuclear medicine department (NMD). An investigation was also carried out into the quality maintained by healthcare providers in Nigeria [33]. In another study, based on the quality of multiple measures of healthcare providers, the efficiencies of using data envelopment analysis (dEA) were identified [34].
Thadani [35] gave an overview of the public private partnership (P-P-P) model in the health sector at a global level with the help of some examples. In the Italian healthcare system, a study was carried out to show the possible relationship between public and private partners and outsourcing the selected healthcare service [36]. Langviniené [37] described changing patterns in the health tourism sector in the Republic of Lithuania from 2008 to 2012, comparing them with the changes in general tourism.
3 METHODOLOGY
3.1 Fuzzy logic
Fuzzy logic is a class of logic in which the truth values of variables may be any real number between 0 and 1. It is an advanced version of Boolean logic, in which the truth values of variables are regarded as either true (denoted '1') or false (denoted '0'). Fuzzy logic has been extended to manage the concept of partial truth, in which the truth value may range between completely true and completely false. Moreover, when linguistic variables are used, these degrees may be managed by specific functions known as membership functions. Zadeh [38] first proposed fuzzy set theory in 1965, and it has since been applied in many fields. Some of the reasons that fuzzy logic is widely used are summarised below.
Fuzzy logic is flexible in nature and conceptually easy to understand, as the mathematical concepts behind fuzzy reasoning are very simple. In general, the inspection data are not perfectL they always contain some anomalies. Fuzzy logic is highly tolerant of imprecise data, and builds an understanding into the process rather than producing an error at the end. One of the biggest advantages of fuzzy logic is that it can be combined with other techniques, such as the artificial neural network (ANN) in the form of neuro-fuzzy, and the analytical hierarchy process (AHP) in the form of fuzzy-AHP, and simplifies their implementation in many cases. Fuzzy logic is based on natural language, much as in human communication. In most cases, people are unable to describe their perceptions and expectations precisely: they always express these in descriptive terms that cannot be regarded as completely true or completely false, but rather occupy a band of values between the two extremes. Thus fuzzy logic is built over the structures of qualitative description that are used in everyday language. The healthcare service is a sector in which fuzzy logic can be effectively applied to evaluate its quality.
3.2 Prioritisation of healthcare dimensions (criteria)
The healthcare service is generally regarded as a multi-criteria service sector. Therefore the important criteria need to be prioritised in order to target the weaker criteria and subsequent improvement strategy in the quality of the healthcare service. To this end, a systematic methodology has been applied to prioritise the dimensions of healthcare to improve the quality of the service.
3.3 Design of questionnaire
The questionnaire was designed after an exhaustive review of 45 journals, mostly published from 2010 to 2015, related to healthcare industries. Different papers considered different dimensions or criteria according to their need for an analysis and improvement of health service quality.
Twenty-three dimensions or criteria were selected on the basis of their frequent occurrence in those studies. Of these dimensions, nine were seen to occur most frequently in the literature: responsiveness, assurance, tangibility, empathy, reliability, professionalism, communication, sanitation, and hospital equipment. 'Responsiveness' relates to the health provider's ability to respond to the genuine expectations of the customers (both patients and caregivers) and to enhance the aspects of care. 'Assurance' gives a sense of confidence to the patients and to their caregivers. Patient-staff interaction, the attitude of staff, and the environment are some of the factors responsible for enhancing the confidence levels and hope of the customers that they will receive the best care in the healthcare service. Similarly, 'tangible' relates to the actual experience of care from the health providers, which increases patients' levels of satisfaction. As a result, the customer's 'word of mouth' promotes the better service provided by a particular healthcare unit. The term 'empathy' is used to describe the ability to sense other people's emotions, coupled with the ability to imagine what someone else might be thinking or feeling. As it is associated with the customers' emotions, it is very difficult to measure. 'Reliability' in the health sector mostly indicates the service provided to customers in relation to how they are treated and the equipment required for the treatment; whereas 'professionalism' in a healthcare unit integrates several elements, such as competence in specialised knowledge, the skill of the doctors and paramedical staff, having staff who are trained to discharge their stated responsibilities, and the presence of strict rules, policies, and guidelines in the healthcare unit. 'Communication' in the health sector refers to the interaction between staff and patient, the level of which is one of the major dimensions of quality improvement in the health sector. It includes the behavioural aspects of the staff, doctors, patients, and caregivers. 'Sanitation' relates to the cleanliness and hygiene of all the stakeholders in the healthcare unit, and of the surrounding environment. Proper cleanliness and sanitation bring recognition to a hospital, and ultimately improves the quality of a unit. The 'hospital equipment' used in the process of providing a health service should be in good condition. Regular upgrades to this equipment must be carried out in order to keep up with the changing scenario of medical technologies. State-of-the-art equipment should also be procured to improve the reliability of the health service.
3.4 A pilot study
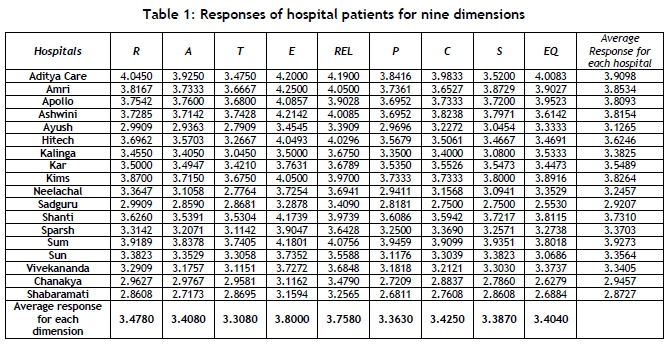
The survey was conducted in the four months from October 2015 to January 2016. It was decided to conduct the survey in the city of Cuttack and Bhubaneswar, a twin city in Odisha, India. The hospitals selected for this survey were eighteen multi-speciality private hospitals with 100 or more beds. The survey are was conducted in different departments of each hospital, such as medicine, surgery, and orthopaedics. A total of 641 patients in the various hospitals were asked to give their responses. A five-point Likert scale was used to collect the responses.
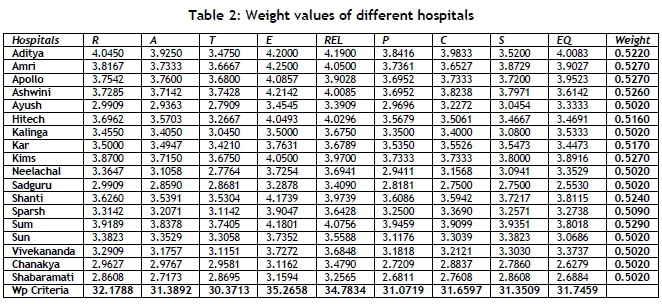
From the data collected on each hospital, each dimension was gathered separately and the response averages calculated. The average responses for all the hospitals and for all dimensions are presented in Table 2. Then the average responses of the patients in the different hospitals for responsiveness (R), assurance (A), tangible (T), empathy (E), reliability (Rel), professionalism (P), communication (C), sanitation (S), and hospital equipment (EQ) were analysed to yield better insight into the distribution of the dimensions among the various hospitals.
The responses presented in Table 1 were used to prioritise the dimensions using the fuzzy logic method. The patients' responses were measured on a five-point Likert scale that showed the satisfaction level of the respondents, with '1' representing 'totally dissatisfied' (D) and '5' representing 'totally satisfied' (TS). The intermediate ranges were 2, 3, and 4. All of the criteria to be prioritised were allocated a fraction of the total assigned weight of 1.0. These weights were calculated using the fuzzy rules described in the sections that follow. Equation 1 was used to calculate the weighted prioritisation (WP) factor for every criterion..

where 'PF value' represents 'probability factor value' - i.e., the average value of the response of the patients shown in Table 1; while 'PF weight' represents 'probability factor weight', on which the weighted prioritisation (WP) is dependent. The PF weight for every response was calculated using the fuzzy tool in MATLAB R2013a.
3.5 Methodology for fuzzy design
The responses from the patients were used as the input data for defining five levels of membership function in this fuzzy analysis process. The levels were: 1. Totally dissatisfied (D); 2. Somewhat satisfied (SS); 3. More-or-less satisfied (MS); 4. Satisfied (S); and 5. Totally satisfied (TS).The output value was considered according to the three levels of membership functions - dissatisfied, moderately satisfied, and satisfied - discussed earlier. The input membership functions were used to represent the fuzzy sets in order to design the fuzzy inference system.
3.5.1 Fuzzy inference system
A fuzzy inference system is the mapping of inputs and outputs. Here, the inputs were the nine dimensions, and the output was the weightage of each input. The Mamdani fuzzy inference system was used in this study, as it is widely used and easy to interpret.
3.5.2 Membership function
As discussed earlier, the input data was the average responses for the nine dimensions as assigned to the five levels of membership function. For the output, three levels of membership function (dissatisfied, moderately satisfied, and satisfied) were used. A Gaussian membership function was used for both inputs and outputs. From using these membership functions, various rules were derived, and executed using the fuzzy tool box in order to get the output.
3.5.3 Decision-making rules
A total of 543 rules were derived and executed for the sake of convenience. Some of the rules are shown below. The weightage shown in the rules indicates the output value (dissatisfied, moderately satisfied, or satisfied. However, the value mentioned against each rule indicates the weight of the corresponding rule, ranging from 0 to 1. Here '1' represents 'totally true' and '0' represents 'totally false'. The weightage values between 0 and 1 indicated in some rules were to avoid a crispness in decision-making.
Some of the rules are given below.
1. If (R is D) and (A is D) and (T is D) and (E is D) and (REL is D) and (P is D) and (C is D) and (S is D) and (EQ is D) then (WEIGHTAGE is Dissatisfied) (1)
2. If (R is D) and (A is D) and (T is D) and (E is D) and (REL is D) and (P is D) and (C is D) and (S is D) and (EQ is SS) then (WEIGHTAGE is Dissatisfied) (0.9)
3. If (R is D) and (A is D) and (T is D) and (E is D) and (REL is D) and (P is SS) and (C is SS) and (S is SS) and (EQ is SS) then (WEIGHTAGE is Dissatisfied) (0.6)
4. If (R is S) and (A is S) and (T is TS) and (E is TS) and (REL is TS) and (P is TS) and (C is TS) and (S is TS) (EQ is TS) then (WEIGHTAGE is satisfied) (0.8)
3.6 Defuzzification
The defuzzified value was obtained from the rule viewer present in the fuzzy tool box of MATLAB. This value was the required weight for a particular hospital, which was obtained from the average response for each dimension provided as input. Here the output value was the maximum of the aggregate value of each output of the rules - i.e., one rule provided one value for the inputs, and the maximum among the values provided by the rules was the output. The evaluation of the weightage of the hospitals was accomplished in two steps.
Step 1
Each rule was represented graphically in the rule viewer. The input values (average responses of dimensions for each hospital) were entered manually into the graphs of the rule viewer. A projection of the input values under the AND function was carried out, and the minimum value of that projection was taken as the output value of the individual rule. Here the 'AND' function was used to obtain the common minimum value of the inputs.
Step 2
The output values of each rule were combined graphically in an aggregation process that was available in the fuzzy tool box. From that graph, using the centroid method, a maximum value was obtained as the final output of the given input - i.e., the weight of each hospital.
In this way the weights for the different hospitals were obtained from the fuzzy rules, and the weighted priority (Wp) value was calculated by applying the formula in Equation 1, and that in turn produced the order of priority of the different dimensions (Table 5.1).
Here the weights were calculated for each hospital by applying the values for each dimension as input to the fuzzy rules.
For example:
The weight for Aditya Care Hospital was obtained after applying [4.045, 3.925, 3.475, 4.2, 4.19, 3.841667, 3.983333, 3.52, 4.008333] as input. Similarly, the weights of the other seventeen hospitals were calculated, from which the WP factor for each dimension was estimated.
Next, the WP factor of each dimension was calculated by using equation 1
For example:
the WP for responsiveness (R) = (4.045x0.522)+(3.816667x0.527)+
(3.754286x0.527)+(3.728571x0.526)+(2.990909x0.502)+(3.696296x0.516)+(3.455x0.502)+(3.5x0.517)+(3.87 x0.527)+(3.364706x0.502)+(2.990909x0.502)+(3.626087x0.524)+(3.314286x0.509)+(3.918919x0.529)+(3.38 2353x0.502)+(3.290909x0.502)+(2.962791x0.502)+(2.86087x0.502) = 32.17886.
Similarly, the WPs for the other dimensions were calculated and arranged in order of priority, as shown in Table 3. It is clear that 'empathy' scored the highest in the responses of the patients in all of the hospitals, followed by 'reliability' and 'responsiveness'. The other six dimensions demonstrated almost equal responses from the patients.

4 PRIORITISATION OF HOSPITALS
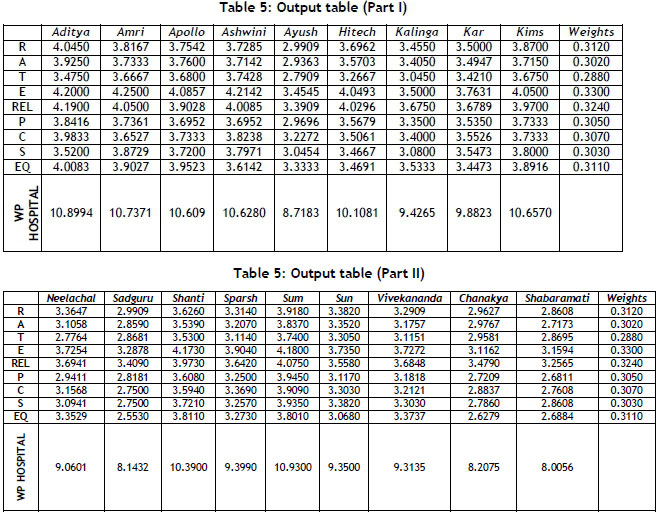
To rank the various hospitals, the same inputs as shown in Table 1 were used; but to calculate the fuzzy logic, the hospitals were arranged in rows and the nine dimensions were arranged in columns (Table 4, Parts I & II).
The weights for each dimension could be calculated by using equation 1, the weighted prioritisation value (WP) for each hospital. But before that, a fuzzy inference system had to be developed, as discussed earlier. Here also the value of the input data was set at five levels of membership function, and the output was set at three levels of membership function. The same process was used to rank the different hospitals. For convenience, the average responses of the patients rather than the different dimensions were used as inputs, and the 695 rules, based on the patients' level of satisfaction with the hospitals, were formed. Some of the rules are cited below:
1. If (Aditya is D) and (AMRI is D) and (Apollo is D) and (Ashwini is D) and (Ayush is D) and (Hi-tech is D) and (Kalinga is D) and (Kar is D) and (KIMS is D) and (Neelachal is D) and (Sadguru is D) and (Shanti is D) and (Sparsh is D) and (SUM is D) and (Sun is D) and (Vivekananda is D) and (Chanakya is D) and (Shabaramati is D) then (WEIGHTAGE is Dissatisfied) (1)
2. If (Aditya is D) and (AMRI is D) and (Apollo is D) and (Ashwini is D) and (Ayush is D) and (Hi-tech is D) and (Kalinga is D) and (Kar is D) and (KIMS is D) and (Neelachal is D) and (Sadguru is D) and (Shanti is D) and (Sparsh is D) and (SUM is D) and (Sun is D) and (Vivekananda is SS) and (Chanakya is SS) and (Shabaramati is SS) then (WEIGHTAGE is Dissatisfied) (0.7)
3. If (Aditya is SS) and (AMRI is SS) and (Apollo is SS) and (Ashwini is SS) and (Ayush is SS) and (Hi-tech is SS) and (Kalinga is SS) and (Kar is SS) and (KIMS is MS) and (Neelachal is MS) and (Sadguru is SS) and (Shanti is SS) and (Sparsh is SS) and (SUM is SS) and (Sun is SS) and (Vivekananda is SS) and (Chanakya is SS) and (Shabaramati is SS) then (WEIGHTAGE is moderately satisfied) (0.9)
The weights of the different dimensions were obtained from the fuzzy rules, as shown in Table 5 (Part I and Part II), and the WP was calculated from equation 1, which in turn indicated the prioritisation order of the different hospitals (Table 6). It is evident from the results that the SUM Hospital scored the highest response, followed by Aditya Care and the AMRI Hospital; the Shabaramati Hospital scored the lowest response value from the patients' ratings. Again, it can be presumed from the results that the patients rated these hospitals in three categories. The top eight hospitals had higher WP values, whereas the last four hospitals had lower WP values. The middle-ranked hospitals scored moderate-value priority weights.

5 CONCLUSION
A questionnaire survey was conducted in various 100-bed hospitals in the twin city of Cuttack and Bhubaneswar of the state of Odisha, India. Altogether 641 responses were collected and analysed.
The healthcare service sector is usually a very complicated one, and so the evaluation of the quality of healthcare services in any form is difficult. Fuzzy logic has been applied in this study, therefore, to address these complex situations. With the survey data, two categories of investigation were carried out using the fuzzy logic methodology - that is, ranking various dimensions and the hospitals themselves. It was established from the results that the dimension 'empathy' and the SUM Hospital gained the highest scores in the responses of the patients from all of the hospitals, whereas the dimension 'tangible' and the Shabaramati Hospital received the lowest scores according to the patients' rating.
The results of this study could help the healthcare industry in two ways. First, these results could be helpful in choosing a better healthcare service from the range of options. Second, hospital managers could identify areas of weakness and address them in the process of the continuous improvement of their organisation. This study could be extended by including more hospitals and a larger number of responses from patients in other cities, states, or countries. The study could also be carried out to identify the best department from among the different hospitals, both to help potential customers to make the right choice and to assist managers in their continuous improvement of the quality of their healthcare service.
REFERENCES
[1] Parasuraman, A., Zeithaml, V. A. & Berry, L.L. 1985. A conceptual model of service quality and its implication for future research. Journal of Marketing, 49, pp. 41-50. [ Links ]
[2] Parasuraman, A., Zeithaml, V.A. & Berry, L.L. 1988. SERVQUAL: A multiple-item scale for measuring customer perceptions of service quality. Journal of Retailing, 64(1), pp. 12-40. [ Links ]
[3] Vazquez, R., Rodriguez-Del Bosque, I.A., Ma Díaz, A. & Ruiz, A.N.V. 2001. Service quality in supermarket retailing: Identifying critical service experiences. Journal of Retailing Consumer Service, 8(1), pp. 1-14. [ Links ]
[4] Gowan, M., Seymour, J., Ibarreche, S. & Lackey, C. 2001. Service quality in a public agency: Same expectations but different perceptions by employees, managers, and customers. Journal of Quality Management, 6(2), pp. 275291. [ Links ]
[5] Karatepe, O.M., Yavas, U. & Babakus, E. 2005. Measuring service quality of banks: Scale development and validation. Journal of Retailing Consumer Service, 12(5), pp. 373-383. [ Links ]
[6] Hu, Y.C. 2009. Fuzzy multiple-criteria decision making in the determination of critical criteria for assessing service quality of travel websites. Expert Systems with Applications, 36(3), Part 2, pp. 6439-6445. [ Links ]
[7] Kuo, M.S. 2001. A novel interval-valued fuzzy MCDM method for improving airlines' service quality in Chinese cross-strait airlines. Logistic and Transport Review, 47(6), pp. 1177-1193. [ Links ]
[8] Kuo, M.S. & Liang, G.S. 2011. Combining VIKOR with GRA techniques to evaluate service quality of airports under fuzzy environment. Expert Systems with Applications, 38(3), pp. 1304-1312. [ Links ]
[9] Benitez, J.M., Martin, J.C. & Roman, C. 2007. Using fuzzy number for measuring quality of service in the hotel industry. Tourism Management, 28(2), pp. 544-555. [ Links ]
[10] Awasthi, A., Chauhan, S.S., Omrani, H. & Panahi, A. 2011. A hybrid approach based on SERVQUAL and fuzzy TOPSIS for evaluating transportation service quality. Computer and Industrial Engineering, 61(3), pp. 637-646. [ Links ]
[11] Lin, H.T. 2010. Fuzzy application in service quality analysis: An empirical study. Expert Systems with Applications, 37(1), pp. 517-526. [ Links ]
[12] Buyukozkan, G., Cifci, G. & Guleryuz, S. 2011. Strategic analysis of healthcare service quality using fuzzy AHP methodology. Expert Systems with Applications, 38(8), pp. 9407-9424. [ Links ]
[13] Leonard, K.L. & Masatu, M.C. 2005. The use of direct clinician observation and vignettes for health services quality evaluation in developing countries. Social Science and Medicine, 61(9), pp. 1944-1951. [ Links ]
[14] Teng, C.I., Ing, C.K. & Chang, H.Y. 2007. Development of service quality scale for surgical hospitalization. Journal of the Formosan Medical Association, 106(6), pp. 475-484. [ Links ]
[15] Shieh, J.I., Wu, H.H. & Huang, K.K. 2010. A DEMATEL method in identifying key success factors of hospital service quality. Knowledge Based Systems, 23(3), pp. 277-282. [ Links ]
[16] Chou, D.C. & Chou, A.Y. 2002. Healthcare information portal: A web technology for the healthcare community. Technology in Society, 24(3), pp. 317-330. [ Links ]
[17] Lateef, F. 2011. Patient expectations and the paradigm shift of care in emergency medicine. Journal of Emergencies, Trauma and Shock, 4(2), pp.163-167. [ Links ]
[18] Freshworks Inc. n.d. Importance of great customer service in healthcare and how to provide it. Online at: https://freshdesk.com/help-desk-software/healthcare-customer-service-blog/ [ Links ]
[19] Chang, S.J., Hsiao, H.C. & Huang, L.H. 2011. Taiwan quality indicator project and hospital productivity growth. Omega, 39(1), pp. 14-22. [ Links ]
[20] Andaleeb, S.S. 2000. Service quality in public and private hospitals in urban Bangladesh: A comparative study. Health Policy, 53, pp. 25-37. [ Links ]
[21] Büyüközkan, G., Çifçi, G. & Güleryüz, S. 2011. Strategic analysis of healthcare service quality using Fuzzy AHP methodology. Expert Systems with Applications, 38, pp. 9407-9424. [ Links ]
[22] Akdag, H., Kalayci, T., Karagöz, S., Zülfikar, H. & Giz. D. 2014. The evaluation of hospital service quality by fuzzy MCDM. Applied Soft Computing, 23, pp. 239-248. [ Links ]
[23] Ma, Z. & Zhu, Y. 2012. A tentative study on the evaluation of community health service quality. Physics Procedia, 24, pp. 1628-1634. [ Links ]
[24] Zarei, A., Arab, M., Froushani, A.R., Rashidian, A. & Tabatabaei, S.M.G. 2012. Service quality of private hospitals: The Iranian patients' perspective. BMC Health Services Research, 12, 31, https://doi.org/10.1186/1472-6963-12-31. [ Links ]
[25] Chang, T.-H. 2014. Fuzzy VIKOR method: A case study of the hospital service evaluation in Taiwan. Information Sciences, 271, pp. 196-212. [ Links ]
[26] Lin, Q.L., Liu, L., Liu, H.-C. & Wang, D.-J. 2013. Integrating hierarchical balanced scorecard with fuzzy linguistic for evaluating operating room performance in hospitals. Expert Systems with Applications, 40, pp. 1917-1924. [ Links ]
[27] Huang, E.Y., Lin, S.W. & Fan, Y.-C. 2015. M-S-QUAL: Mobile service quality measurement. Electronic Commerce Research and Applications, 14, pp. 126-142. [ Links ]
[28] Büyüközkan, G. & Çifçi, G. 2012. A combined fuzzy AHP and fuzzy TOPSIS based strategic analysis of electronic service quality in healthcare industry. Expert Systems with Applications, 39, pp. 2341 -2354. [ Links ]
[29] Chang, W.-J. & Chang, Y.-H. 2013. Patient satisfaction analysis: Identifying key drivers and enhancing service quality of dental care. Journal of Dental Sciences, 8, pp. 239-247. [ Links ]
[30] Granja, C., Almada Lobo, B. & Janela, F. 2014. An optimization based on simulation approach to the patient admission scheduling problem using a linear programing algorithm. Journal of Biomedical Informatics, 52, pp. 427437. [ Links ]
[31] Alturki, M. & Khan, T.M. 2013. A study investigating the level of satisfaction with the health services provided by the pharmacist at ENT hospital, Eastern Region Alahsah, Kingdom of Saudi Arabia. Saudi Pharmaceutical Journal, 21, pp. 255-260. [ Links ]
[32] Rodrigo-Rincon, I., Gohi-Girones, E. & Serra-Arbeloa, P. 2015. Discrepancies on quality perceived by the patients versus professionals on the quality of a nuclear medicine department. Revista Espanola de Medicina Nuclear e Imagen Molecular, 34(2), pp. 102-106. [ Links ]
[33] Osaro, E. & Charles, A.T. 2014. Harmony in health sector: A requirement for effective healthcare delivery in Nigeria. Asian Pacific Journal of Tropical Medicine, 7(1), pp. S1-S5. [ Links ]
[34] Mitropoulos, P., Mitropoulos, I. & Giannikos, I. 2013. Combining DEA with location analysis for the effective consolidation of services in the health sector. Computers & Operations Research, 40, pp. 2241-2250. [ Links ]
[35] Thadani, K.B. 2014. Public private partnership in the health sector: Boon or bane. Procedia - Social and Behavioral Sciences, 157, pp. 307-316. [ Links ]
[36] Mariani, P., Falotico, R. & Zavanella, B. 2014. Outsourcing services in the Italian National Health Service: The evaluation of private and public operators. Procedia -Economics and Finance, 17, pp. 256-264. [ Links ]
[37] Langvinienè, N. 2014. Changing patterns in the health tourism services sector in Lithuania. Procedia - Social and Behavioral Sciences, 156, pp. 310-316. [ Links ]
[38] Zadeh, L.A. 1965. Fuzzy sets. Information and Control, 8(3), pp. 338-353. [ Links ]
Submitted by authors 16 Mar 2019
Accepted for publication 11 Mar 2020
Available online 29 May 2020
* Corresponding author: sadique.khanfme@kiit.ac.in

