


Services on Demand
Article
 English (pdf)
 Article in xml format
 Article references
Indicators

Related links
-
 Cited by Google
 -
 Similars in Google
Share

 Permalink
South African Journal of Industrial Engineering
On-line version ISSN 2224-7890
Print version ISSN 1012-277X
S. Afr. J. Ind. Eng. vol.31 n.1 Pretoria May. 2020
http://dx.doi.org/10.7166/31-1-2027
GENERAL ARTICLES
A fuzzy event tree methodology modified to select and evaluate suppliers
P. Mizrak Ozfirat*
Department of Industrial Engineering, Manisa Celal Bayar University, Turkey
ABSTRACT
The supplier selection problem becomes more urgent as competition in the market increases. Quality, cost, and the timely delivery of a product mostly depends on the manufacturer's suppliers and the materials supplied. Therefore manufacturers are very elaborate in selecting their suppliers and work hard to develop supplier selection strategies. In this study, event tree analysis (ETA) is used to solve a manufacturing firm's supplier selection problem. ETA is a method that is traditionally used for risk analysis problems, combining the probabilities of risk occurrences subject to the necessary precautions. In this study, this structure is used to select and evaluate suppliers. An event tree is developed to analyse each possible supplier, with branching being used according to the supplier selection criteria. The probability of each branch is set as the performance value of the supplier according to the selection criteria. Finally, the supplier is evaluated by combining all performance values on an event tree basis. Fuzzy logic is also incorporated into the event tree methodology to decrease human error and the effect of uncertainty. Fuzzy triangular numbers are used to denote the performance values of suppliers, and fuzzy ranking is used to distinguish the suppliers into classes. The proposed methodology is applied to nine possible suppliers of a specific material. The results reveal that two of the suppliers dominate all the others in the fuzzy ranking.
OPSOMMING
Die leweransierkeuringsvraagstuk se dringendheid neem toe soos die mark mededinging eskaleer. Gehalte, koste en tydsame aflewering van 'n produk hang hoofsaaklik van die vervaardiger se verskaffers en die gelewerde materiaal af. Daarom is vervaardigers baie sorgvuldig om hul leweransiers te keur en bemoei hulle hulself met die leweransierkeuringsvraagstuk. Hierdie studie gebruik Gebeurtenis boomdiagramontleding (bekend as ETA) om n vervaardigingsmaatskappy se leweransierkeuringsvraagstuk te beantwoord. ETA word tradisioneel gebruik met risiko-analise probleme en dit kombineer die waarskynlikhede van risikogebeurtenisse onderhewig aan die noodsaaklike voorsorgmaatreëls. Hierdie studie gebruik hierdie struktuur om leweransiers te keur. 'n Gebeurtenis boomdiagram is ontwikkel om elke leweransier te ontleed, met vertakkings soos voorgeskryf deur die keuringskriteria. Laastens word 'n leweransier beoordeel deur al die vertoningswaardes te kombineer met die hulp van ETA. Wasigheid word ook in die metodologie opgeneem om menslike foute en die effek van onsekerheid te verminder. Wasige driehoekgetalle word gebruik om die vertoningswaardes van verskaffers aan te dui en wasige gradering verdeel die leweransiers in verskillende klasse. Die voorgestelde metodologie word op nege leweransiers van n spesifieke materiaal toegepas. Die resultate toon dat twee van die leweransiers al die ander oorskadu.
1 INTRODUCTION
Supplier selection is a well-known and widely studied problem in the literature, not least because its importance to industry increases along with competition in the market. The quality, cost, and speedy delivery of a product depends mainly on its suppliers. Therefore manufacturers are very careful in selecting their suppliers. In this study, the supplier selection problem is handled using event tree analysis (ETA), traditionally known as a risk analysis technique.
ETA is a method that combines the probabilities of risk occurrence subject to the necessary precautions. Several precautions are identified for the risk under study. An event tree is developed by 'branching' each precaution into two, denoting either the success or the failure of the precaution. Each branch in the final level of the tree is associated with a probability and a risk state. Finally, a total probability for each risk state is computed.
In this study, each supplier is analysed using the event tree structure; in other words, the initiating event in ETA is the supplier. The branches are formed according to the decision criteria of the supplier selection problem. The performance values of the supplier are assigned to be the probabilities on the branches. At this point of the study, fuzzy triangular numbers are used to decrease human error in identifying the performance values of the suppliers. Then, using the event tree structure, final probabilities for each branch in the tree are computed.
In ETA, each branch is assigned a risk state - disastrous, serious, critical, marginal, or negligible - according to the existence of precautions. This assignment is mostly done on the basis of the experience of decision-makers. At this step of the ETA, a precedence coefficient is computed for each branch using the precedence coefficients of the decision criteria previously found by an analytic hierarchy process (AHP). The branches are associated with a risk state according to their precedence coefficients and the threshold levels of the states. In the finalisation of the proposed methodology, fuzzy ranking is used to distinguish supplier classes.
The rest of the study is organised as follows. In Section 2, a brief literature review is provided about supplier selection and ETA in order to show the place of this study in the literature. In Section 3, the proposed methodology is explained in detail and calculations are demonstrated for an example supplier. In Section 4, computational results are shown. Finally, conclusions are given in Section 5.
2 PLACE OF THE STUDY IN THE LITERATURE
Purchasing is one of the major activities of a manufacturing firm. Its costs, quality, and timeliness depend mostly on its purchasing activities. The supplier selection problem is thus an important one for all manufacturing firms. A wide range of studies of supplier selection have been done, from multi criteria decision-making methods [1] to mathematical modelling approaches [2]. The reader should refer to Chai, Liu and Ngai [3], Yildiz and Yayla [4], and Wetzstein, Hartmann, Benton and Hohenstein [5] for a detailed review of the supplier selection literature. There are also many studies that use fuzzy sets in the supplier selection problem. A detailed literature survey on fuzzy logic and supplier selection is given in Simic, Kovacevic, Svircevic, and Simic [6].
Recent studies in the literature incorporate risk analysis techniques into the supplier selection problem. Berger, Gerstenfeld, and Zeng [7] compute the optimum number of suppliers using a decision tree methodology. Chen and Wu [8] use the failure modes and effects analysis approach for the supplier selection problem. Patra and Mondal [9] compute fuzzy supplier risks and choose the least risky supplier. It can thus be seen that researchers still spend much time and effort on finding efficient and effective solutions for the supplier selection problem.
In this study, the supplier selection problem is addressed using ETA. The main reason to employ ETA is to handle all the positive and negative cases of decision criteria, as in the event tree structure. And each positive and negative case has a probability, which is a suitable measure to represent the performance values of suppliers. Another important point in the proposed methodology is to use fuzzy triangular numbers to denote the performance measures. The aim of using fuzzy numbers is to decrease human error and uncertainty risks. Therefore ETA studies are a matter of interest.
ETA is traditionally a risk analysis method. In the literature it is used to analyse risks for many different industries, such as tunnelling [10], floods [11], cotton warehousing [12], the process industry [13], marine accidents [14] and natural stone plants [15]. There are also studies that incorporate fuzzy logic into ETA. In Ferdous et al. [16], fuzzy triangular numbers are used to represent event probabilities; and the proposed fuzzy ETA methodology is applied to an LPG release problem of a process plant. Bidder et al. [17] employ fuzzy trapezoidal functions to represent event probabilities. Ramzali, Lavasani, and Ghodousi [18] use fuzzy logic in ETA in order to overcome the uncertainties in expert assessments. In Lower, Magott, and Skorupski [19], both triangular and trapezoidal fuzzy numbers are used to define the occurrence probabilities of air traffic accidents. The reader should refer to Kabir and Papadopoulos [20] for further studies in this area.
The present study is novel in that it employs ETA in a different area than risk analysis. The event tree structure is suitable for use in a supplier selection problem. In addition, by including fuzzy numbers, human error and uncertainty risks can be decreased.
3 PROPOSED METHODOLOGY
The proposed methodology integrates fuzzy logic into the event tree structure and uses it to evaluate the supplier problem. The flow diagram of the proposed approach can be seen in Figure 1 below.
The first region in the flow diagram, "I. Supplier selection inputs" (Figure 1) consists of the steps in a traditional supplier selection problem: determining the selection criteria and the alternative suppliers, and finding the precedence coefficients of these decision criteria using the analytic hierarchy process (AHP). The second region in Figure 1 lists the steps of building and performing an event tree structure. The third region is the finalisation and analysis of the event tree, which outputs evaluations of the suppliers.
3.1 Supplier selection inputs
In the first phase of the methodology, the usual steps of a supplier selection problem are considered. First, the supplier selection criteria are determined. In this study, five selection criteria are identified: quality (Q), lead time (L), delivery performance (D), capacity utilization (C), and purchasing cost (P).
• The quality criterion is the percentage of accepted units [21, 22].
• The lead time criterion is the percentage of on-time units [21, 22].
• The delivery performance criterion is the percentage of delivered units in the ordered quantity [21, 22]. (Some deliveries may be less than requested.)
• The capacity utilization is the percentage of supplier capacity utilized for the firm being studied [21, 22].
• The purchasing cost is the unit cost of the material.
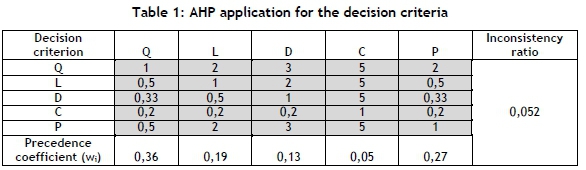
In the next step, order of precedence among the decision criteria is found. In this study, AHP is employed to find the precedence coefficients (wi) of the decision criteria. The pairwise comparison matrix, precedence coefficients (wi), and inconsistency ratio can be seen in Table 1 below. As seen in Table 1, the inconsistency ratio is 0.052, which is less than the acceptable level of 0.1. The precedence coefficients are 0.36, 0.19, 0.13, 0.05, and 0.27 for the Q, L, D, C, and P criteria respectively. Therefore the most important decision criterion for supplier evaluation turns out to be quality, followed by purchasing cost, lead time, and delivery performance. Capacity utilisation is found to be the least effective criterion, with a coefficient of only five per cent.
After determining the precedence coefficients, alternative suppliers are identified. In the problem being studied there are nine alternative suppliers, labelled supplier S1, S2, S3, S4, S5, S6, S7, S8, and S9.
3.2 Event tree structure
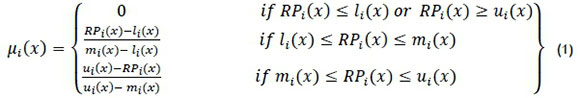
At the second phase of the methodology, the event tree is structured and built to include the necessary computations. Fuzzy logic is incorporated to determine the performance values of suppliers, which is the first step of this phase. Fuzzy triangular numbers are used to identify the performance values of the suppliers for each decision criterion. Three different values are determined for each performance to form the fuzzy triangular numbers. The membership function for the fuzzy triangular performances is given in Equation 1.
where:

• Determining the quality criterion (Q) performance values: Among all the deliveries made by a supplier, the percentage of accepted units from all units delivered is computed to be the most likely performance value for criterion Q (mq). Then all deliveries are considered separately to find the lower bound and upper bound performance values (Iq, uq). Among all the deliveries, the smallest percentage of accepted units provides Iq, and the largest percentage of accepted units provides uq.
• Determining the lead time criterion (L) performance values: Among all the deliveries made by a supplier, the percentage of units delivered on time out of all the units delivered is computed to be the most likely performance value for criterion L (mL). Then all deliveries are considered separately to find the lower bound and upper bound performance values (Il, ul). Among all the deliveries, the smallest percentage of units delivered on time provides Il, and the largest percentage units delivered on time provides uL.
• Determining delivery criterion (D) performance values: Sometimes suppliers are not able to deliver the whole order. Thus among all the deliveries made by a supplier, the percentage of units delivered out of all the units ordered is computed to be the most likely performance value for criterion D (mD). As with Q and L, all deliveries are considered separately to find the lower and upper bound performance values (Id, ud).
• Determining capacity utilisation (C) performance values: In this step, the capacity utilisation ratios for all suppliers are computed first. Then these values are normalised between 0 and 1 according to the maximum value among the suppliers (i.e., the supplier that uses maximum capacity for the firm has a performance value of 1). In this way the most likely performance values for criterion C (mC) are computed. To find the upper bound performance (uc), the capacity utilisations are increased by 0.02 (2%) and normalised. Similarly, to find the lower bound performance (lC), capacity utilisations are decreased by 0.02 (2%) and normalised.
• Determining Purchasing cost (P) Performance Values: The purchasing cost belonging to all suppliers are normalised according to the minimum purchasing cost value (i.e. The supplier which provides minimum cost has a performance value of 1). By this way, most likely performance values for criterion P (mp) are computed. To find the upper bound performance (up), purchasing costs are increased by 10% of the maximum cost and normalised. Similarly, to find the lower bound performance (Ip), purchasing costs are decreased by 10 per cent of the maximum cost and normalised.
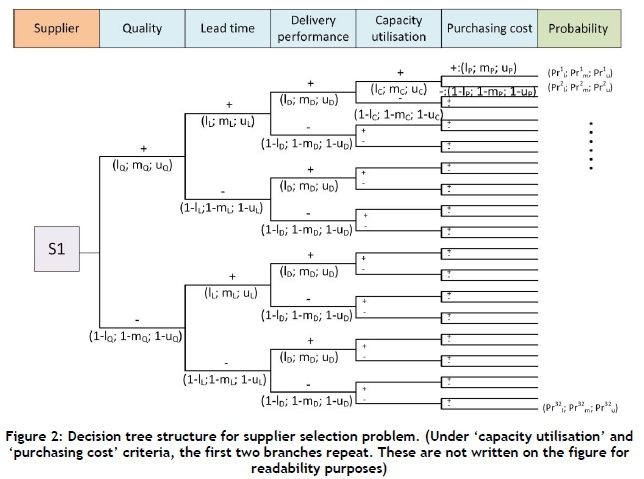
As a result of these analyses, the fuzzy triangular performances are given in Table 2 below. After identifying the performance values, the supplier selection problem is structured similar to a decision tree, listing all the possible combinations of performance levels. Note that each event in the tree is independent of the others, so the order of events may change. However, this order would not affect the computational results (Figure 2).
The decision criteria for the supplier selection problem are given at the top of Figure 2. The tree is split into two branches for each criterion. Since there are five criteria, there are 32 branches (=25) at the final stage. Under the quality criterion, there are two branches, representing positive and negative levels (+, -).
The positive branch (+) represents the supplier's positive performance level for quality in fuzzy means. In other words, the fuzzified performance of supplier S1 is (0.85; 0.98; 1) (From Table 2) which means that "Supplier S1 delivers 98% (mq) of materials in good quality on average. This performance may range between 85% and 100% (Iq and uq)".
The negative branch (-) represents the negative performance level. In other words, "Supplier S1 delivers 2% of the materials in unacceptable quality (1 - mq) on average. This value may range between 0% and 15% (1- uq and 1- Iq)."
The tree is structured similarly for each of the other four decision criteria (L, D, C, P), producing 32 branches, which make a complete set of combinations of positive and negative performance levels for each decision criterion (25 branches).
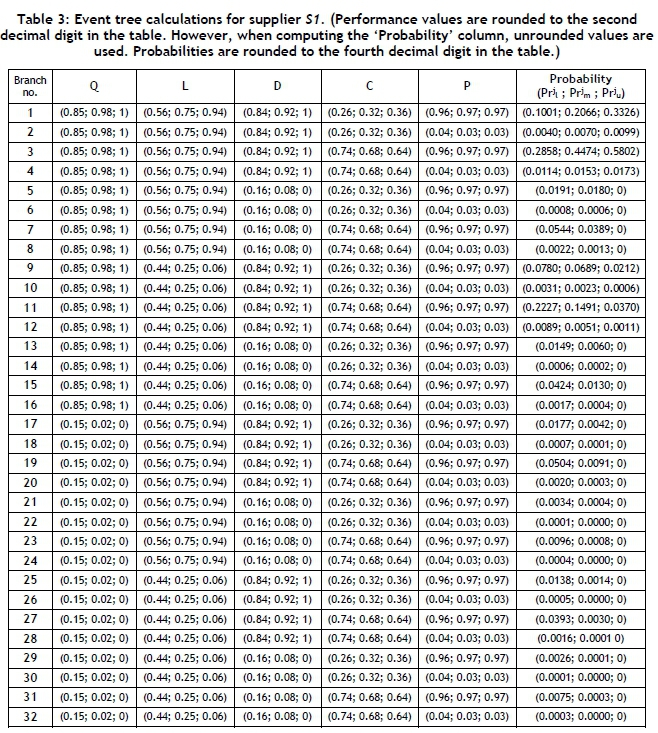
Finally, the probability of each branch is computed for the lower bound, the most likely, and the upper bound cases using Equations 2, 3, and 4 respectively.

where
The probability calculations for supplier S1 can be seen in Table 3 below. Note that, in Table 3, only the positive performance values of the suppliers are computed as fuzzy triangular numbers. Other values may or may not conform to the standards of fuzzy triangular numbers due to event tree calculations. (In an event tree, the probabilities for all levels of branches should add up to 1.) Similar to supplier S1, a fuzzy event tree analysis is also performed for all the other suppliers (suppliers S2 to S9).
3.3 Supplier evaluation
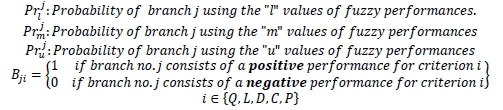
In the event tree structure, 32 branches are formed. Each of these branches represents a different combination of the five decision criteria on either the positive or the negative level. Table 4 gives the list of 32 branches and the corresponding combinations. In addition, each of these branches has a different precedence level according to the positive or negative level of the decision criterion. The precedence level of the branch is computed by adding the precedence values (found by AHP in Section 3.1; refer to Table 1) of the positive level decision criterion in the branch (Equation 5).
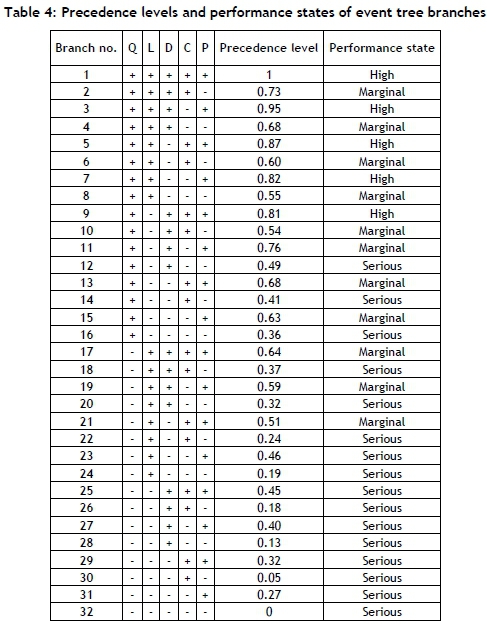

For example, branch number 1 in Table 4 is the branch where all the decision criteria have positive levels. Therefore the precedence level of this branch is the sum of the precedence values of all five decision criteria, which is 1 (=0.36+0.19+0.13+0.05+0.27) (refer to Table 1). Another example can be given from branch number 2 in Table 4 - the branch where the first four decision criteria (Q, L, D, C) have positive levels and the fifth (P) has a negative level. Therefore the precedence level of this branch is the sum of the precedence values of the first four decision criteria, which is 0.73 (=0.36+0.19+0.13+0.05) (refer to Table 1). The precedence levels of the 32 branches are computed similarly, and are set out in Table 4. Then these precedence levels are used to determine the performance state of the branch.
In many of the ETA studies in the literature, there are five states: negligible, marginal, critical, serious, and disastrous. These states are determined according to the evaluation of workplace accidents. However, in the supplier selection problem addressed in this study, three states are determined to evaluate the supplier: high performance, marginal performance, and serious performance. These three states are determined since fuzzy triangular numbers are used in identifying the final performance of each supplier. In other words, the high, marginal, and serious performance states correspond to the upper, most likely, and lower bounds of fuzzy performances. It should be noted that four states of ETA could be used if fuzzy trapezoidal numbers were employed.
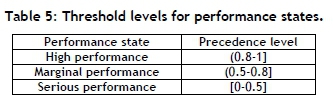
In the next step, the threshold levels are determined to evaluate the performance state of each branch in the tree. In Table 5, the threshold levels for the performance states of the branches are given. If the total precedence level of a branch in the event tree is greater than 0.8, that branch is determined to be a 'high performance' branch. If the precedence level of a branch in the event tree is between 0.5 and 0.8, then that branch is determined to be a 'marginal performance' branch; and if the precedence level is less than 0.5, the branch is determined to be a 'serious performance' branch. When determining these threshold levels, the strategic importance of the selection criteria for the firm is considered. The quality and purchasing cost criteria are indispensable. Therefore, when one of these performances is negative, the performance state cannot be 'high performance'. However, the other three criteria - lead time, delivery performance, and capacity utilisation - are more tolerant of a negative performance. The priorities belonging to these three criteria are 0.19, 0.13, and 0.05 respectively. Therefore the threshold level for the 'high performance' state is calculated to be 0.8, which provides tolerance for the three decision criteria L, D, and C (=min (1-0.19; 1-0.13; 1-0.05)).
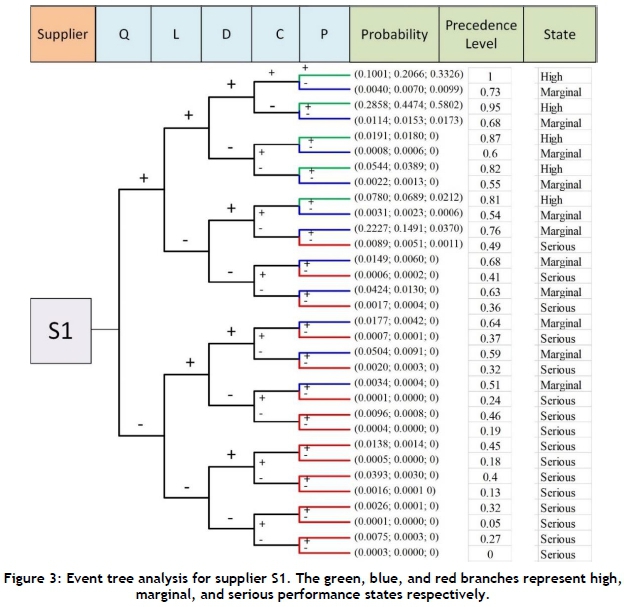
In line with these threshold levels, the performance states of the 32 branches are given in Table 4. For example, since the precedence level of branch 1 in Table 4 is 1 (1>0.8), the branch is a 'high performance' branch. Since the precedence level of branch 2 in Table 4 is 0.73 (0.5<0.73<0.8), the branch is a 'marginal performance' branch. The performance states of the 32 branches are identified in a similar way. Note that, when the precedence values of the decision criteria change (In other words, when pairwise comparisons in AHP change), the precedence levels of the branches - and hence the performance states of the branches - would change. The computations for supplier S1 can be seen in Figure 3.
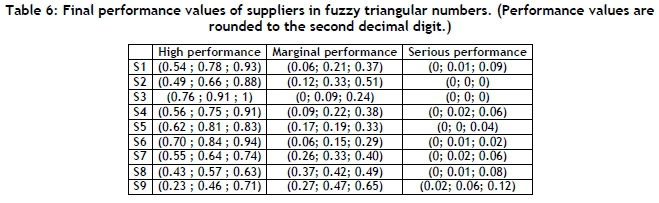
Then the final performance of each supplier is determined according to the three states (Table 6). The probabilities of the 'high performance' branches (the green branches in Figure 3) are added to give the high performance probability; the probabilities of the 'marginal performance' branches (the blue branches in Figure 3) are added to give the marginal performance probability; and the probabilities of the 'serious performance' branches (the red branches in Figure 3) are added to give the serious performance probability.
4 COMPUTATIONAL RESULTS
In the last step of the proposed methodology, the suppliers are compared and evaluated. In this step, the high performance values of the suppliers (Table 6) are compared, since the firm is interested in a positive performance. Since the performance values are computed in fuzzy means, the comparisons are also made in fuzzy means. The fuzzy triangular performance values of the nine suppliers can be seen in Figure 4 below.
In comparing the fuzzy triangular performances of the suppliers, the ranking methodology of Triantaphyllou [23] is used. For every performance comparison between Si and Sj (with membership functions of μi(Sj) and μj(Sj), fij is computed first, as in Equation 6 below.

Then Si is determined to dominate Sj if

where A is a constant number chosen from 0.7, 0.8, or 0.9 [23]. As the level of A increases, the higher level suppliers would easily dominate the others. As the level of A decreases, the number of suppliers in the dominant set would increase. In this way, alternative suppliers can be identified. In this study, in order to provide more alternative suppliers, A is determined to be 0.7. This value is represented by the red line in Figure 4. Using Equations 6 and 7, comparisons between every pair of suppliers are made. The results can be seen in Table 7, where the suppliers are ordered according to their places on the graph (Figure 4) from maximum to minimum (right to left).

From Table 7 it can be seen that supplier S3 dominates all the other suppliers except for supplier S6. Suppliers S3 and S6 are said to be indifferent. In addition, supplier S6 is indifferent in relation to S5 and S1; however, it dominates suppliers S4, S2, S7, S8, and S9.
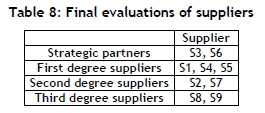
In the last column in Table 7, the indifference sets can be seen. However, there are intersecting suppliers within these sets. Each supplier must appear in only one set in the final evaluation. In addition, the decision-makers prefer that there be at least two suppliers in each set. This is because they want to have at least one spare supplier supporting the other. Looking at Figure 4 and the decision-makers' choices, the suppliers are split into four categories, as shown in Table 8.
5 CONCLUSION
In this study, a new methodology that employs ETA and fuzzy logic is proposed to address the supplier selection problem. The proposed methodology is made up of three main phases. The first phase includes the classic steps of a supplier selection problem: the determination of decision criteria, the precedence coefficients of the decision criteria, and the alternative suppliers. In the second phase, an event tree structure is developed for each supplier, for which the initiating event is the supplier and the branch probabilities are the supplier's performances. In addition, in order to eliminate human error and the effect of uncertainties in supplier performances, fuzzy triangular numbers are used to denote the performance values. An ETA is performed for each level of performances in turn. In the third phase of the methodology, each branch in the event tree is assigned a precedence level according to the precedence coefficients of the corresponding decision criteria in the branch. Then the event tree branches are grouped into three performance states - high, marginal, and serious - according to the precedence levels of each branch. Finally, the suppliers are evaluated by fuzzy ranking.
The proposed approach is employed for the nine alternative suppliers of a manufacturing firm. Among the nine alternative suppliers, two were found to dominate all the others, and so these were determined to be strategic partners. The remaining suppliers were grouped into three categories according to their fuzzy performances.
In conclusion, the proposed approach can also be used for other industries' supplier selection problems, and the assignment of precedence levels to branches and the determination of each branch's states can be incorporated into different ETA studies.
REFERENCES
[1] Araujo, M.C.B. & Alencar, L.H. 2015. Integrated model for supplier selection and performance evaluation. South African Journal of Industrial Engineering, 26(2), pp. 41-55. [ Links ]
[2] Mirzaee, H., Naderi, B. & Pasandideh, S.H.R. 2018. A preemptive fuzzy goal programming model for generalized supplier selection and order allocation with incremental discount. Computers â Industrial Engineering, 122, pp. 292-302. [ Links ]
[3] Chai, J., Liu, J.N.K. & Ngai, E.W.T. 2013. Application of decision-making techniques in supplier selection: A systematic review of literature. Expert Systems with Applications, 40, pp. 3872-3885. [ Links ]
[4] Yildiz, A. & Yayla, A.Y. 2015. Multi-criteria decision-making methods for supplier selection: A literature review. South African Journal of Industrial Engineering, 26(2), pp. 158-177. [ Links ]
[5] Wetzstein, A., Hartmann, E., Benton Jr, W.C. & Hohenstein, N.O. 2016. A systematic assessment of supplier selection literature: State-of-the-art and future scope. 2014, 182, pp. 304-323. [ Links ]
[6] Simic, D., Kovacevic, I., Svircevic, V. & Simic, S. 2017. 50 years of fuzzy set theory and models for supplier assessment and selection: A literature review. Journal of Applied Logic, 24, pp. 85-96. [ Links ]
[7] Berger, P.D., Gerstenfeld, A. & Zeng, A.Z. 2004. How many suppliers are best? A decision-analysis approach. Omega, 32, pp. 9-15. [ Links ]
[8] Chen, P.S. & Wu, M.T. 2013. A modified failure mode and effect analysis method for supplier selection problems in the supply chain risk environment: A case study. Computers â Industrial Engineering, 66, pp. 634-642. [ Links ]
[9] Patra, K. & MondaI, S.K. 2016. A supplier selection model with fuzzy risk analysis using the balanced solution technique with a soft set. Pacific Science Review A: Natural Science and Engineering, 18, pp. 162-168. [ Links ]
[10] Hong, E.S., Lee, I.M., Shin, H.S., Nam, S.W. & Kong, J.S. 2009. Quantitative risk evaluation based on event tree analysis technique: Application to the design of shield TBM. Tunnelling and Underground Space Technology, 24, pp. 269-277. [ Links ]
[11] Rosqvist, T., Molarius, R., Virta, H. & Perrels, A. 2013. Event tree analysis for flood protection: An exploratory study in Finland. Reliability Engineering and System Safety, 112, pp. 1-7. [ Links ]
[12] Ju, W.H. 2016. Study on fire risk and disaster reducing factors of cotton logistics warehouse based on event and fault tree analysis. Procedia Engineering, 135, pp. 418-426. [ Links ]
[13] Alileche, N., Olivier, D., Estel, L. & Cozzani, V. 2017. Analysis of domino effect in the process industry using the event tree method. Safety Science, 97, pp. 10-19. [ Links ]
[14] Raiyan, A., Das, S. & Islam, M.R. 2017. Event tree analysis of marine accidents in Bangladesh. Procedia Engineering, 194, pp. 276-283. [ Links ]
[15] Ozfirat, M.K., Ozkan, E., Kahraman, B, Sengun, B. & Yetkin, M.E. 2017. Integration of risk matrix and event tree analysis: A natural stone plant case. Sadhana, 42(10), pp. 1741-1749. [ Links ]
[16] Ferdous, R., Khan, F., Sadiq, R., Amyotte, P. & Veitch, B. 2009. Handling data uncertainties in event tree analysis. Process Safety and Environmental Protection, 87, pp. 283-292. [ Links ]
[17] Bidder, O.R., Arandjelovi, O., Almutairi, F., Shepard, E.L.C., Lambertucci, S.A., Qasem, L.A. & Wilson, L.P. 2014. A risky business or a safe BET? A fuzzy set event tree for estimating hazard in biotelemetry studies. Animal Behaviour, 93, pp. 143-150. [ Links ]
[18] Ramzali, N., Lavasani, M.R.M. & Ghodousi, J. 2015. Safety barriers analysis of offshore drilling system by employing fuzzy event tree analysis. Safety Science, 78, pp. 49-59. [ Links ]
[19] Lower, M., Magott, J. & Skorupski, J. 2016. Analysis of air traffic incidents using event trees with fuzzy probabilities. Fuzzy Sets and Systems, 293, pp. 50-79. [ Links ]
[20] Kabir, S. & Papadopoulos, Y. 2018. A review of applications of fuzzy sets to safety and reliability engineering. International Journal of Approximate Reasoning, 100, pp. 29-55. [ Links ]
[21] Mizrak Ozfirat, P. & Ogut, C. 2008. Application of analytic hierarchy process and goal programming in supplier selection problem. Dokuz Eylul University Engineering Faculty Science and Engineering Journal, 10(1), pp. 39-48. [ Links ]
[22] Mizrak Ozfirat, P., Tuna Tasoglu, G. & Tuncel Memis, G. 2014. A fuzzy analytic hierarchy process methodology for the supplier selection problem. Journal of Enterprise Information Management, 27(3), pp. 292-301. [ Links ]
[23] Triantaphyllou, E. 2000. Multi-criteria decision-making methods: A comparative study. Kluwer Academic Publishers, Dordrecht. [ Links ]
Submitted by authors 10 Aug 2018
Accepted for publication 16 Mar 2020
Available online 29 May 2020
* Corresponding author: pinar.ozfirat@cbu.edu.tr

