


Services on Demand
Article
 English (pdf)
 Article in xml format
 Article references
Indicators

Related links
-
 Cited by Google
 -
 Similars in Google
Share

 Permalink
South African Journal of Industrial Engineering
On-line version ISSN 2224-7890
Print version ISSN 1012-277X
S. Afr. J. Ind. Eng. vol.30 n.4 Pretoria Dec. 2019
http://dx.doi.org/10.7166/30-4-2080
GENERAL ARTICLES
A Standardised Model To Quantify The Financial Impact Of Poor Engineering Information Quality In The Oil And Gas Industry
E.O. Coetzer*; P.J. Vlok
Department of Industrial Engineering, Stellenbosch University, South Africa
ABSTRACT
Industry needs quality data, but digital formats increase the risk of lost data quality, implying huge risk. The benefits of data quality are difficult to calculate in order to justify the expense. A survey was developed and validated at an operating asset as a precedent. The elements are productivity and production loss, and increased cost and risk. A Monte Carlo method was field tested. The results were presented in graphical and Pareto form to facilitate funding and prioritisation. The results prove that the cost is significant. As a first exploration of the subject, opportunities exist for more sophisticated models, and for investigating causality.
OPSOMMING
Die energie-industrie benodig hoë gehalte data, maar digitale formate verhoog die moontlikheid van gehalteverlies, wat groot risiko tot gevolg mag hê. Die voordele van data gehalte is moeilik berekenbaar en dus so ook die regverdiging van uitgawes verbonde aan verbeteringsprojekte. 'n Meningspeiling is ontwikkel en gevalideer by 'n aanleg in bedryf om sodoende 'n presedent te skep. Die elemente is verlies aan produksie en produktiwiteit en verhoogde koste en risiko. n Monte-Carlo simulasiemodel is gebou en getoets. Die resultate is grafies en in Pareto-formaat aangebied om befondsing en prioritisering te vergemaklik. Die resultate bewys dat die kostes noemenswaardig is. Geleenthede bestaan vir meer gesofistikeerde modelle en 'n ondersoek na die oorsake moet van stapel gestuur word.
1 INTRODUCTION
Industrial assets rely on engineering information to run safely and to be environmentally responsible and profitable. The digital era has introduced the risk that information can be changed, copied, and distributed so quickly and cheaply that control of its quality may be lost. An example is the pressure setting of a relief valve: if it is shown incorrectly on the maintenance procedure, the risk of an explosion is increased. This loss of control carries significant safety and profitability risks for an asset. In light of recent highly publicised industrial disasters, there is also escalating societal pressure on the oil and gas industry to be held accountable for how it manages its information [1]. This risk, however, is not immediately evident in daily operations. Although this problem is instinctively understood by engineers and technicians, its impact is difficult to quantify [2]. This makes it problematic to justify the expense to rectify the deficiencies. If a defensible business case could be made, it would enable managers to weigh the benefits of a quality improvement investment equally against other opportunities.
This paper reports on a research project to develop a defensible model to quantify the financial effects of poor engineering information quality, deconstructed into the classifications that follow from the research design. The research objective was to develop a standardised model to quantify the financial impact of poor engineering information quality in the oil and gas industry.
This paper defines 'engineering information' (EI) as information in the form of data, drawings, documents, or models that relate to the design, operation and reliability of equipment. The quality of EI (EIQ) is defined as EI that is complete and accurate to the specification required by the operating company, and readily available to the target population in the correct repository.
The scope of this study is limited to investigating the financial impact of EIQ in an operating company in the oil and gas industry. The target audience is senior management, where authority is held regarding funding for EIQ remediation.
This paper is organised as follows: Section 2 summarises key conclusions from the literature for a number of relevant subjects. Section 3 explains the decision to use a survey-based method, the development of the survey, and the data collection methodology. Section 4 discusses the development of the deterministic and stochastic models, and how the results are presented to the target audience. Section 5 describes a case study. The final section lists conclusions and proposes further research.
2 LITERATURE SURVEY
This section summarises the review of the literature. It covers subjects across many disciplines in order to address the research objective in a real-world, multidisciplinary corporate context.
2.1 Initial literature survey
Here, the objectives were to confirm that there is a need for this study, and to gain an understanding of how it might be approached. The date ranges in the literature show that this problem has been known for decades. Figures were frequently quoted, but the methods to derive quoted figures were opaque or anecdotal [3] For example, 75 per cent of organisations have identified costs stemming from dirty data, or 33 per cent of organisations have delayed or cancelled new IT systems because of poor data [4].
Some general themes emerged from the literature. The first obvious one is cost. More than 80 per cent of data integration projects either exceed budget or fail [4]. An electronic warehouse of design data could save 10 per cent on the life-time costs of a plant [5]. Savings of 15 to 30 per cent were estimated on an engineering budget [6]. Fewer than half of companies felt confident about their EIQ, and fewer than a quarter trusted data delivered to them [2]. More than a quarter of an engineer's time is taken up by looking for information [6]. The importance of EIQ is recognised by reputable engineering specifications. The highest category of human performance problems is "deficient procedures or documentation" [7]. Three specific reports were found that provided clear guidance about the approach to the problem [8,9,10].
The potential cost of poor EIQ and the need for this study are confirmed from these insights. Furthermore, impacts of poor EIQ manifest in many forms; any study should be multi-faceted.
2.2 Survey design
This part of the literature review demonstrates the importance of presenting the questions in the most palatable manner possible, balancing scope and granularity, minimising satisficing behaviour and fatigue, and using a format familiar to the respondent in order to minimise cognitive effort [11]. The survey needs to be as short as possible, contain focused and clear questions, and require no more than 20 minutes to complete.
2.3 Corporate decision-making
The objective here was to gain a general understanding of decision-making so that the results of this study could be presented in the most favourable format. The salient points discovered were that decisions are not necessarily rational [7], that humans are likely to settle for satisfactory (rather than optimal) decisions, and that decisions are more likely to be driven by the outcome that the experts who are advising the decision-makers know most about [12].
2.4 Results presentation
This section intended to explore the format of the results presentation in more detail. The primary conclusions were to present the results in the most distilled and palatable format possible, to minimise cognitive strain [7], and that managers find pictorial performance profiles credible [13].
These sources point to the responsibility of this work study to present its conclusions in a way that enables the most rational decision, with the least possible cognitive strain.
2.5 Statistical methods
Since decision-makers need to understand "the structure of uncertainty" [14], and a statement of probability serves as assurance that the reported results are reliable, a stochastic calculation is indicated. Accordingly, this section contains a general review of the most eminent quantitative techniques, together with their applicability to the model described in section 4. Table 1 summarises the techniques and the salient conclusions. Specifically, the efficacy of a Monte Carlo method is demonstrated.
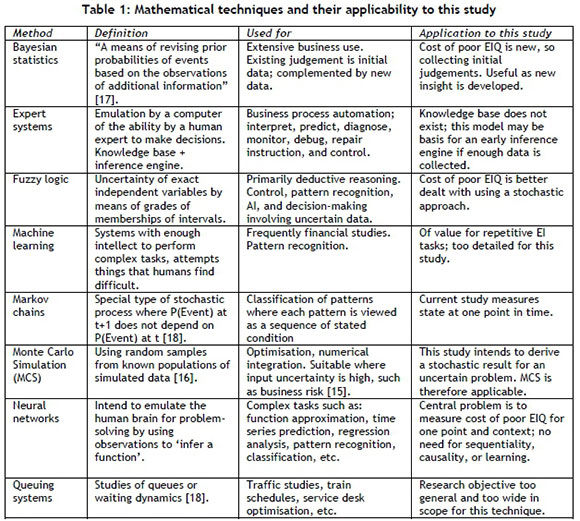
The conclusion that Monte Carlo is appropriate for this study requires a literature investigation into the subject, which is done in the next paragraph.
2.6 Monte Carlo simulation
The literature survey in this section concluded that a Monte Carlo simulation should generally take this form: define a range of inputs; draw inputs from the probability distribution at random; calculate the result deterministically for each input; aggregate the results of each calculation in the form of a distribution [15]. Given the ease of modern computing, "lots of" trials should be done. This will reduce the variability and improve the power of the model [16]. The design is arbitrarily set at 10,000, after which a confidence test will be calculated.
Having reviewed the literature for the relevant technical subject areas, the work is ready to proceed to the specific research design.
3 RESEARCH DESIGN AND DATA COLLECTION
The objective of this section is to describe the design of the research, including the structure and development of the survey, and to provide a brief discussion about data collection.
3.1 Research design
From the literature survey, a common architecture was found for the three specific studies [8,9,10]. This can be summarised as follows: disaggregate the problem into standardised elements; develop a survey; validate the survey; collect data; develop a model; aggregate the results. In section 2.4 it was shown that the model must be stochastic.
Another perspective is shown in Table 2. It was compiled from many conversations within three oil companies.
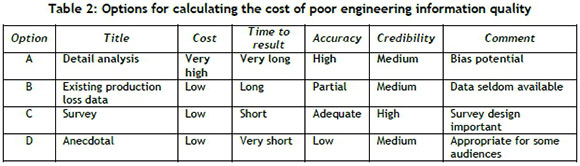
Given the need for a quick, low-cost solution of adequate accuracy, Option C is the most appropriate.
The fundamental research method was derived from a combination of the common architecture and Option C in Table 2. It is described next.
At this point, an impact element (IE) is defined: An IE is one specific impact or consequential effect of poor EIQ on an operating company.
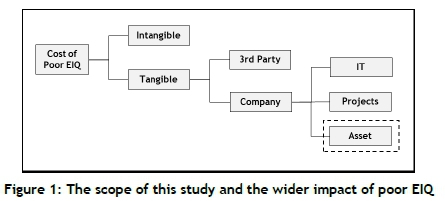
Following the precedent set in the literature [3], a list of lE's was extracted from the literature. lE's manifest across the organisation. This necessitated limiting the extracted list of IE's used in the survey to within the research scope -, namely the operations phase of an asset. Figure 1 demonstrates the scope of the research and the wider impact of poor EIQ.
After transforming the shortened list of IE's into provisional survey questions, the next step was to collect initial survey data and simultaneously validate the survey using structured interviews. This baseline is useful for scaling, and offers a quid pro quo in the form of immediate feedback to the asset where the interviews were held.
The validated IE's were transformed into a final survey, which is described in paragraph 3.2. Next, a deterministic model was constructed to provide the formulae for the simulation. Finally, the results were presented in a suitable format, as discussed in paragraph 2.4.
3.2 Survey structure
The structure of the survey is shown in Figure 2, and discussed below.
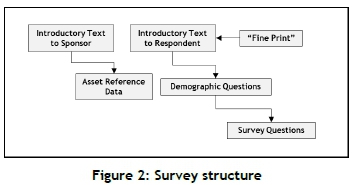
• Introductory Text to the sponsoring manager reiterates the objective and mechanics.It also poses the decision regarding Alternative Contribution.
• Asset reference data is required as input constants for the model calculations. These are requested from the manager.
• Introductory text to survey Respondents explains the objective of the survey and the specific requests from the respondents.
• "Fine Print" explains the ethical aspects of the survey, including voluntary participation and anonymity.
• Demographic data is collected for the purposes of remediation prioritisation, as explained in Section 4.3 (Taxonomy).
• Survey questions provide the data for the model.
A sample of the questions in the survey is shown in Table 3.
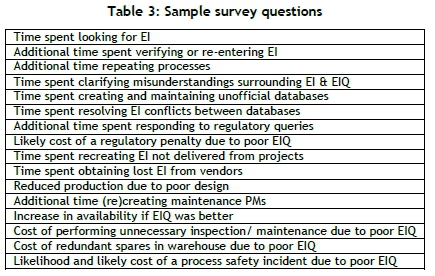
3.3 Alternative contribution
Table 3 shows that many of the questions relate to wasted time. This raises the question: "What is done with the engineering time made available when EIQ is improved?". Precedent [8,9,10] implies that this results in a reduction in staff numbers. This is not always feasible or desirable. An alternative is to apply the additional time to other value-adding activities. The survey method therefore provides the option to the sponsoring manager to assign a financial value to an individual profile. If this option is selected, the model will add the 'Alternative Contribution' as a weighted addition calculation.
3.4 Data collection
The data collection method of the final survey was internet-based self-completion. This is due to its practicality across time zones and its prevalence in the industry. Since the final survey was intended for a much larger audience and was done remotely, more effort was needed to overcome the reluctance to participate [19]. Introductory presentations were made to management to obtain permission to run the surveys. Once permission was granted, the general process was as follows: an introductory email was sent to the target population by the sponsoring manager granting the permission, stating support for the survey and requesting participation; the electronic link to the survey was sent to the target population by email; two subsequent reminder emails were sent; on survey closure, a thanking email was sent to the sample population, and a different one to the sponsoring manager.
4 MODEL AND RESULTS PRESENTATION
This section discusses the development of the deterministic and stochastic models, and concludes with a description of how the results were presented.
Microsoft Excel was used for the model, since the model is mathematically simple enough, and so that the value of this study is maximised by making it as accessible as possible.
4.1 Deterministic model
The deterministic model is the repeating algorithm for the stochastic model, and a simplified calculation in circumstances where a deterministic result is required.
First, a few concepts are introduced, then the component parts of the model are described, followed by the variable declarations and calculations.
• Barrel oil equivalent (BOE) reports the production of various fractions of oil and gas in one unit.
• The cost of one full-time-equivalent (CFTE) is the total annual cost of employment or contracting of one individual.
• Asset rated production is the production rate used in the business plan for the year in which the survey is undertaken.
• The cost of a process safety incident (PSI) includes all direct and indirect costs associated with a PSI.
• Plant availability is the time during which an operating asset is not producing, expressed as a percentage of total calendar time.
Figure 3 displays a schematic of the deterministic model structure. Each table is then discussed.
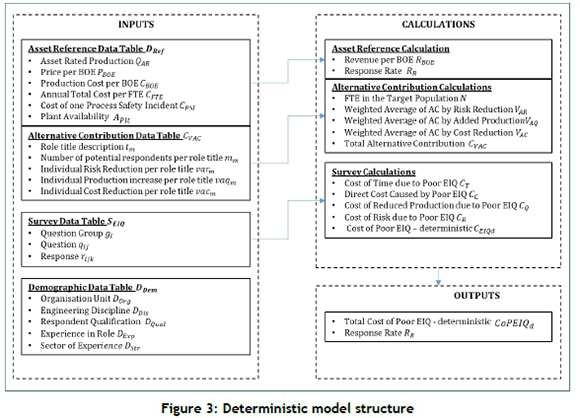
• The asset reference data table DReftable is provided by the sponsoring manager, and provides actual or assumed constant values.
• The alternative contribution table CVACwas described in Section 3.3. Ν = Total number of FTE in the sample population and η = number of responses r to individual questions.
• The survey table SEIQis a collection of four survey question groups gt, where i e {C,T,R,Q}, (cost, time, risk, production). Each question group gtconsists of several questions q,, where j e R. Each question group gtuses a different formula to calculate its contribution to the cost of poor EIQ. Each question q}, in turn, will receive responses rk,k e R. The questions in the final survey questions have specific totals as follows: gT e {1,2,3, ...,28}; gQ e {1,2,3,4}; gc e {1,2,3.....9}; gRe{1}.
• Data in the DDemtable is collected for calculating the taxonomy, discussed in Section 4.3.
The calculations of the deterministic model are all normalised to the unit of measure US dollars per year, since this is a universally accepted currency for the industry. The calculations are as follows:
• Asset reference data DRef:
oRßOE =PbOE - CgoE
• Alternative contribution CVAC:
o Ν = Σmm
o VAR= Σ(Mm. varm)/ Ν (Alternative contribution to risk reduction)
o VAC= Σ(Mm.vacm)/Ν (Alternative contribution to cost reduction)
o Vaq = Σ(Mm.vaRm) / N) .QAR. 365 (Alternative contribution production)
oCvac = Var + Vaq + Qar + Vac
• The survey table calculations require the definition of intermediate variables:
o IET= Average response in the subgroup impact element 'time'
o IEC= Average response in the subgroup impact element 'cost'
o IEq = Average response in the subgroup impact element 'production'
o IER= Average response in the subgroup impact element 'risk'
o CEIQd= Cost of poor EIQ - deterministic, consisting of:
■ CT= Cost of time due to poor EIQ in [USD]
■ Cc= Cost directly caused by poor EIQ in [USD]
■ CQ= Cost of reduced production due to poor EIQ in [USD]
■ CR= Cost of risk due to poor EIQ in [USD]
o CoPEIQd= Total cost of poor EIQ - deterministic
• The calculations of the survey table are shown next. One approach is shown; the same result may be achieved several ways. The constants 28, 4, and 9 are because gT e {1,2,3, ..,28}; gQ e {1,2,3,4}; gce {1,2,3.....9}; gRe{1}.
o IET = ( Σkr=1ljBΣ1rTjk)/28k
o IEQ = ( Σkr=llΣlrQjk)/4k
o IEC = ( Σkr=1lΣc)/9k
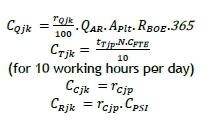
o CT (assuming 10 hours work per day).
o Cc = IEC
o =  .QAR.Aplt.RBOE.365.
o Cr = IErt
o CE[Qd= CT + Cc + Cq + CR
o CoPEIQa = CEIQd + CVAC
o Response rate RR = n/N
The formulae of the calculation for CoPEIQdenable the Monte Carlo model, which is described next.
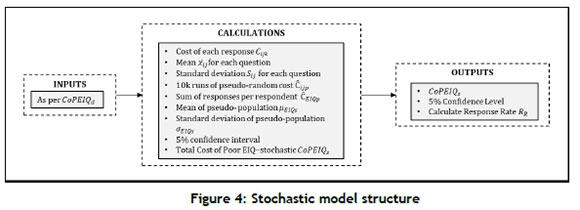
4.2 Stochastic model
The deterministic model provides the basis to calculate the cost of poor EIQ stochastically. After introductory remarks, the model is shown graphically in Figure 3, followed by some variable declarations and a description of the calculations.
In principle, survey data may be distributed by any continuous distribution for every question and survey. Since the intent of the work is to provide a defensible range of results for the cost of poor EIQ, the cost and complexity of formal distribution analysis is not deemed justified. Instead, the data is assumed to be normally distributed. Sample size is "not an easy question to answer" [18], but one source suggests "about 10 to 20" [17]. Consequently, a minimum sample of 20 respondents was requested.
Using the same conventions as in Figure 3, the selected approach is shown in Figure 4.
The notation Cxxxwas used in the previous section for 'cost', with 'XXX' representing various cost elements, such as PSI or FTE. In this section, the notation txxxis introduced to distinguish between costs that have been calculated deterministically, and those generated for the simulation. The notation C may be called 'pseudo-cost'.
The following additional variables are introduced for the stochastic model:
• Ciijk= Individual cost calculation per survey data point rijk
• xtj = The sample mean of the responses for a specific question
• Sij= The standard deviation of the responses for a specific question
• Cijp= Pseudo-costs generated for a specific question
• ρ = Number of randomly generated runs, ρ e {1,2,3 ... 10,000} (equivalent to riJk= individual responses, rijk; k e R)
• CEIQp= Population of the sum of ρ individual pseudo-responses
• ßEiQs = Mean of the population CEIQp
• aEiQs = Standard deviation of the population CEIQp
• CEIQs= Cost of poor EIQ-stochastic; the equivalent of CEIQd
• CoPEIQs= Total cost of poor EIQ - stochastic
The steps to develop the stochastic model are as follows:
1. To normalise the unit of measure to USD, calculate CiJkfor each response. Different calculations for the four elements of the group gt; i e {C.T.R, Q} are:
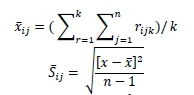
2. Calculate the mean xijand standard deviation Sij- for each question
3. Generate 10,000 runs of pseudo-random numbers Cijpusing Excel's NORM.INV command
4. Add these results per pseudo-respondent using the calculation
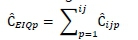
5. Calculate the mean of the population of pseudo-sums CE[Qpusing the calculation
6. Calculate the standard deviation of the population of pseudo-sums CEIQpusing the calculation
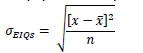
7. Calculate the five per cent confidence interval of the population of pseudo-sums CE[Qpusing the calculation

8. The calculated mean of the population of pseudo-sums 𝜇𝐸𝐼𝑄𝑠 is equal to the cost of poor EIQ -stochastic CEIQs:

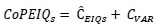
9. The total cost of poor EIQ - stochastic CoPElQsis:
These calculations form the basis of the stochastic part of the model.
4.3 Formatting results presentation
Given that the intended audience are managers, the results are presented in a format familiar to this audience. Validation interviews with managers indicated that, if CoPEIQsis a competitive number, more of the problem needs to be understood to prioritise EIQ remediation projects. For this reason, a taxonomy was developed, as described in this section.
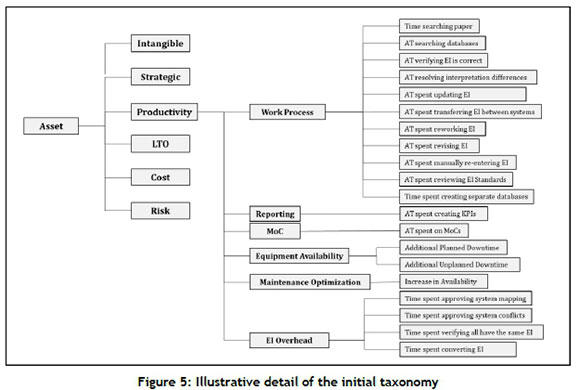
A taxonomy should be concise, provide a clear differentiation between objects, and be comprehensive, extendible, and explanatory. A structured method was followed to develop an initial taxonomy that, like the survey questions, was validated in the field. It is mentioned in passing that existing taxonomies were evaluated [3], but were found unsuitable because they were too specific or were in a language unfamiliar to the industry.
The five top elements of the taxonomy have been chosen because they are foremost in the minds of senior management, regardless of the business cycle, current strategy, or terminology. The intermediate level of the taxonomy was based on standard processes.
To illustrate this, Figure 5 shows an extract from the taxonomy.
Excel's SUMIF function was applied to the Cijkdata, and Excel's standard 'Pareto' graphic was applied to the table so derived. An example is shown in Section 5.
5 CASE STUDY
The work described in the preceding sections enabled the population of data in the Excel model. Actual field data from an operating asset was used, resulting in the assigning of funds for a remediation effort. It is mentioned in passing that (ironically for this study) the quality of the received survey data required significant format quality improvement before it could be applied to the model.
This article reports the calculated results of laboratory data of a similar order of magnitude as the field data. The results of the model for the laboratory data set are given and subsequently discussed. The units are millions of US dollars per year, and are rounded to the nearest million dollars.
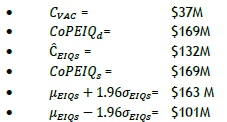
Since these results have been calculated on randomly generated data of a similar order of magnitude to field data, a number of general mechanistic observations may be made with a measure of validity. CVACis in the order of 20 per cent of CEIQS, but is based on the estimate of CVACby the sponsoring manager, so is not reliable in a general sense. CoPEIQdand CoPEIQsare within 0.1 per cent of each other; this is expected, since they are based on the same data set.
In a practical sense, it is estimated that the cost of poor EIQ is in the order of 10 per cent of the total operating budget for an asset of this scale - a significant number in any context. Immediate caution is advised, however, since this calculation is highly variable, with parameters such as asset type, location, and maturity having an influence. It can be said with confidence, however, that the cost of poor EIQ is not insignificant, and is worthy of consideration by management, which is the original intent of the study. This would be true, despite contentions over input data reliability or input assumptions. In fact, in this case, the five per cent confidence indicates to the sponsoring manager that the result is 95 per cent certain between $100 and $163 million dollars. Given that a remediation effort for an asset of this size may cost as much as $20 million, the return on investment is well justified, even at the lower confidence limit. The standard deviation is within 12 per cent of the median, which suggests a relatively homogeneous perspective on the part of the respondent population.
Figure 6 presents the high-level Pareto charts for the laboratory data; or, in other words, the areas of highest potential improvement. For the laboratory data used here, the greatest opportunity is in Productivity.
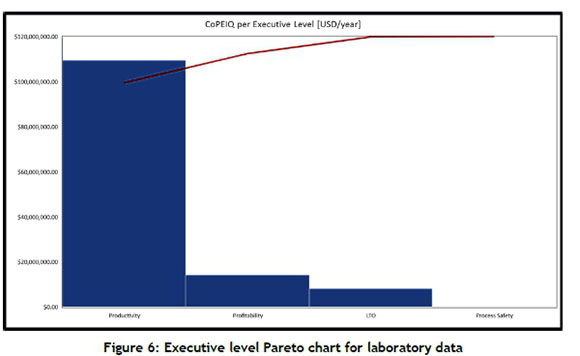
A Pareto chart was likewise drawn for the middle level of the taxonomy, where the results were (for the laboratory data set) in the following order of priority: EI overhead, planning process efficiency, engineering process efficiency, and asset production optimisation, followed by negligible items. Clearly these results will differ between assets.
6 CONCLUSIONS AND FUTURE RESEARCH
The primary conclusion drawn was that the research objective had been met and the solution proven in the field.
Many opportunities exist for further research. Examples are:
• The variables used in the CVACcalculation were deemed constants, but are themselves potential sources of Monte Carlo simulations.
• Excluded scope elements will add to the total benefit of improved EIQ by a large but unknown factor. The core methodology can be expanded to include more benefits with little effort.
• Poor EIQ is a small part of the EIQ problem. Much remains to be understood about the internal mechanisms and reasons that cause poor EIQ. A structured Bayesian network may be helpful to derive causal relationships and develop a predictive model.
• Research is required into preventing poor EIQ, an appropriate remediation strategy, and the definition of EIQ.
A final perspective is to view the behaviour leading to poor EIQ as a symptom of a larger problem, which also manifests elsewhere - for example, poor maintenance or design. Reason [7] contends that safety performance and commercial performance are related, because the psychological roots of these indices are the same. Could the same be said for poor EIQ?
REFERENCES
[1] Bureau of Safety and Environmental Enforcement (BSEE). 2011. BOEMRE releases report of investigation on BP's Atlantis platform [Online]. Available at: https://www.bsee.gov/site-page/bp-atlantis-report-march-2011 (Accessed: 28th April 2016). [ Links ]
[2] Haug, A., Zachariassen, F. & Van Liempd, D. 2011. The costs of poor data quality. Journal of Industrial Engineering and Management, 4(2), pp. 168-193. [ Links ]
[3] Eppler, M. & Helfert, M. 2004. A classification and analysis of data quality costs. MIT International Conference on Information Quality, November 5-6, 2004, Boston, MA. [ Links ]
[4] Marsh, R. 2005. Drowning in dirty data? It's time to sink or swim: A four-stage methodology for total data quality management. Database Marketing & Customer Strategy Management, 12(2), pp. 105-112. [ Links ]
[5] Fouhy, K. 1998. Managing plant data. Chemical Engineering, 105(1), pp. 135-138. [ Links ]
[6] Coopers & Lybrand. 1997. POSC/CAESAR for better business: Internal report to the POSC/CAESAR initiative. Oslo. [ Links ]
[7] Reason, J. 1990. Human Error. Cambridge: Cambridge University Press. [ Links ]
[8] CEN: The European Committee for Standardization. 2009. CEN Workshop Agreement, CWA 16180-1. 2009. The CEN ORCHID roadmap standardising information across the plant engineering supply chain - Part 1: Direction and Framework. Dublin, Ireland. [ Links ]
[9] Electric Power Research Institute (EPRI). 2014. Data-centric configuration management for efficiency and cost reduction: An economic basis for implementation. Palo Alto, CA. 3002003126. [ Links ]
[10] Gallaher, M.P., O'Connor, A.C., Dettbarn Jr., J.L. & Gilday, L.T. 2004. Cost analysis of inadequate interoperability in the U.S. capital facilities industry. Gaithersburg, MD: U.S. Department of Commerce Technology Administration. NIST GCR 04-867. [ Links ]
[11] Hamby, T. & Taylor, W. 2016. Survey satisficing inflates reliability and validity measures: An experimental comparison of college and Amazon Mechanical Turk samples. Educational and Psychological Measurement, 76(6), pp. 919-932. [ Links ]
[12] Farrington-Darby, T. & Wilson, J.R. 2006. The nature of expertise: A review. Applied Ergonomics, 37(1), pp. 17-32. [ Links ]
[13] Thawesaengskulthai, N. & Tannock, J.D.T. 2008. A decision aid for selecting improvement methodologies. International Journal of Production Research, 46(23), pp. 6721-6737. [ Links ]
[14] Ghosh, D. and Crain, T.L. 1993. Structure of Uncertainty and Decision Making: An Experimental Investigation*. Decision Sciences, 24: 789-807 [ Links ]
[15] Kroese, D.P., Brereton, T., Taimre, T. & Botev, Z.I. 2014. Why the Monte Carlo method is so important today. WIREs Comput Stat., 6(6), pp. 386-392. [ Links ]
[16] Mooney, C.Z. 1997. Monte Carlo simulation. Thousand Oaks, CA: Sage Publications. [ Links ]
[17] Hamburg, M. 1974. Basic statistics: A modern approach. 3rd edition. Harcourt Brace Jovanovich. [ Links ]
[18] Hines, W.W. & Montgomery, D.C. 1980. Probability and statistics in engineering and management science. 2nd edition. Wiley and Sons, New York. [ Links ]
[19] Gackowski, Z.J. 2009. Information quality survey seen from the perspective of operations. Proceedings of the 2009 International Conference on Computing, Engineering and Information (ICC 2009) held in Fullerton, California, USA. [ Links ]
Submitted by authors 23 Oct 2018
Accepted for publication 16 Oct 2019
Available online 12 Dec 2019
* Corresponding author ecoetzer@sun.ac.za

