Servicios Personalizados
Articulo
 Inglés (pdf)
 Articulo en XML
 Referencias del artículo
Indicadores

Links relacionados
-
 Citado por Google
 -
 Similares en Google
Compartir

 Permalink
South African Journal of Industrial Engineering
versión On-line ISSN 2224-7890
versión impresa ISSN 1012-277X
S. Afr. J. Ind. Eng. vol.30 no.4 Pretoria dic. 2019
http://dx.doi.org/10.7166/30-4-2192
GENERAL ARTICLES
An Integrated Approach Based On A Bi-Level Genetic Algorithm And A Combined Zonelp For The Facility Layout Problem
A. MohamadiI; S. EbrahimnejadII, *; R. SoltaniIII; M. KhalilzadehI
IDepartment of Industrial Engineering, Science and Research Branch, Islamic Azad University, Tehran, Iran
IIDepartment of Industrial Engineering, Karaj Branch, Islamic Azad University, Karaj, Iran
IIIDepartment of Industrial Engineering, KHATAM University, Tehran, Iran
ABSTRACT
In this study, a new integrated approach is presented to solve the facility layout problem with unequal areas in an open field. This approach includes a two-stage method and a bi-level genetic algorithm. In the first stage of the proposed method, the arrangement of departments adjacent to each other is determined by an improved zone algorithm; in the second stage, the layout obtained from the first stage is improved by using a linear programming model, and the final locations of the departments are thus determined. This two-stage method is used in a bi-level genetic algorithm to achieve an appropriate layout. The orientation and aspect ratios of the departments are determined at the first level of the algorithm, and at the second level, the sequence of the departments is determined for the layout. The proposed approach is compared with the four approaches in the literature, by using 10 datasets in order to evaluate efficiency and performance. The quality of the proposed approach is confirmed by improving the best solutions obtained from previous studies in seven datasets. Furthermore, the presented approach obtains the best solutions from previous studies in the other three datasets.
OPSOMMING
'n Geïntegreerde benadering om die fasiliteitsbeplanningsprobleem met ongelyke areas in 'n oop veld op te los word voorgestel. Die benadering behels 'n tweeledige metode en 'n dubbele fase genetiese algoritme. In die eerste fase van die voorgestelde metode word die rangskikking van naburige departemente bepaal deur middel van n verbeterde sone algoritme. Die tweede fase verbeter die eerste fase se uitleg met 'n lineêre programmeringsmodel. Die uitset is die finale plasings van die departemente. Die tweeledige metode is gebruik binne n dubbelevlak geneties algoritme om die gewenste uitleg te bepaal. Die oriëntasie en aspekverhouding van die departemente word in die eerste vlak bepaal en die volgorde van die departemente in die tweede vlak. Die voorgestelde uitleg word met vier gepubliseerde benaderings vergelyk deur middel van tien datastelle. Die gehalte van die voorgestelde benadering is bevestig aangesien daar n verbetering in vergelyking met die beste bestaande oplossings getoon word in sewe van die datastelle. Die voorgestelde metode behaal ook dieselfde uitleg in die oorblywende drie datastelle.
1 INTRODUCTION
The facility layout problem is one of the most important issues in industrial environments, because a proper layout can lead to increased productivity, a good arranging of material flow, increased material flow speed, and finally, it can ease the production process. Simplifying the production process can also increase production and reduce production costs. Today, due to the development of a competitive environment among different organisations, and efforts to simplify the production process while lowering costs, it is necessary to pay attention to how facility layout is carried out. This has been an incentive for researchers to provide approaches in order to determine a good facility layout.
Using mathematical modelling is the best way to achieve an appropriate layout, based on the intended objective. Montreuil [1] presented an integer programming model that provided some heuristic methods to obtain appropriate solutions for this model. However, given the relatively small number of zero and one variables, the proposed model cannot find an optimal solution for more than five departments. Meller, Narayanan and Vance [2] modified the model provided by Montreuil [1]. The modifications included redefining the binary variables, and providing new constraints for departments. They also presented a number of valid inequalities solutions to enhance the performance of the model to solve large-scale problems. The initial model provided by them was named 'FLP2', and the developed model was named 'FLP2+'. However, these models were not able to solve problems with more than eight departments. Sherali, Fraticelli and Meller [3] presented effective strategies to improve the performance of FLP2+. They were able to develop this model in five sections. These were: new constraints for the department areas; the design of alternative methods to prevent the production of symmetric solutions; the presentation of a set of valid inequalities that increased the model performance; the development of a partial convex hull representation for disjunctive constraints; and finally, an outline to select variables for branching in the branch and bound algorithm. This model had the ability to solve up to nine departments. Konak, Kulturel-Konak, Norman and Smith [4] presented an integer programming model that could solve problems with up to fourteen departments using the flexible bay structure. Gai and Ji [5] proposed an integrated method to solve a healthcare FLP. First, their proposed approach generated a set of layouts by using a mathematical programming model that aimed at minimising the total transportation cost among all the facilities. Then the score of each alternative was calculated by using experts' opinions and considering the quantitative and qualitative criteria. It seems that the generation of some initial layouts - by considering only the transportation cost, and then the ranking of obtained layouts based on both quantitative and qualitative criteria - can lead to eliminating layouts that do not have the best scores for transportation cost, but have the highest scores for other criteria.
The mathematical models presented above cannot be used to solve problems with a large number of departments due to the large number of binary variables used to avoid overlapping facilities. In general, facility layout problems are NP-complete, and optimisation methods are useful tools to find the optimal solution for small problems. In other words, by increasing the size of the problem, computational time increases exponentially [6]. Therefore, there is a need for approximation algorithms to achieve good suboptimal solutions. These algorithms are divided into four categories: improvement, construction, metaheuristic, and artificial intelligence approaches [7]. In most studies, a combination of these algorithms has been used. Aiello, Enea and Galante [8] presented a two-stage approach to solve a multi-objective facility layout problem. In the first stage, they determined a set of Pareto optimal solutions using a genetic algorithm, and then determined the best layout using the Electre method, and according to the views of the experts. Paes, Pessoa and Vidal [9] presented two algorithmic approaches: a basic genetic algorithm and a hybrid genetic algorithm with a decomposition strategy. The second algorithm is the same as the first, except that a deconstruction process and a reconstruction process have been added. Tavakoli Moghaddam, Torabi and Ghaseminejad [10] presented a firefly algorithm to solve a multi-row facility layout problem. They also compared the results of this algorithm with the results of CRAFT software, an entropy algorithm, and a genetic algorithm with that of a heuristic process. García-Hernández et al. [11] proposed a multi-objective interactive genetic algorithm. The objectives were to minimise material handling costs and maximise the decision-maker's satisfaction based on qualitative criteria. They used a clustering method to perform a qualitative assessment of each layout in order to avoid excessive fatigue and pressure on the decision-maker. After clustering the different layouts, a representative from each cluster was selected and evaluated by the decision-maker. The point given to the representative was generalised to the other members of that cluster. Mohamadi, Ebrahimnejad, Soltani and Khalilzadeh [12] presented a two-stage approach to solve facility layout problems. Their proposed approach determined closeness ratings between facilities in the first stage, and facility layout using genetic algorithms and particle swarm optimisation in the second stage.
Recently, researchers have combined mathematical models and meta-heuristic algorithms to find better solutions in an acceptable computational time. Xiao, Seo and Seo [13] developed mixed integer programming (MIP) to design a facility layout with unequal areas, and with fixed input/output points. They also provided a two-step algorithm to solve this model for large-sized problems. In the first step, a zone algorithm was proposed to determine the approximate location of departments. A simulated annealing algorithm was also used to determine an appropriate placement sequence for facilities. In the second step, the locations of the facilities, which had been determined from the previous step, were improved by using a reduced MIP model. Xiao, Zheng, Zhang and Kuo [14] presented a two-phase method for facility layout with non-equal areas in terms of maximum aspect ratio. In the first phase, they used a method based on a zone algorithm that was developed by Xiao et al. [13] to determine the approximate locations of departments. They also used a simulated annealing algorithm to determine the appropriate placement sequence. In the second phase, given the approximate locations obtained from the first phase, and using a reduced MIP model, the exact dimensions and locations of the department were specified. Anjos and Vieira [15] comprehensively reviewed the studies conducted in the field of facility layout. Their study addressed three categories of layout problems: row layout, unequal-areas facility layout, and multi-floor layout.
Reviewing the previous studies shows that factors such as choosing the appropriate sequence of departments, determining the orientation and aspect ratios of the departments, arranging them adjacent to each other, and the proposed method to improve primary layout, can play a significant role in the quality of the layout obtained. Ignoring any of the above-mentioned factors leads to a dramatic reduction in the efficiency of the layout, which has been observed in the bulk of the previous studies. In this research, a comprehensive integrated approach is presented, with three main components focusing on the following topics:
1. Proposing a new two-stage method to solve the facility layout problem.
2. Proposing a bi-level metaheuristic algorithm to solve the facility layout problem.
3. Comparing the performance and efficiency of the proposed approach with a number of previous approaches.
This paper is organised as follows. The next section presents a two-stage method, including an improved zone algorithm and an MIP model to improve the solutions obtained from the improved zone algorithm. In Section 3, a bi-level genetic algorithm is proposed. A new integrated approach is presented in Section 4. In Section 5, the computational experiments are performed to determine the performance of the presented approach. Section 6 also includes conclusions and suggestions for future research.
2 TWO-STAGE METHOD
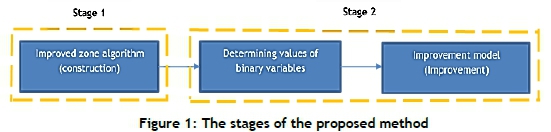
In this section, an improved zone algorithm is developed to determine the locations of the departments (construction stage). An MIP model, consisting of a set of binary variables in order to avoid the departments overlapping, is represented below. An algorithm is proposed to determine the values of the binary variables in this model by using the layout derived from the construction stage. A linear programming model is obtained from the MIP model by determining the values of these variables, and incorporating them in the model. This model is then used to improve the initial layout (improvement stage). The stages in this method are shown in Figure 1.
2.1 Improved zone algorithm
Given the predetermined placement sequence, the algorithm presented in this subsection determines the locations of departments one by one on the shop floor. In this algorithm, the first department in the sequence is located in the centre of the shop floor. The acceptable zones are then specified for the next department by using an improved zone algorithm. The steps of this algorithm are as follows:
Step 1: Determining feasible zones for locating the new department. A feasible zone is defined as a zone in which no department is located. Furthermore, it is a zone whose length and width are greater than the length and width of the next candidate department for the place of layout. Let Fi be the ith department in the sequence, for i = 1, n. Moreover, let Z(t) = (z{, ...,zj} be the set of feasible zones for locating this department, where J represents the total number of zones in Z(i). Refer to Xiao et al. [13] for details of determining feasible zones.
Step 2: Determining the candidate point for locating the new department using the centre of gravity method. The appropriate coordinates for locating a department among other departments, according to the predetermined objective, are found by using the centre of gravity method. Three advantages of this method include simplicity of calculation, taking into account existing departments, and minimising material handling costs. The centre of gravity point is calculated by using equations (1) and (2), and taking into account the flow of material between the next candidate department and the departments that have already been placed.
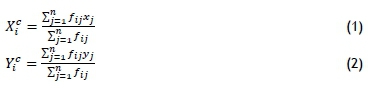
In the equations above, fi}is the flow of material between the ith next candidate department and the jth department (which has already been placed). Moreover, x, and y,- are the coordinates of the centre of the jth department, and Xciand Ylcare the coordinates of the point determined by the centre of gravity method for locating the centre of the ith department.
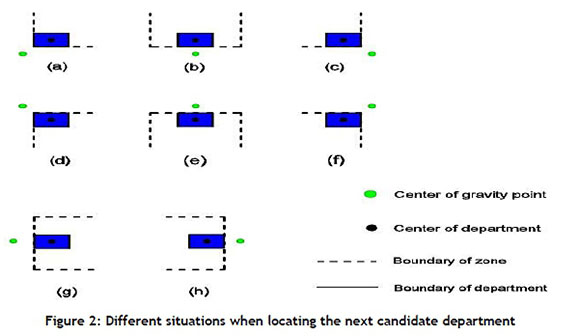
Step 3: Determining the least distance between the feasible zones and the centre of gravity. In this step, the ith department should be located in a zone that is the shortest distance from the centre of gravity point obtained from step 2. If the centre of gravity point is exactly within the desired zone, the centre of the next candidate department is the same point. If the centre of gravity point is determined outside the zone, eight different situations are created. The way of locating a new department for each of these situations is shown in Figure 2. After determining the location of the ith next candidate department in the jth zone, the distance between the centre of the ith department and the centre of the gravity point is calculated using the Euclidean distance measure, and is indicated by Dij.
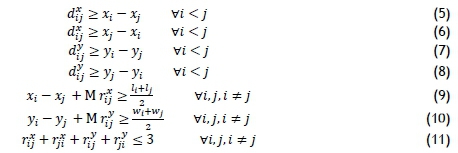
Step 4: Selecting a zone for locating the next candidate department. Given the distances obtained from step 3, to avoid adopting a greedy approach and to have a good exploration, the zone of locating the next candidate department is determined by using a roulette wheel selection. The probability of choosing each zone is calculated by using equation (3).
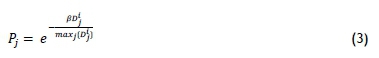
In the above equation, β is a constant value that determines the selection pressure. Large values of β provide about equal chances for selecting feasible zones. Furthermore, small values provide a greater opportunity for a zone that is a shorter distance from the centre of gravity.
2.2 Improvement model
After determining the initial locations for the departments, this subsection determines their final locations. The layout obtained from the previous subsection is improved by using the following mathematical model. The indices, parameters, and variables of the model are as follows:
Indices:
i, j Indices used to represent the departments, i = 1, N and j = 1, N
Parameters:
fijMaterial flow quantity from department i to department j (i=j).
Cij Cost of moving a unit load of material through a unit distance from department i to department j (iVj).
wi Width of department i
li Length of department i
M A large number
Variables:
dxij The distance between the centres of departments i and j along the horizontal axis
dyijThe distance between the centres of departments i and j along the vertical axis
(xi,yi) The coordinates of the centre of department i
rxijThe binary variable to denote whether department i is on the right or the left side of department j.
ryijThe binary variable to denote whether department i is above or below department j.
The proposed MIP model to determine the final locations of the departments is as follows:
Subject to:
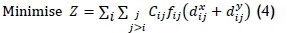
The objective function of Eq. (4) represents the total material handling cost. Constraints (5) to (8) determine the distance between the two departments along the x and y axes. Constraints (9) to (11) ensure that the two departments do not overlap. For example, if r£* = 0, it indicates that the department i is located on the right side of department j, and they are spaced apart along the x axis.
The model above is a mixed integer programming model. Due to the large number of binary variables (2n(n-1)), there is a lot of computational complexity and nondeterministic polynomial time to solve this model, and so this model cannot be used to solve large-scale problems. In order to enable this model to solve large-scale problems, the binary variables are converted to a set of parameters by using the results obtained from the improved zone algorithm. The steps of this stage are as follows: Step 0: Consider the departments i and j. Put i = 1 and j = 2
Step 1: Use the equations (12) and (13) to determine the DisX and DisY values.
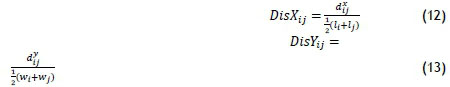
The values of , dxij,dyij, lj, w£ and wj have already been calculated by using the improved zone algorithm. If DisXtj > DisYitj go to step 2, otherwise go to step 3.
Step 2: If xi> x}, set rxij = 0, rxji= 1, rj = 1 , and r? = 1, otherwise set rfi = 1, rxij= 0, rj = 1 , and jýf = 1. Go to step 4.
Step 3: If y£ > yj, set r;y = 1, rxji = 1, rj = 0 , and r~ = 1, otherwise set rxij = 1, rxji = 1, rj = 1 , and rjiy = 0. Go to step 4.
Step 4: If j <N, set j = j + 1 and go to step 1, otherwise if i <N-1, set i = i + 1 and go to step 1, otherwise go to step 5.
Step 5: The values of all binary variables are now determined. Terminate the procedure.
In the next section, a bi-level genetic algorithm is presented. The application of this algorithm is to determine the appropriate length and width of the departments and the best placement sequence for the departments. In fact, the information needed for the two-stage method, such as the length and width of the departments, how to arrange them adjacent to each other, and the improvement to initial layout, are provided by two levels of this genetic algorithm.
3 BI-LEVEL GENETIC ALGORITHM
The genetic algorithm (GA) is one of the most effective algorithms based on population. Specific features of this algorithm make it impossible to consider it as a simple random search. In fact, the original idea of this method is taken from the evolutionary theory of Darwin, and its performance is based on natural genetics. The basic principles of GA were presented by Holland [16], and then developed by Goldberg [17].
In this section, a bi-level GA is presented. At the first level, a leader (orientation and proportion of departments) selects its action by considering a proper department sequence; and then, at the second level, a follower (department placement sequence) selects the best action with regard to the action chosen by the leader. In this algorithm, information obtained from each level is transferred to another level with an iterative approach, and two sub-populations evolve.
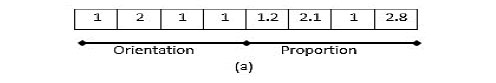
In GA, chromosome representation is one of the most important parts to have a significant effect on its performance. In the following, chromosome representation is presented for two levels of GA. The items that have been considered for chromosome representation for the higher level are as follows:
Orientation: A department can be placed horizontally or vertically parallel to the coordinate axes. Proportion: The appropriate height and width for each department should be considered in such a way that the best layout is achieved, proportional to the objectives determined. Furthermore, this ratio should be in the defined interval between maximum and minimum aspect ratios.
At the lower level, the chromosomes indicate the department placement sequence. In Figure 3, one example of chromosome representation is presented to show the information of four departments at two levels of GA. In the first part of Figure 3(a), numbers 1 and 2 indicate placing departments horizontally and vertically respectively. In the second part, each of the numbers indicates the aspect ratio of each department. In Figure 3(b), the department placement sequence shows that departments 3 and then departments 2, 1, and 4 will be placed respectively.
4 THE PROPOSED INTEGRATED APPROACH
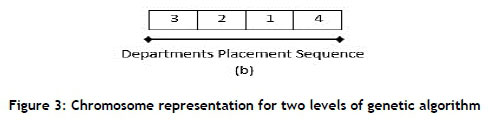
The proposed integrated approach strives to improve the two sub-populations of two defined levels of genetic algorithm gradually and through the periodic exchange of information. In general, to solve multi-level problems, using several sub-populations rather than one population leads to better solutions in less time [18]. In this study, the population of each level of problem is improved by an independent GA. The steps of the presented approach are indicated on the flow chart shown in Figure 4. The steps of this approach are as follows:
Step 0: Initialisation. Before starting to solve the problem, the values of the input parameters of the GA are determined for both levels of the problem. The number of generations on the flow chart is shown with MaxIteration1 for the first level and MaxIteration2 for the second level. Furthermore, PerIteration indicates the number of iterations of level 1 before starting iterations of level 2. Moreover, the population generated per generation and the rate of crossover and mutation are determined in this step.
Step 1: Determining the proper department placement sequence. First, one department is randomly selected to develop initial solutions to determine the department placement sequence. The next department in the sequence is selected so that the sum of material flow with the departments that have already been ordered is the highest. We will continue to determine the placement sequence of all the departments.
Step 2: Solving a higher level problem. In each iteration, according to the sequence obtained beforehand (if it is the first iteration, the sequence obtained from step one is considered; otherwise the sequence obtained from step three is considered), the GA is used to determine the proper orientation and proportion of the departments. Then, for each solution, the proper layout of the departments is indicated by using the improved zone algorithm presented in subsection 2.1. In this step, new solutions are generated by using crossover and mutation operators. Then these solutions are evaluated and sorted in ascending order based on the value of the objective function. A new population is chosen by using the selection strategy (μ + λ). In this selection strategy, the selection of parents is conducted from the union of the previous parents and the current offspring generated by those parents.
Step 3: Solving a lower level problem. With respect to the population obtained from Step 2, the GA is used to determine the proper department placement sequence. Then, for each solution, the layout is obtained by using the improved zone algorithm presented in subsection 2.1. In this step (for problems with a large number of departments (N>30)), after determining the locations of half of the departments, in order to improve the layout, the improvement model described in subsection 2.2 is implemented once. Then, like Step 2, the solutions are evaluated and sorted in ascending order according to the value of the objective function, and a new population is selected by using the selection strategy (μ + λ).
Step 4: Improving solution. In this step, the final layout obtained from the previous step is improved by using the improvement model described in subsection 2.2.
5 COMPUTATIONAL EXPERIMENTS
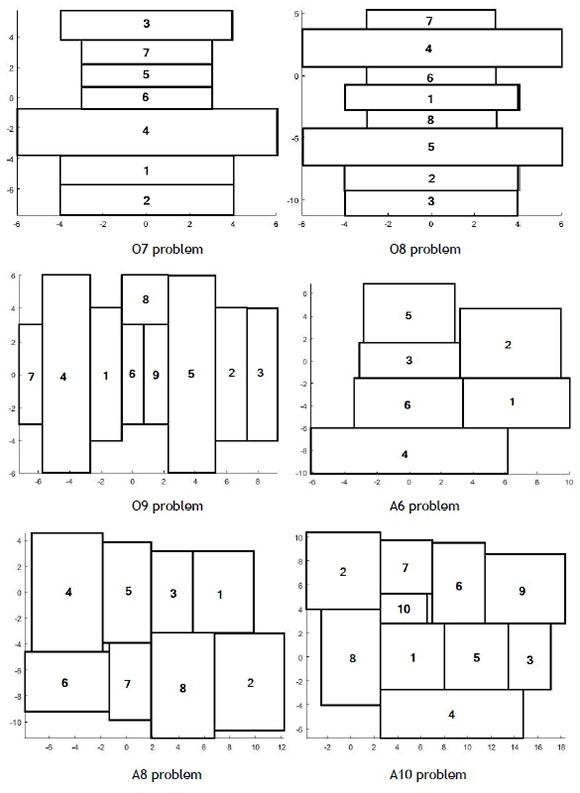
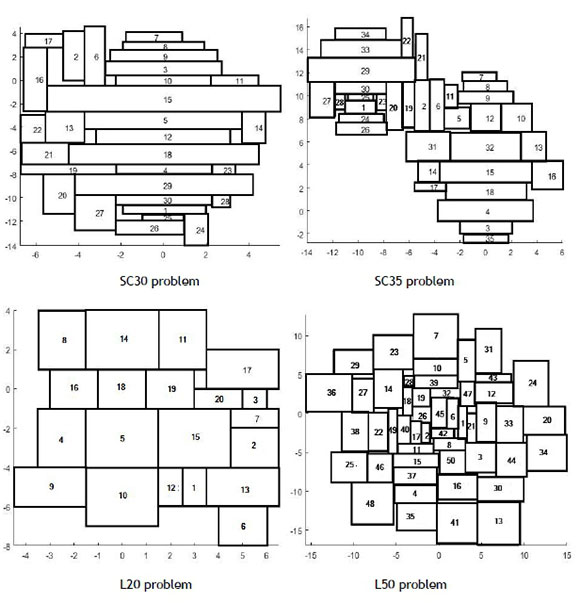
We use datasets provided by different researchers to examine the efficiency of the presented integrated approach. In the computational experiments, 10 datasets fall into three categories. The first category includes datasets O7 (with seven departments), O8 (with eight departments), and O9 (with nine departments) from Bozer and Meller [19], and two datasets with fairly large sizes: SC30 (30 departments), SC35 (35 departments), including information about two real problems in industry taken from Liu and Meller [20]. The second category includes datasets A6 (with six departments), A8 (with eight departments), and A10 (with 10 departments) taken from Mohamadi, Ebrahimnejad and Tavakoli-Moghaddam [21]. The third category includes datasets L20 (with 20 departments) from Imam and Mir [22], and L50 (50 departments) taken from the VIP-PLANOPT18 commercial software [23]. The rectilinear distance measure is used to calculate the distance between two departments for all datasets except L50. For the L50 dataset, the Euclidean distance measure is used.
The proposed bi-level GA has been executed 10 times for each of the problems. The values of the parameters for the first and second categories datasets, which include fewer than 30 departments, are MaxIteration1=100, MaxIteration2=20, PerIteration=50, population size=200, crossover probability=0.77, mutation probability=0.3.
Furthermore, for problems that include 30 or more departments, all parameters are the same as the previous one, except for MaxIteration1, which is 150. In practice there is no upper level for third category problems because they are a different type of problem for which the length and width of departments and orientation have already been specified. The values of the parameters for the lower level are MaxIteration2 = 300, population size = 100, crossover probability = 0.77, mutation probability = 0.3.
The MATLAB programming language, run on a Core i5-2450M 2.5 GHz PC, is used to code the proposed bi-level GA. Moreover, the proposed improvement model is coded in General Algebraic Modeling System (GAMS) 25.1. In the following, MATLAB and GAMS are linked to share information.
The performance of the approach presented in this study is compared with the approaches of Xiao et al. [14], Mohamadi et al. [21], McKendall and Hakobyan [24], and VIP PLANOPT 18 commercial software [23].
In Table 1, the results of the proposed approach and the results of the approach of Xiao et al. [14] are presented to solve the first category problems. As can be seen, these two approaches can be compared with each other regarding four aspects, as follows:
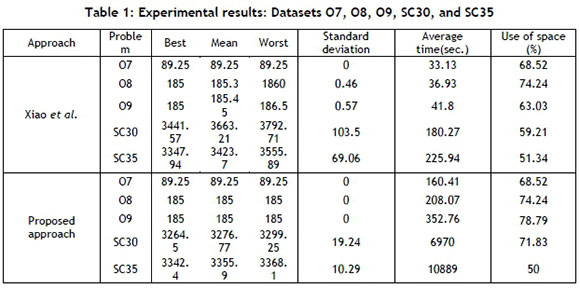
1. Quality of the obtained solutions: For datasets O7, O8, and O9, the best solution obtained by both approaches is the same, but for datasets SC30 and SC35, the proposed approach has been able to find better solutions. Furthermore, the best solutions obtained from the proposed approach are 5.14 per cent (177.1 units decrease in objective function) and 0.17 per cent (5.5 units) better respectively; the means of the solutions obtained from the proposed approach are 10.55 per cent (386.4 units decrease in objective function) and 1.98 per cent (67.8 units) better respectively; and the worst obtained solutions are 13.01 per cent (493.46 units) and 5.28 per cent (187.79 units) better respectively.
2. Robustness of approaches: A robust approach is one that has the least mean and standard deviation for the obtained results. As can be seen, the standard deviation for dataset O7 for both approaches is the same, but for datasets O8, O9, SC30, and SC35, the standard deviation obtained from the proposed approach is smaller.
3. Use of space: Maximum use of space is sought in the design of the facility layout. As can be seen, the use of space for datasets O7 and O8 resulting from both approaches is the same; but for datasets O9 and SC30, the use of space resulting from the proposed approach is 15.76 per cent and 12.62 per cent better respectively. Only for dataset SC35 is the use of space from the approach of Xiao et al. [14] about 1.34 per cent more than that from the proposed approach.
4. Computational time: Due to the proper balance between exploration and exploitation to achieve better solutions, the proposed approach takes longer to solve problems; this is inevitable. As shown in Table 1, the computational time for dataset SC35, which consists of 35 departments, is about three hours. Because facility layout planning is not a problem that is solved daily, and a layout usually remains unchanged for months or even years, it seems quite reasonable to spend a few hours to reach low-cost layouts.
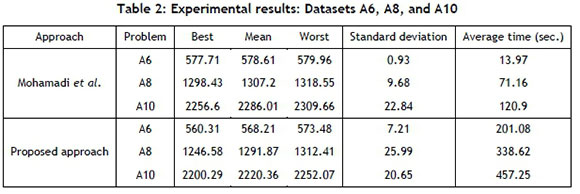
In Table 2, the results of the proposed approach and the results of the approach of Mohamadi et al. [21] are presented to solve the second category problems. As can be seen for all three datasets, the proposed approach has obtained better solutions. The means of the solutions obtained from the proposed approach for datasets A6, A8, and A10 are 1.8 per cent (10.4 unit decrease in objective function), 1.17 per cent (15.33 units), and 2.9 per cent (65.65 units) better respectively.
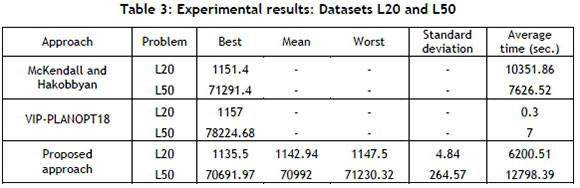
The results obtained to solve the third category datasets for the approach of McKendall and Hokobyan [24], the VIP-PLANOPT18 software [23], and the proposed approach are presented in Table 3. Since the means of the solutions and the worst solutions obtained from the first two approaches are inaccessible, the comparison has been drawn only between the best solutions. The best solutions obtained by the proposed approach for problems L20 and L50 are 1.4 per cent (15.9 units decrease in objective function) and 0.84 per cent (599.43 units) better than the McKendall and Hokobyan [24] approach respectively; and 1.86 per cent (21.5 units) and 9.63 per cent (7532.7 units) better than the VIP-PLANOPT18 software [23] respectively. The best layout solutions obtained from our proposed approach for all datasets are shown in Appendix 1.
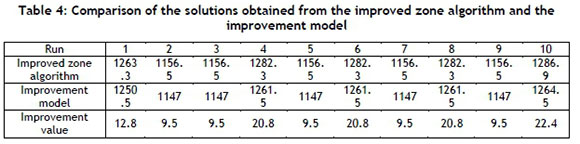
In order to analyse the results further, a comparison has been made between the solutions obtained from the two stages of the method presented in Section 2. Dataset L20 has been considered for this comparison. In this case, the length and width of the departments have already been determined, and the best departments sequence has been obtained by using the genetic algorithm. This comparison has been drawn 10 times, with the results presented in Table 4. As can be seen at every 10 runs, the improvement model has improved the solutions obtained from the zone algorithm. The average improvement is 14.51 units.
In Figures 5 and 6, the layouts obtained from the first and second runs are shown respectively. Figures 5a and 6a show the layouts obtained from the improved zone algorithm, and Figures 5b and 6b show the layouts obtained from the improvement model.
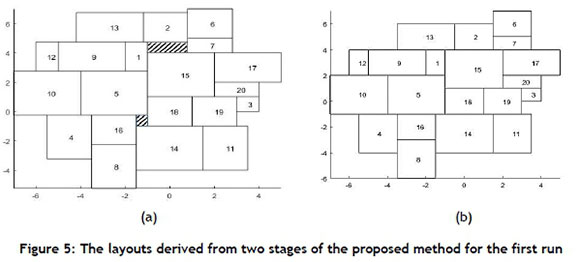
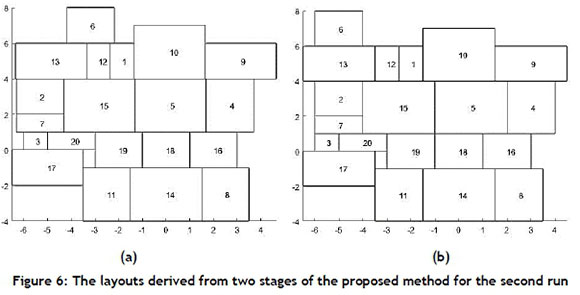
As can be seen in Figure 5, the improvement model has been able to eliminate empty space between departments 5, 18, 14, and 16, and it has also been able to eliminate empty space between departments 1, 2, 7, and 15 by setting their locations. Consequently, the material handling cost has been reduced from 1263.3 to 1250.5. Furthermore, in Figure 6, the improvement model has been able to reduce the material handling cost from 1156.5 to 1147 by changing the location of department 6.
6 CONCLUSION AND FUTURE RESEARCH
In this study, a new integrated approach was proposed to determine facility layout with unequal areas in an open field. This approach is based on a solution method that includes two stages; the improved zone algorithm and improvement model, and a bi-level GA. At the first level of the GA, the orientation and aspect ratios of the departments are determined, and at the second level, the departments placement sequence is determined. Ten datasets were considered to validate the proposed approach. The results of the proposed approach were compared with the results of the four approaches in the literature. The proposed approach has been able to improve the best solutions obtained from previous studies in seven datasets. The maximum improvement rate is 9.6 per cent. In the other three datasets, the proposed approach was able to achieve the best solutions obtained in previous studies. The obtained results indicate the superior quality of the obtained solutions compared with those from the previous approaches.
Further research that could be done in the future to develop the presented approach is as follows:
Adding a material handling system, and selecting the category and type of material handling equipment for transportation between different departments are both lines for future research. Determining input/output points for each department can be scrutinised in the future. Minimising dead space can be considered an objective, in addition to minimising material handling costs. Qualitative criteria, such as environmental communication, supervision communication, etc. can also be considered in the objective function of the problem in the form of a closeness rating between the facilities; and the trade-off between these criteria can also be an attractive topic for future research.
REFERENCES
[1] Montreuil, B. 1991. A modelling framework for integrating layout design and flow network design. In: Proceedings from the material handling research colloquium, Hebron, Kentucky, pp. 43-58. [ Links ]
[2] Meller, R.D., Narayanan, V. & Vance P.H. 1998. Optimal facility layout design. Operations Research Letters, 23(3-5), pp. 117-127. [ Links ]
[3] Sherali, H.D., Fraticelli, B.M.P. & Meller, R.D. 2003. Enhanced model formulations for optimal facility layout. Operations Research, 51(4), pp. 629-644. [ Links ]
[4] Konak, A., Kulturel-Konak, S., Norman, B.A. & Smith, A.E. 2006. A new mixed integer programming formulation for facility layout design using flexible bays. Operations Research Letters, 34(6), pp. 660-672. [ Links ]
[5] Gai, L. & Ji, J. 2019. An integrated method to solve the healthcare facility layout problem under area constraints. Journal of Combinatorial Optimization, 37, pp. 95-113. [ Links ]
[6] Vitayasak, S., Pongcharoen, P. & Hicks, C. 2017. A tool for solving stochastic dynamic facility layout problems with stochastic demand using either a genetic algorithm or modified backtracking search algorithm. International Journal of Production Economics, 190, pp. 146-157. [ Links ]
[7] Hoseini-Nasab, H., Fereidouni, S., Fatemi Ghomi, S.M.T. & Fakhrzad, M.B. 2018. Classification of facility layout problems: A review study. International Journal of Advanced Manufacturing Technology, 94(1-4), pp. 957-977. [ Links ]
[8] Aiello, G., Enea, M. & Galante, G. 2006. A multi-objective approach to facility layout problem by genetic search algorithm and Electre method. Robotics and Computer-Integrated Manufacturing, 22(5-6), pp. 447455. [ Links ]
[9] Paes, F.G., Pessoa, A.A. & Vidal, T. 2017. A hybrid genetic algorithm with decomposition stages for the unequal area facility layout problem. European Journal of Operational Research, 256(3), pp. 742-756. [ Links ]
[10] Tavakkoli-Moghaddam, R., Torabi, N. & Ghaseminejad, A. 2015. A quaternion firefly algorithm to solve a multi-row facility layout problem. International Journal of Engineering, 28(11), pp. 1605-1613. [ Links ]
[11] García-Hernández, L., Arauzo-Azofra, A., Salas-Morera, L., Pierreval, H. & Corchado, E. 2015. Facility layout design using a multi-objective interactive genetic algorithm to support the DM. Expert Systems, 32(1), pp. 94-107. [ Links ]
[12] Mohamadi, A., Ebrahimnejad, S., Soltani, R. & Khalilzade, M. 2019. A new two-stage approach for a bi-objective facility layout problem considering input/output points under fuzzy environment. IEEE ACCESS, 7(1), pp. 134083-134103. [ Links ]
[13] Xiao, Y., Seo, Y. & Seo, M. 2013. A two-step heuristic algorithm for layout design of unequal-sized facilities with input/output points. International Journal of Production Research, 51(14), pp. 4200-4222. [ Links ]
[14] Xiao, Y.J., Zheng, Y., Zhang, L.M. & Kuo, Y.H. 2016. A combined zone-LP and simulated annealing algorithm for unequal-area facility layout problem. Advances in Production Engineering & Management, 11(4), pp. 259-270. [ Links ]
[15] Anjos, M.F. & Vieira, M.V.C. 2017. Mathematical optimization approaches for facility layout problems: The state-of-the-art and future research directions. European Journal of Operational Research, 261(1), pp. 1-16. [ Links ]
[16] Holland, J.H. 1992. Adaptation in natural and artificial systems. Ann Arbor: The University of Michigan Press. [ Links ]
[17] Goldberg, D.E. 1989. Genetic algorithms in search optimization and machine Learning. Boston: Addison-Wesley Longman Publishing Co. [ Links ]
[18] Kheirkhah, A.S., Navidi, H.R. & Messi Bidgoli, M. 2015. Dynamic facility layout problem: A new bilevel formulation and some metaheuristic solution methods. IEEE Transactions on Engineering Management, 62(3), pp. 396-410. [ Links ]
[19] Bozer, Y.A. & Meller, R.D. 1997. A re-examination of the distance-based facility layout problem. IIE Transactions, 29(7), pp. 549-560. [ Links ]
[20] Liu, Q. & Meller, R.D. 2007. A sequence-pair representation and MIP-model-based heuristic for the facility layout problem with rectangular departments. IIE Transactions, 39(4), pp. 377-394. [ Links ]
[21] Mohamadi, A., Ebrahimnejad, S. & Tavakkoli-Moghaddam, R. 2018. A novel two-stage approach for solving a bi-objective facility layout problem. International Journal of Operational Research, 31(1), pp. 49-87. [ Links ]
[22] Imam, M.H. & Mir, M. 1993. Automated layout of facilities of unequal areas. Computers & Industrial Engineering, 24(3), pp. 355-366. [ Links ]
[23] VIP-PLANOPT18. Engineering optimization software from www.planopt.com, accessed December 20, 2018. [ Links ]
[24] McKendall Jr., A.R. & Hakobyan, A. 2010. Heuristics for the dynamic facility layout problem with unequal-area departments. European Journal of Operational Research, 201 (1), pp. 171-182. [ Links ]
Submitted by authors 3 Jun 2019
Accepted for publication 5 Nov 2019
Available online 12 Dec 2019
* Corresponding author: ibrahimnejad@kiau.ac.ir
APPENDIX 1
The best layouts obtained by the presented approach for different datasets