


Services on Demand
Article
 English (pdf)
 Article in xml format
 Article references
Indicators

Related links
-
 Cited by Google
 -
 Similars in Google
Share

 Permalink
South African Journal of Industrial Engineering
On-line version ISSN 2224-7890
Print version ISSN 1012-277X
S. Afr. J. Ind. Eng. vol.30 n.4 Pretoria Dec. 2019
http://dx.doi.org/10.7166/30-4-2178
GENERAL ARTICLES
Application Research Of A Technology Evaluation Method Based On Entropy Weight And Cloud Theory
B. Yongyan*; W. Delun; S. Yuan; G. Yuan; Z. Hao
School of Mechanical Engineering, Dalian University of Technology, China
ABSTRACT
In order to solve the technical evaluation problem of key scientific and technological research and development projects, this article uses the technology evaluation method of entropy weight cloud theory to evaluate the project. The index is selected according to the 'DISCOW' construction principle, policy guidance method, and shortest distance method. The information contribution degree is used to verify the index system. The entropy weight-Analytic Hierarchy Process is adopted to determine the weights of the indicator layer and the criterion level indicators. The evaluation method is verified with the key technology research and development project (equipment manufacturing industry) of Dalian Jin pu New Area (state-level new areas) in 2018. The results show that the technology evaluation method of the entropy weight cloud theory is simple and practical. It can effectively convert qualitative and quantitative evaluations. The evaluation results are objective and consistent with the final evaluation results of actual projects. It demonstrates a good evaluation and forecasting ability. It can be used as the theoretical basis and method to evaluate projects in government science and technology departments, and in enterprises previous compliance projects
OPSOMMING
Hierdie artikel maak gebruik van 'n entropiegewig wolkteorie tegnologie evalueringsmetode om die tegniese evalueringsprobleem van sleutel wetenskaplike en tegnologiese navorsing- en ontwikkelingsprojekte op te los. Die indeks is gekies volgens die 'DISCOW' (dinamies, onafhanklik, wetenskaplik, volledig, objektief en werkbaar) konstruksiebeginsel, die beleid-riglynmetode en die kortste afstand metode. Die graad van informasie bydrae word gebruik om die indekssisteem te verifieer. Die entropie geweegde analitiese hiërargie proses is gebruik om die gewigte van die aanwyser- en die maatstaf-vlakke te bepaal. Die evalueringsmetode is geverifieer met die sleutel tegnologie navorsing- en ontwikkelingsprojek van n toerustingvervaardigingsindustrie in Sjina in 2018. Die resultate toon dat hierdie tegnologie evalueringsmetode eenvoudig en prakties uitvoerbaar is. Dit kan kwalitatiewe en kwantitatiewe evaluasies doeltreffend omskakel. Die evaluasie resultate is objektief en konsekwent met die finale evaluasie resultate van werklike projekte. Dit demonstreer n goeie evaluasie- en voorspellingsvermoë en kan gebruik word as die teoretiese grondslag en metode om projekte in regeringsdepartemente van wetenskap en tegnologie te evalueer.
1 INTRODUCTION
"Innovation is the soul of a nation's progress and is an inexhaustible driving force for the prosperity of a country."[1] science, technology, and innovation (STI) is related to the future and destiny of our country. It is an important guarantee for promoting the healthy development of the country' s science and technology undertakings, promoting the optimal allocation of science and technology resources, and improving the level of the science and technology management of enterprises. The merits of STI projects are an important symbol of the level of scientific and technological output. It is a measure of the industrial level of STI. To do a good job in evaluating STI projects is the most important thing to improve the level of STI in the country.
According to the " Global Innovation Index 2018" report, released by New York City, China ranks 17th in innovation among 126 economies. There is still a big gap between China and other innovative countries in the world. It is the top priority of China's STI undertakings to catch up with innovative countries in the world and to improve its overall national strength. From the point of view of the driving force that STI plays in economic and social development, the problem is that STI has not been closely combined with the needs of the market, and industrial development has not been well addressed. STI projects originate mainly in research institutes, institutions of higher learning, and other enterprises and institutions. "The Decision on Improving the Work of Scientific and Technological Evaluation" and "The Measures for Scientific and Technological Evaluation" of the Ministry of Science and Technology have made detailed classifications from STI projects at the national level. This paper takes the enterprise as the research object, which is the main executive department of the international R & D activities of UIs [2], the main creator of the national economy [3], and the main body of R & D expenditure. The related literature [4] containing statistics of the number of the legal entities in China in 2017 shows that there are about 22.01 million, of which 82.23 percent are corporate legal persons. The national R&D total expenditure in 2018 was 1760.6 billion Yuan, of which 76.48 percent was corporate R&D expenditure. Enterprises are both the main body of both the market and STI. Raising the level of STI in enterprises will effectively promote China's STI capabilities, and take the technical evaluation of STI projects of enterprises as the research point. This study is comprehensive and complex, and relies on the evaluation of multiple factors and multiple decision indicators. It is necessary to establish a scientific, complete, and universal evaluation index system to carry out technical evaluation.
Domestic and foreign scholars have performed a lot of research on technology evaluation [5], but they have not established an evaluation system for STI based on an enterprise science and technology industrialisation project. The evaluation index of STI is redundant, and reflects much information duplication. Qualitative evaluation is used more often by experts employing experience-based evaluation; this method lacks a scientific and objective basis. Based on the problems above, this paper uses qualitative indicators to quantify the number of evaluation indicators for STI, it is not easy to obtain data indicators from similar methods to obtain quantitative indicators. The shortest distance method is constructed to screen the evaluation indicators quantitatively. The index weights of indicator layers are calculated according to the entropy weight method. The AHP method is used to determine the weight of the indicator at the criterion level. The constructed cloud theory model formula is used to calculate the total index weight of the target layer and to determine the technical evaluation result of the project.
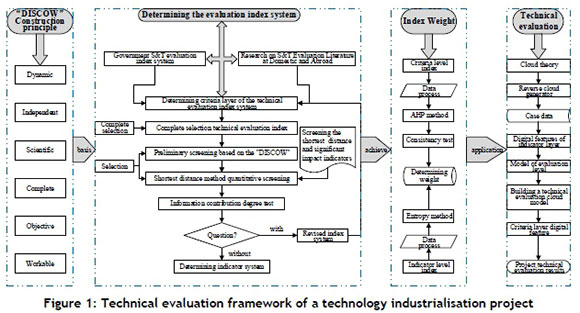
2 TECHNICAL EVALUATION FRAMEWORK OF TECHNOLOGY INDUSTRIALISATION PROJECT
Combined with the actual characteristics of the objective reality and the industrialisation project of science and technology, the 'four-stage' collaborative drive model from a complete selection, preliminary screening, selection, and inspection was constructed to screen and evaluate the indicators systematically. In the screening of qualitative indicators, based on the 'DISCOW' construction principle, the 'policy guidance method' was proposed for preliminary screening. Using this method, the following characteristics need to be investigated:
1. Whether it is in line with the encouraged and permitted categories of the strategic emerging industry guidance catalogue.
2. Fixed asset investment projects of STI must consider environmental impact assessments, energy assessments, safety assessments, and fire protection.
3. Complete selections based on the government's large-scale data on scientific and technological assessment indicators are more conducive to the approval rate of the filing or establishment of STI projects.
Through the technological innovation activities of technological innovation enterprises, taking a market demand project as the source, transforming the results, and realising the value of the project is the end point. It is necessary to maximise the benefits of the project and minimise the risk of decision-making in projects; it is necessary to realise the economic benefits of the project itself, and realise the social value created by the project; and it is necessary to comprehend the market demand drive and understand the government's policy orientation to carrying out scientific research. To this end, qualitative and quantitative screening methods are used to determine the technical evaluation indicators. The detailed technical evaluation process is as follows:
3 CONSTRUCT EVALUATION INDEX SYSTEM
3.1 Set construction principle of evaluation indicator
The evaluation index directly determines the accuracy of the evaluation results, and the construction principle of the evaluation index system is the basis for the evaluation of scientific and technological projects. In order to ensure that the evaluation index for construction research satisfies the objective reality, and has universal applicability, considering the needs of the company's STI project filing and evaluation, this article proposes six rigid standard all-inclusive principles with a clear and concise content. It not only meets the scientific requirements, but also satisfies the principle of universality. It is thus more scientific and reasonable, and avoids information redundancy. From the words dynamic, independent, scientific, complete, objective, and workable, it is known as the "DISCOW" principle. A detailed explanation of the six construction principles can be found in the relevant literature.
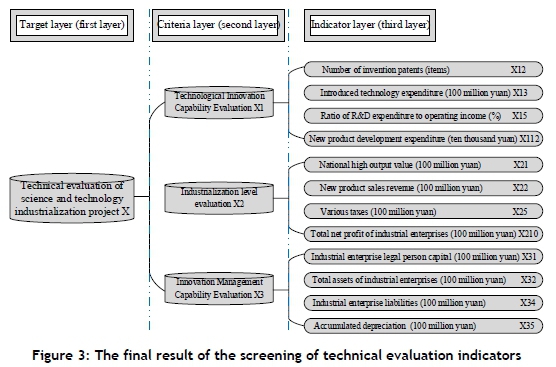
3.2 Determining the evaluation index system
The complete selection of technical evaluation indicators for science and technology industrialisation projects is based mainly on the collection of domestic and foreign official authorities, and on the scientific and technological academic literature. Forty-two primary evaluation indicators are selected from the following: "Decisions on improving scientific and technological evaluation work"; "scientific and technical evaluation methods(trial)"; "China's statistical yearbook"[3]; "China's science and technology statistical yearbook"[4]; OECD's major scientific and technical indicators [6]; EU's innovation alliance scoreboard [7]; national scientific and technological statistical indicators; evaluation methods of S&T SMEs; project decision analysis and evaluation [8]; economic benefits evaluation indicators system of Ministry of Commerce; evaluation index system of enterprise innovation capability; "high-tech enterprise certification management work guidelines; "evaluation index system of enterprise technology centre; evaluation index system of national engineering research centre; "evaluation theory and method of technical project [9]; "modern comprehensive evaluation method and case selection [10]; national high-tech enterprise main economic indicators; statistics annual report of national technical market [11].
3.2.1 Screening evaluation indicators using the shortest distance method
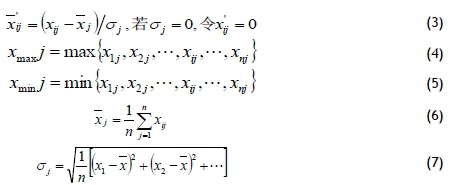
The basic formulation for this method [12] is: We treat each evaluation index as a class, then determine the similarity based on the distance between one class and another. The classes with the greatest similarity are then merged, and then the similarity between the new class and the remaining classes is calculated. After this we continue to select the most similar classes, merge them, and so on, until all the indicators are combined into one category. The use of the shortest distance method [13] relies on the equivalence principle, that the shortest distance is comparable to the greatest degree of similarity. The index is screened according to the preset critical distance. The mathematical model of the shortest distance is constructed as follows:

In the formula, αρ takes 1 /2, αq takes 1 /2, ytakes 1 /2.
There are n indicators; the distance between the ith index and the jth index is represented by dij, and the distance between the initial indicators Gp and Gq is Dpq, namely: 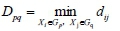
Set the indicators Gp and Gq to merge into a new category of Gr, then the distance between any class of Gk and Gr is:

The steps are as follows:
1. The n original indicator data elements are standardised, and the evaluation indices of different properties are solved to ensure the reliability of the evaluation results.
The Z-score standardisation method [12] is used here:
2. Calculate the distance between the two indicators, and construct the distance matrix D (0) . The original index is a class, and Dij=dij0
3. Find the non-diagonal minimum element of D (0) , set to dpq, merge Gp and Gq into a new class Gr, namely:
Gr= {Gp, Gq} The distance formula between the new class and other classes:Dkr=min {Gkp, Gkq} .
4. Combine the pth and qth rows and the p and q columns in Dp into a new row and new column by the above formula, corresponding to G, and the obtained matrix is denoted as D(1).
5. Repeat D (2) for D (1) above steps 2 and 3; and so on until all elements are combined into one class.
Note: If there is more than one element with the smallest off-diagonal line in a step D (k), the classes corresponding to these shortest distances can be merged at the same time.
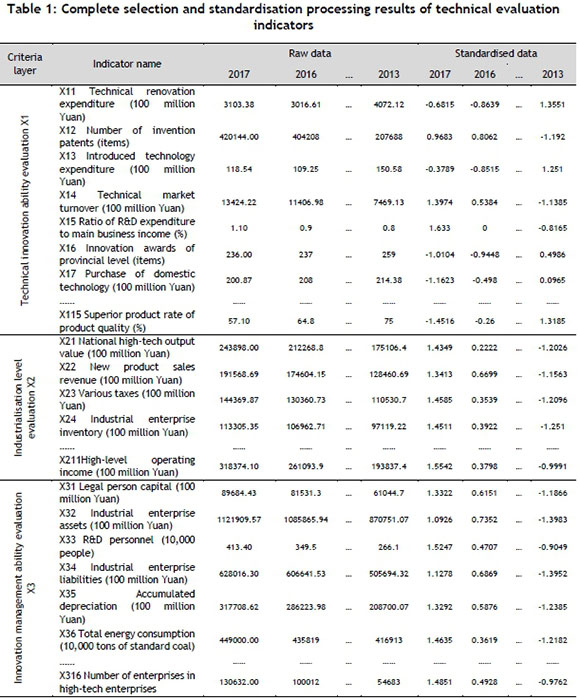
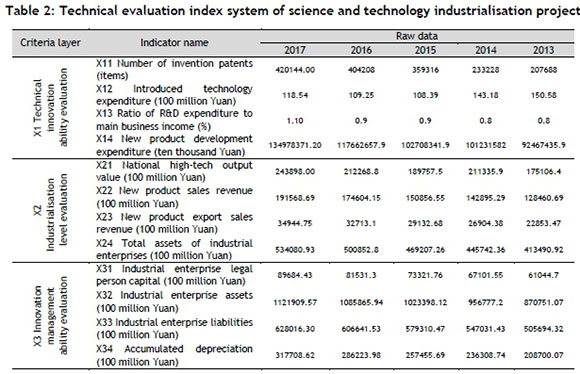
First, the 42 original data indicators from the primary selected are standardised according to formulae (3) to (7). Because the values, units, and expressions of the original data are different, there is no comparability, so the impact of the inter-indicator dimension must be eliminated. The standardised data is shown in Table 1.
Second, according to the five steps of formulae (1) and (2) and the shortest distance method, 42 quantitative indicators in the indicator layer are screened according to the three hierarchical indicators set by the criterion layer, and a statistical analysis is performed using SPSS Statistics25 software. The Wald method [14] is used to calculate the shortest distance between the indicators, and a minimum of two categories and a maximum of four categories of classification result indicators are generated for the category. The calculation results are shown in Figure 2. The entire clustering process and results can be observed visually. The vertical value in the figure is the relative distance of the category combination. It is the maximum distance between the categories, as the relative distance is 25, and the remaining distances are converted into the relative distances to compare with them.
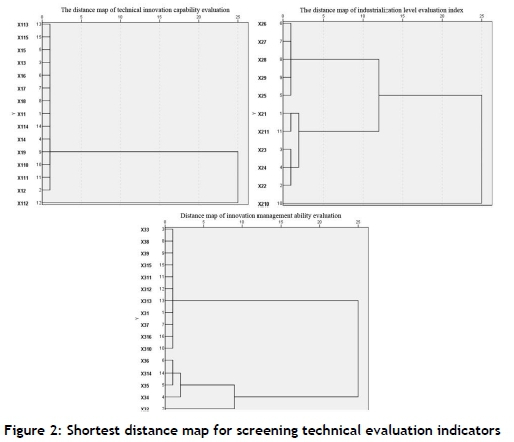
The leftmost column of Figure 2 is the evaluation index; the length of the line in the figure indicates the relative distance between the categories; according to the principle of the shortest distance, this represents the greatest similarity. For example, in the first picture in the upper left corner, the distance of the evaluation indicators X11, X12, X13, X14 , X15, X16, X17, X18, X19, X110, X111, X113, X114, and X115 is the shortest, and the degree of similarity is the largest, so this information is redundant. Deleting X11, X13, X14, X15, X16, X17, X18, X19, X110, X111, X113, X114, and X115, we therefore retain X12, delete X211, and retain X21. By analogy, the last remaining evaluation indicators are: X12, X112, X21, X22, X25, X210, X31, X32, X34, and X35.
Finally, considering that the quantitative screening indicators are based on the difference in the indicator data, the indicators may be deleted accidentally because of the small difference in the given data. At the same time, the objective quantitative screening method relies too much on the indicator data, and it is easy to ignore the actual meaning of the indicators, which will also lead to some representative indicators having been deleted by mistake.
This article aims to solve the STI evaluation of the 2018 key science and technology research and development plan project of Dalian Jinpu New Area of China. According to the requirements of the "Dalian key technology R&D plan management measures (trial)", and "Considering the cooperation projects between enterprises and universities and research institutes; the total R&D investment of the project is more than 2 million Yuan". To this end, it is necessary to supplement the relevant evaluation indicators rationally, including: introduced technology expenditure (100 million Yuan) X13, and the ratio of R&D expenditure to operating income (percent) X15.
3.2.2 The test of indicator screening result
Using the method of determining the information content [15] of the indicator system, we set the covariance matrix of the S-indicator data, then obtain the trace of the trS-covariance matrix that is, the sum of the data on the main diagonal of the covariance matrix, and the number of s-final indicators. H is the number of original indicators, and the information contribution degree of the final indicator to the original indicator is:

That is, the information of h complete-selection indicators is reflected by the s-screened indicators, and the larger value indicates that the indicator system is more reasonable.
Judging criteria [16]: If the indicator system can reflect about 90 percent of the original information with about 30 percent of the indicators, the indicator system is constructed reasonably.
We calculate the variance of 42 indicators of the original data in Table 1, and the variance of trSh=3.757E-8, and the 12 indicators after screening and trSs=3.317E-8, and substitute into formula (8) to obtain the post-selection index relative to the complete selection index. The information contribution degree is: In=trSs/trSh=88.3 percent, that is, the selected 12 evaluation index systems can reflect 88.3 percent of the 42 original index systems of the complete selection. Then, the indicators of 12/42=28.6 percent can reflect 88.3 percent of the original index information and meet the judgement criteria. Therefore, it is reasonable to use the shortest distance method to construct a comprehensive evaluation index system for science and technology industrialisation projects.
4 ENTROPY WEIGHT-AHP TO DETERMINE THE WEIGHT COEFFICIENT OF EVALUATION INDEX
4.1 Basic principle of entropy weight method
Entropy [17] can be used to reflect the degree of variation of the indicator for technical evaluation. There are m objects to be evaluated and n evaluation indicators to form the original index data matrix X= (Xj) mxn. For a certain index Xj, the larger the difference of the index value Xj, the larger the amount of information provided by the index, the greater its role in the technical evaluation, the smaller the corresponding entropy value, and the greater the weight; otherwise, the weight of the indicator is also smaller. If the indicator values are all equal, the indicator does not work in the technical evaluation.
4.2 The calculation step of entropy weight
1. Select n objects to be evaluated, m indicators, and then the value of the jth indicator of the ith object is xij(i=1, 2…,n;j=1,2,…,m);
2. Standardisation of indicators: homogeneity of heterogeneous indicators. Because the units of measurement of each indicator are not uniform, they must be standardised before the calculation, that is, the absolute value of the indicator is converted into a relative value, thereby solving the homogenisation problem of different quality index values. Moreover, since the positive indicator and the negative indicator value represent different meanings (That is the better for the larger positive indicator values and the smaller of the negative indicator values). Therefore, we use different algorithms for the standardisation of the positive and negative indicators. The specific method is as follows:
Positive indicators:

Negative indicators:

Then the value of the jth indicator of the ith object is xij (i=1, 2..., n; j=1, 2,..., m). The standardised data is still recorded as xij;
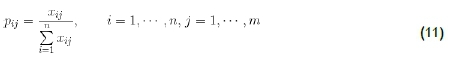
3. Calculate the proportion of the ithobject in the index under the jthindicator:
4. Calculate the entropy of the jthindicator:
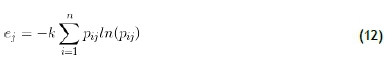
Among them 
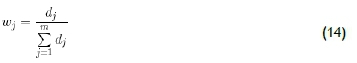
5. Calculate redundancy of information entropy:
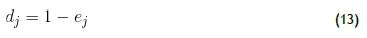
6. Calculate the weight of each indicator:
4.3 Weight calculation of index level indicator
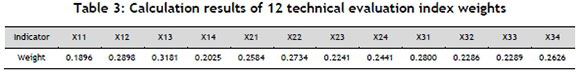
According to the data provided in Table 1 and Table 2, and the final 12 evaluation indicators, calculated according to formulas (9)-(14), the weights of the 12 index indicators have been determined. Here, Matlab R2014a is used for programming calculations. The results are shown in Table 3.
4.4 Determine the weight of the criterion layer index by the AHP method
The AHP method [18] is the most mature and widely used multi-target weight determination method. It combines qualitative and quantitative methods, it has a certain reliability and scientific basis, and the weight determination is more realistic and reasonable. Here, the weight of the criterion layer index of the evaluation index system is determined by the AHP analysis method. The calculation steps and results are as follows:
1. Create judgement matrix
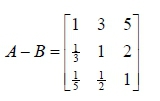
The three evaluation indicators of the criteria layer B1, the technical innovation capability evaluation; B2, the industrialisation level evaluation; and, B3, the innovation management capability evaluation are determined. Then, the judgement matrix A-B is established relative to the degree of importance of the technical evaluation index of the key science and technology research and development project of the target layer A for Jinpu new area.
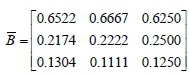
2. Normalise the items of the judgement matrix, according to  get
get
3. Add the matrix B by row, to get 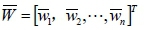
Among them,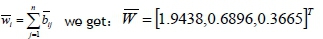
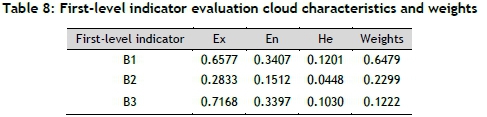
4. The vector W is normalized to obtain the weight vector set of the three indicators in the criterion layer. W ={0.6479,0.2299,0.1222}
5. Consistency test
Use CI as an indicator to test the consistency of the judgement matrix:
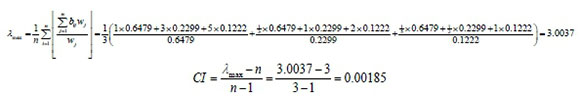
When n=3, the correction coefficient RI=0.58, so 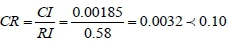
Pass judging the consistency test.
5 TECHNICAL EVALUATION OF KEY R&D PROJECTS BASED ON CLOUD THEORY [19]
The cloud model was originally designed to solve data mining problems, and was then applied widely in knowledge expression, system evaluation, algorithm improvement, decision support, and intelligent control [20]. In most of these areas the cloud model, performed well. Most of the evaluation methods we are familiar with have inaccuracies and deviations from the will of decisionmakers. They apply the technical evaluation advantages of cloud models, and have the attributes of seamlessly transforming qualitative and quantitative indicators. They calculate the formula for obtaining the technical evaluation cloud model of scientific and technological innovation projects.
5.1 Cloud model composition
A cloud is a three-dimensional vector with a three-dimensional space. It is generally composed of at least three digital features [21]: expected value (Ex), entropy (En), and super entropy (He).
1. Expected value Ex. This is the highest point of the graph on the cloud map, called the central value, and the meaning is the concentrated reflection of the index value on the domain coordinates. Ex's membership is 1, which represents the centre of gravity of the cloud.
2. Entropy En. Entropy measures uncertainty, and is the extent to which cloud droplets are accepted in the indicator domain. Its acceptance range is directly proportional to the span of the cloud. The larger the acceptance range, the wider the span of the cloud, and the more the corresponding evaluation object can be recognised. Nevertheless, the larger the span, the more obscure the evaluation object.
3. Super entropy He. Super entropy measures the uncertainty of entropy, indicating the degree of dispersion of all cloud droplets. The super entropy is proportional to the thickness of the cloud and inversely proportional to the degree of cohesion.
Note: The larger the value of He/En, the greater the dispersion of cloud droplets, and the greater the thickness of the cloud.
5.2 Two cloud generators
The forward cloud generator and the reverse cloud generator [22] are used to generate cloud droplets and to calculate digital features (Ex, En, He) of the cloud droplets, respectively.
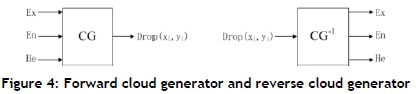
The trigger mechanism for the forward cloud generator is as follows:
First, generate a normal random number Ex' with En as the expectation and He as the variance. Second, generate a normal random number xi with Ex as the expectation and En as the variance; again, calculate the membership degree:
 then (x, u) is a cloud drop relative to the domain U. Select the commonly used 'bell'
function
 (a, b is a constant) as a membership function.
Finally, repeat the above steps until enough clouds are generated.
The reverse cloud generator is used to calculate the digital features of the cloud drop (Ex, En, He), and the reverse generator without membership information. The trigger mechanism is as follows: Assuming that the sample x has a capacity of n, calculate the sample mean X and S2;

5.3 Determining the evaluation set cloud model
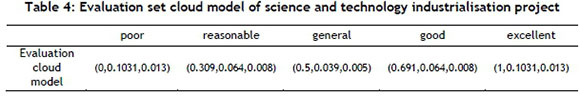
The project evaluation interval is set, and the evaluation level of the item under consideration is defined, The setting of the evaluated item level must be consistent with the setting of the evaluation set vector of the subsequent cloud computing theory. After generating a cloud map of each indicator, it is necessary to compare the results with the evaluation set to reach a conclusion. This paper uses the model-driven method based on the golden section rate [23] to generate an evaluation set, which is the optimal segmentation model in nature, This enables decision makers to evaluate the results better, especially for the division of the domain [0,1]. The smaller of the entropy and super-entropy of adjacent clouds is 0.618 times larger. The evaluation set of indicators is divided into five levels in the domain [0, 1]: excellent, good, general, reasonable, and poor; the corresponding digital characteristics of the cloud model are shown in Table 4.
After obtaining the weight matrix and the technical evaluation matrix, the two matrices can be combined into the corresponding cloud computation to obtain the technical evaluation cloud model. We compare the technical evaluation cloud with each evaluation cloud in the evaluation set cloud model. The evaluation set cloud model closest to the technical evaluation cloud centre of gravity is the final evaluation result. Finally, using MATLAB, the evaluation set cloud model and the project technical evaluation cloud model are simulated separately. The evaluation set cloud model closest to the cloud centre of gravity has the greatest impact on the technical evaluation results; this represents the final evaluation level of scientific and technological innovation projects.
5.4 Evaluation of key science and technology R&D projects in Jinpu New Area
Taking 10 key technology research and development projects in the equipment manufacturing field declared by Dalian Jinpu New Area in 2018 as an example to conduct a technical evaluation, determine the final evaluation level of each project and appraise it. In order to facilitate the scoring of experts, the original data of the enterprise declaration project is calculated and adjusted. At the same time, the raw data from the technical evaluation of the project is obtained by replacing the evaluation indicators in Table 3, as shown in Table 5.

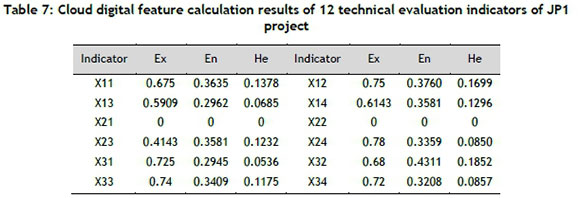
From the Dalian Administrative Service Centre we randomly invited 10 experts in the technical, economic, financial, and marketing fields. The scores are based on the technical evaluation criteria of the project, as shown in Table 6. The JP1 project was taken as an example for calculation. The results are shown in Table 7.
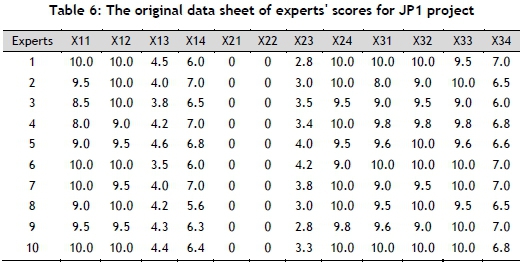
The Table 6 data is normalised to [0, 1], and the standardised mathematical expressions are as follows:

Among them, X and Y are the values before and after the conversion, and Cmax and Cmin are the maximum and minimum values in the sample respectively.
Using the inverse cloud value algorithm formula (15), the expectation, entropy, and super entropy of each index are obtained, and the evaluation cloud value of each indicator in the indicator layer is obtained.
5.5 Calculate for level 1 indicator evaluation cloud and target evaluation cloud
The final evaluation cloud relies on the three digital features of the primary indicator, and the determination of the first-level indicator cloud characteristics depends on the cloud characteristics of the secondary indicator. Therefore, to know the final evaluation results of 10 STI projects, the key step is the determination of the characteristics of the first-level indicators.
5.5.1 Construction of technology evaluation cloud model
In multi-objective decision-making, the evaluation index system must be more than two layers; each layer has its own weight distribution. For the hierarchical cloud with weight, the calculation formula of the upper-level cloud is different. We set a certain index system to be divided into three layers; each index contains n second-level indicators, and the weights of the second-level indicators are λ1, λ2, ... λη. Their cloud characteristic parameters are (Ex1, Eni, He1), (Ex2, En2, He2) (Exn, Enn, Hen). The indicators of the upper level are calculated by the weights of the next level and cloud parameters as follows:
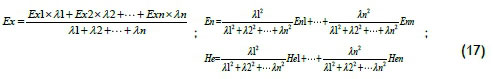
Through the above calculation of the weights of the 12 secondary evaluation indicators and the evaluation of the cloud model, according to the calculation result of formula (17), the numerical characteristics of the first-level indicator evaluation cloud model are calculated as follows:
Furthermore, the technical evaluation cloud characteristics of the key technology research and development project JP1 in Jinpu New Area are (0.5788, 0.3201, 0.1114), and the simulation results using MATLAB R2014a are shown in Figure 5.
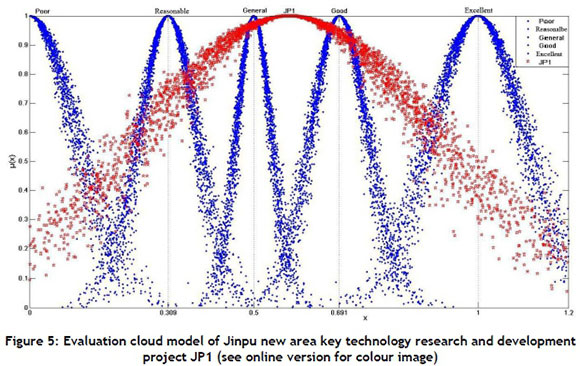
In Figure 5, the blue simulation cloud results show an evaluation set cloud model, which is set to five evaluation levels according to Table 4. The red simulation cloud image is the JP1 fast neutron breeder reactor body development project cloud map, and the highest point represents the cloud's centre of gravity located in the area (0.5, 0.691) of the evaluation set cloud model. Therefore, it is determined that the evaluation level of the JP1 project is a good outcome. In a similar manner, the evaluation results of other projects can be determined as shown in Table 9:
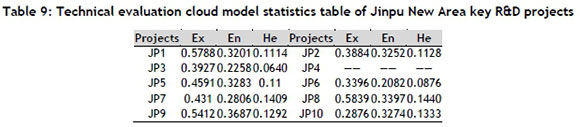
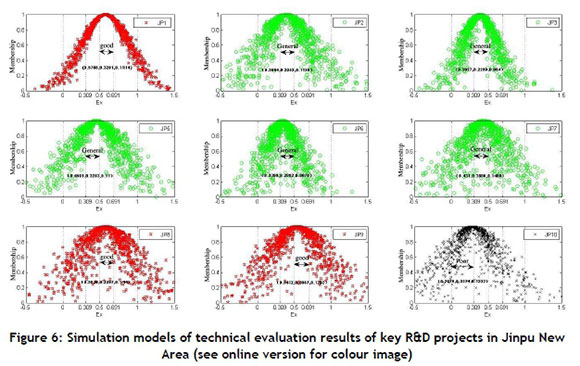
The calculated results in Table 9 are sequentially simulated using MATLAB R2014a. As shown in Figure 6, according to the location of the cloud centre of gravity, the quality of each project can be determined visually. The technical evaluation results of the final project are: three projects that yield good performance are JP1, JP8, and JP9 projects; five projects that display general outcomes are JP2, JP3, JP4, JP5, and JP6 projects; and one poorly performing project, which is JP10 project. In addition, the total investment amount of JP4 project and the assets of the company are all less than 2 million Yuan. Since this does not meet the rigid requirements of the "Dalian key technology R&D plan management measures (trial)" document, it must be excluded.
6 IN CONCLUSION
The entropy weight cloud theory technology evaluation method combines qualitative and quantitative analyses to quantify the difference between various evaluation indicators from a numerical perspective. The paper establishes a hierarchical evaluation cloud model of scientific and technological research and development projects, which has good operability and reflects simplicity in its approach. In the study cases, the weight of the evaluation index is determined, and the evaluation process is easy to implement, by listing 10 typical case verification models of a Dalian Jinpu New Area key technology research and development project (an equipment manufacturing industry) in 2018. The results were consistent with the final recommendation of Dalian Jinpu New Area. It shows that the entropy weight cloud model is feasible in the grading and evaluation of science and technology research and development projects. The use of the reverse cloud generator algorithm to reproduce the expert evaluation results can save evaluation costs and ensure the fairness and objectivity of the evaluation results. Furthermore, the scientific and technological innovation project results obtained here are more convincing. The entropy weight cloud theory is only a preliminary attempt for at the technical evaluation of enterprise science and technology research and development projects. It is suggested that researchers carry out more application verification in the future scientific and technological innovation practice, thus providing a valuable theoretical basis for the government's science and technology authorities and for enterprise STI project evaluation. At the same time, in an uncertain assessment environment, the data evaluation method using the entropy weight cloud model offers a comparative advantage, and the method can be widely applied to technical evaluation problems in other fields.
REFERENCES
[1] Document Research Office of the CPC Central Committee.2016. Excerpts from Xi Jinping's discussion on scientific and technological innovation. Beijing: The CPC Literature Press. [ Links ]
[2] Zhu J.W.2015. Report of international science, technology and innovation policy development. Shanghai: Shanghai Jiao Tong University Press. [ Links ]
[3] National Bureau of Statistics. 2018. China statistical yearbook. Beijing: China Statistics Press. [ Links ]
[4] National Bureau of Statistics, Ministry of Science and Technology. China science and technology statistics yearbook. Beijing: China Statistics Publishing House. [ Links ]
[5] Freeman, C. &, Soete, L. 2009.Developing science, technology and innovation indicators: What we can learn from the past .Research Policy, 38(4):583-589. [ Links ]
[6] OECD.2018. Main science and technology indicators (MSTI) Paris: OECD. [ Links ]
[7] European Commission.2017. Innovation union score board. [ Links ]
[8] National Consulting Engineer (Investment) Vocational Qualification Examination Reference Textbook Writing Committee. 2017. Project decision analysis and evaluation. Beijing: China Planning Publishing House. [ Links ]
[9] Du, Y.P. & Duan, L.M. 2017. Theory and method of technology project evaluation. Xi'an: Xi'an University of Electronic Science and Technology Press. [ Links ]
[10] Du, D. Pang, Q.H. & Wu, Y. 2015. Modern comprehensive evaluation method and case selection. Beijing: Tsinghua University Press. [ Links ]
[11] Xu, L. & Zhang, Z.H. 2014-2018.4nnual report on national technology market statistics. Beijing: Weapon Industry Press. [ Links ]
[12] Godin, B. 2013. Measurement and statistics on science and technology: 1920 to the present. London and New York: Rout ledge Press. [ Links ]
[13] Kille, E. & Yucel, N. 2019. Determination of spatial and temporal changes in water quality at Asi River using multivariate statistical techniques. Turkish Journal of Fisheries and Aquatic Sciences, 19(9):727-737. [ Links ]
[14] Li, J.L. & Wang, H. 2018.Evaluation of promoting effects of several transdermal enhancers by factor and cluster analysis. ICNC-FSKD 2017-13th International Conference on Natural Computation, Fuzzy Systems and Knowledge Discovery, 1683-1688. [ Links ]
[15] Chen, H.H. & Chi, G.T. 2016. Indices screening method based on main information content. Journal of Systems Engineering, 31 (2):268-273. [ Links ]
[16] Shi, B.F. & Chi, G.T. 2014 Green industry evaluation indicators screening model based on the maximum information content and its application. Systems Engineering-Theory â Practice, 34-(7):-1799-1810. [ Links ]
[17] Wang, J. Liu, G.Z. Liu, L.Q. & Wen, B.C. 2012.The generalized product quality's comprehensive evaluation method based on entropy weight method. Advanced Materials Research,569:662-665. [ Links ]
[18] Xuan, H.W. & Cui, X. 2015. Determine weights of evaluation indices for e-commerce websites ranking based on fuzzy AHP. Electronic Engineering and Information Science Proceedings of the 2015 International Conference on Electronic Engineering and Information Science (ICEEIS) 271-274. [ Links ]
[19] Li, D.Y & Du, Y. 2014. Artificial intelligence with uncertainty. 2nd ed. Beijing: National Defence Industry Press. [ Links ]
[20] Li, D.Y. Zhang, H.Y. & Wang, J.Q. 1998. Knowledge representation and discovery based on linguistic toms. Knowledge-Based Systems, 10(7):431-440. [ Links ]
[21] Li, D.Y. Zhang, H.Y. & Wang, J.Q. 2018. Cloud decision support model for selecting hotels on TripAdvisor.com with probabilistic linguistic information. International Journal of Hospitality Management, 68:124-138. [ Links ]
[22] Grupp, H. & Schubert, T. 2010. Review and new evidence on composite innovation indicators for evaluating national performance. Research Policy, 39(1):67-78. [ Links ]
[23] Decancq, K. & Lugo, M. A. 2013.Weights in multidimensional indices of wellbeing: An overview. Econometric Review, 32(1):7-34. [ Links ]
Submitted by authors 16 May 2019
Accepted for publication 4 Nov 2019
Available online 12 Dec 2019
* Corresponding author: baoyongyan@yeah.net

