


Servicios Personalizados
Articulo
 Inglés (pdf)
 Articulo en XML
 Referencias del artículo
Indicadores

Links relacionados
-
 Citado por Google
 -
 Similares en Google
Compartir

 Permalink
South African Journal of Industrial Engineering
versión On-line ISSN 2224-7890
versión impresa ISSN 1012-277X
S. Afr. J. Ind. Eng. vol.30 no.4 Pretoria dic. 2019
http://dx.doi.org/10.7166/30-4-2096
GENERAL ARTICLES
Investigation Of The Effect Of Scan Vector Length On Residual Stresses In Selective Laser Melting Of Maraging Steel 300
L. MugwagwaI, *; D. DimitrovI; S. MatopeI, *; I. YadroitsevII
IStellenbosch Technology Centre, Laboratory for Advanced Manufacturing, Department of Industrial Engineering, Stellenbosch University, South Africa
IICentre for Rapid Prototyping and Manufacturing, Department of Mechanical and Mechatronic Engineering, Central University of Technology, Bloemfontein, South Africa
ABSTRACT
Selective laser melting scanning strategies influence the quality characteristics of parts, such as form accuracy and residual stresses. Previous research on the effect of laser scanning strategy parameters (such as scan vector length) demonstrates that residual stresses decrease with scan vector length reduction. However, most of these studies overlook the associated porosity and how this can contribute to stress relief. In this work, three scan vector lengths were compared to evaluate their impact on residual stresses, achievable part density, and scanning time. Reducing the scan vector length generally lowers residual stresses magnitudes, but introduces porosity as a result of localised overheating.
OPSOMMING
Selektiewe lasersmelt skanderingstrategieë beïnvloed die gehalte eienskappe van onderdele, soos vorm akkuraatheid en res-spannings. Vorige navorsing oor die invloed van laserskandeerstrategie parameters (soos vektorlengte) demonstreer dat res-spannings verminder met 'n toename in skandeervektor lengte. Die meeste van hierdie studies neem egter nie die gepaardgaande poreusheid (en hoe dit kan bydra tot spanningverligting) in ag nie. In hierdie studie word drie skandeervektor lengtes vergelyk om die invloed daarvan op resspannings, bereikbare onderdeeldigtheid en skandeertyd te evalueer. Deur die skandeervektor lengte te verkort het oor die algemeen gelei tot verlaagde res-spannings, maar veroorsaak poreusheid as gevolg van lokale oorverhitting.
1 INTRODUCTION
Selective laser melting (SLM) is a powder-bed fusion process with vast industrial applications in sectors such as the tooling and biomedical industries. One of the major setbacks of SLM is residual stresses that develop due to the large thermal gradients that characterise the process. The subject of residual stresses remains one of the most actively researched fields in laser powder bed fusion processes. During SLM, localised heating and rapid cooling induce thermal stresses that remain as residual stress in the finished part [1-3]. The mechanism of residual stress in SLM is well explained using the temperature gradient and cool down mode mechanisms by Mercelis and Kruth [4]. Residual stress build-up is an inherent phenomenon of most thermal manufacturing processes, and cannot be avoided completely. Laser-based material processing technologies, such as selective laser melting (SLM), are among the worst affected by residual stresses. Residual stresses lead to undesirable effects such as cracking, form and dimensional deviations, and reduced fatigue strength. However, compressive stresses may be desirable, and are usually introduced into SLM manufactured parts in order to cancel out tensile stresses and slow down crack growth rates. Shot peening and laser shock peening processes are commonly used to induce compressive stresses in finished parts [5-8]. Regardless of this, compressive stresses can still lead to form deviations such as bulging. In order to address the challenge of residual stresses and their effects, several methods have been developed and evaluated in previous research. These methods include preheating of the baseplate and improvement of scanning strategies in order to achieve more uniform heat distribution and solidification across the powder bed.
Scanning strategies - such as the parallel [3,9], alternating x/y [9-11], and spiral or helix strategies [3,12,13] - are characterised by long scan vectors, depending on the geometry of the part under fabrication, and high magnitudes of residual stresses and distortions. Keeping the scan vectors short appears to be one of the most widely adopted approaches to in-situ residual stress management [1,11,14,15]. Improving the parallel strategy would give birth to strategies such as the paintbrush [12], chessboard, and island strategies [16,17]. The classic spiral or helix strategy [3,12] has also been developed into the varying-helix island scan strategy [18], which uses much shorter scan vectors. In the island scanning strategy, for example, the scanning area is divided into small square segments, usually with 5 mm sides. Successive tracks within such islands are scanned in a very short space of time such that heat will amass between the neighbouring tracks. As a result, local temperature gradients are reduced, resulting in reduced thermal stresses. By contrast, longer scan vectors promote cooling of the already scanned area because the laser beam travels a long distance along the scanning area. In this case, the high temperature differences between the scanned area and the new scan line results in greater thermal stresses. Liu, Yang and Wang [19] compared scan lengths of 42 mm, 32 mm, and 18 mm, and their results show a general decline in residual stresses with a decrease in the scan length. Kruth, Deckers, Yasa, and Wauthle [1] observed a 13 per cent reduction in the curl up angle for the bridge specimens when the scan vector length was reduced from 20 mm to 2 mm. Wu et al. [14] reduced scan vector lengths from 5 mm to 3 mm, and recorded an accompanying tensile residual stress reduction from 760 to 560 MPa. From separate studies done by Parry, Ashcroft and Wildman [20] and Nadammal et al. [21], it is also evident that residual stresses increase with an increase in scan vector length. A study by Jhabvala, Boillat, Antignac and Glardon [12] compared four scanning strategies (parallel, spiral, paintbrush, and the chessboard scanning strategies), concluding that the paintbrush and chessboard strategies result in better temperature homogeneity, which can easily be maintained. In contrast, Töppel, Müller, Hoeren and Witt [22] observed a reduction in residual stresses (from about 125 MPa to 105 MPa) and distortions (from about 2.5 mm to 2.1 mm) by changing from 2.5 mm2 and 5 mm2 islands to 10 mm2 islands respectively.
In all previous research found by the authors, little consideration has been given to the porosity that might arise from implementing these shorter scan vectors. Furthermore, the impact that different scan vector lengths have on productivity is not studied in the literature that was found. The purpose of this paper, therefore, is to investigate the impact of scan vector length on both residual stresses and porosity. An investigation into the impacts of these different vector lengths on total scanning time is also a subject of this study.
2 MATERIALS AND METHODS
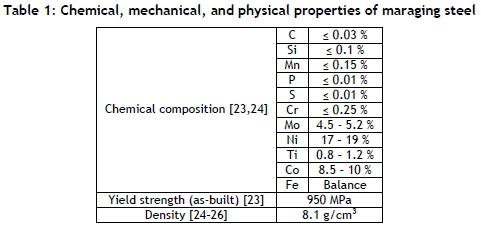
The investigations in this paper were conducted on an M2 Laser Cusing machine that is installed with the island scanning strategy patented by Concept Laser GmbH. The default island scanning strategy parameters are 5 mm χ 5 mm islands, with 90o rotations and 1 mm x/y shifts between layers. The M2 Laser Cusing system uses a single fibre laser in continuous wave mode. In this paper, the influence of scan vector length was studied by adjusting the island size to 3 mm χ 3 mm, 5 mm χ 5 mm, and 7 mm χ 7 mm. A simple 50 mm χ 15 mm χ 15 mm geometry was considered for building from maraging steel 300, with chemical, mechanical, and physical specifications as shown in A scanning speed of 600 mm/s was applied for all island sizes investigated, while laser power and powder layer thickness were set to 180 W and 30 μιτ respectively. Other parameters were: hatch spacing - 105 Mm; focal spot size - 110 Mm. A separate investigation of the effect of the scan vector length on the scanning time was carried out by recording the time taken to completely scan 50 mm χ 50 mm areas using 3 mm χ 3 mm, 5 mm χ 5 mm, and 7 mm χ 7 mm islands. Six observations were made per island size.
The density of the samples was calculated using the Archimedes density test. This method, which is well explained by Spierings, Schneider and Eggenberger [27], involves dividing the mass of a specimen in air (dry weight) by the difference between the dry weight and the specimen's mass when fully immersed in a fluid. Relative density, which is a percentage ratio of the sample density to the theoretical density of the material, is usually used when reporting the density of components manufactured by AM. The theoretical density of maraging steel 300 is taken as 8.1 g/cm3, in line with the related literature [24-26].
Table 1. A scanning speed of 600 mm/s was applied for all island sizes investigated, while laser power and powder layer thickness were set to 180 W and 30 μΓη respectively. Other parameters were: hatch spacing - 105 μπι; focal spot size - 110 μπι. A separate investigation of the effect of the scan vector length on the scanning time was carried out by recording the time taken to completely scan 50 mm χ 50 mm areas using 3 mm χ 3 mm, 5 mm χ 5 mm, and 7 mm χ 7 mm islands. Six observations were made per island size.
The density of the samples was calculated using the Archimedes density test. This method, which is well explained by Spierings, Schneider and Eggenberger [27], involves dividing the mass of a specimen in air (dry weight) by the difference between the dry weight and the specimen's mass when fully immersed in a fluid. Relative density, which is a percentage ratio of the sample density to the theoretical density of the material, is usually used when reporting the density of components manufactured by AM. The theoretical density of maraging steel 300 is taken as 8.1 g/cm3, in line with the related literature [24-26].
The size and distribution of pores present in the samples was analysed using CT scanning and optical microscopy. A General Electric V|TomeX L240 CT scanner was used to quantify the pores in 15 mm3 samples that were extracted from the base specimens. The smaller the specimen, the higher the resolution that can be used, allowing for small pores to be detected. A voxel size greater than the minimum feature to be measured is necessary to evaluate the dimensions of the pores [28]. In this study, a voxel size of 15 μΓη was selected, allowing for pores above 45 μm to be easily detected for three voxels in one direction. X-ray settings were 220 kV, 200 μΑ, and a copper beam filtration of 1.5 mm. Image reconstruction was done in Datos software, while visualisation and analysis were performed in Volume Graphics VGStudioMax 3.1.
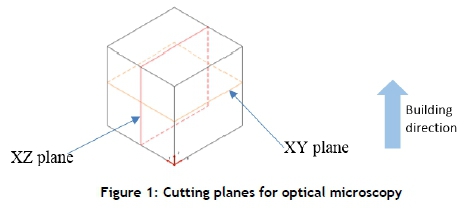
Two viewing planes were chosen for optical microscopy: one parallel to the building direction, and another perpendicular to it, as shown in Figure 1. The samples were prepared for optical microscopy by grinding, using SiC paper of various grit sizes, before diamond suspension polishing. Subsequent to this, the specimens were etched using two per cent Nital to reveal the location of the pores relative to the layers and the scan tracks.
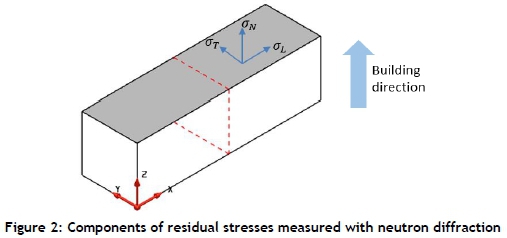
The neutron diffraction technique was used to evaluate the residual stresses using the MPISI neutron strain scanner instrument at the SAFARI-1 research reactor of the South African Nuclear Energy Corporation (NECSA). This method works by comparing the crystallographic lattice spacing of stressed material with stress-free material using Bragg's law of constructive interference, and calculating the residual stresses from the generalised Hooke's law. The neutron diffraction method is described in Cheng et al. [29], Acevedo, Evans and Nussbaumer [30], and Suzuki et al. [31]. The measurements in this work were performed by probing the {211} peak of iron using a neutron wavelength of 1.667 Â and a gauge volume of 2 mm3. Tri-axial stresses were measured along the building direction, along the specimen's length, and along the width of the specimen. A matrix of measurements was taken midway along the sample length, at various points on the YZ plane, as indicated by the dotted cross section in Figure 2. In order to allow for full beam submerging for the gauge volume used, measurements were taken at points that lie at least 1 mm from the sample surfaces. Eighty positions per stress component were evaluated, giving a total of 240 stress calculations for each island size.
3 RESULTS
3.1 Influence of scan vector length on porosity
The 3 mm χ 3 mm islands resulted in the highest average porosity of 1.32 per cent ± 0.35. An insignificant difference was found between the porosities for 5 mm χ 5 mm and 7 mm χ 7 mm islands, standing at 0.66 per cent ± 0.18 and 0.63 per cent ± 0.22 respectively. Similar findings are reported by Lu et al. [32], who observed high cracking and porosity tendencies with decreasing island size. The CT scan results for parts manufactured using the 3 mm χ 3 mm and the 5 mm χ 5 mm islands are shown in Figure 3. These results confirm the higher porosity that was calculated using the Archimedes technique for the 3 mm χ 3 mm islands. The specimen built from 7 mm χ 7 mm did not have any detectable pores for the 15 μm voxel size that was used. This does not mean this specimen had no pores in it at all, but that there were no pores greater than 45 μm, which is the minimum pore size detectable for the chosen CT scan resolution. The pores observed for the different islands were random across the planes of viewing - an indication that the porosity was not a result of insufficient overlaps between tracks or islands due to hatch spacing errors, as observed by Yasa, Kempen and Kruth [26]. The island scanning strategy is reported to introduce porosity due to the entrapment of gas at the end of each scan track as the laser beam makes a sharp turn [18]. This effect is easily compounded as the scan vectors become shorter, since higher sharp turn incidences become inevitable. As the island size is reduced, heat accumulates between the tracks and within an island. When this heat accumulation becomes excessive, it may lead to balling and poor metallurgical bonding. Thus, overheating for the 3 mm χ 3 mm islands may be the reason for the porosity observed in this study.
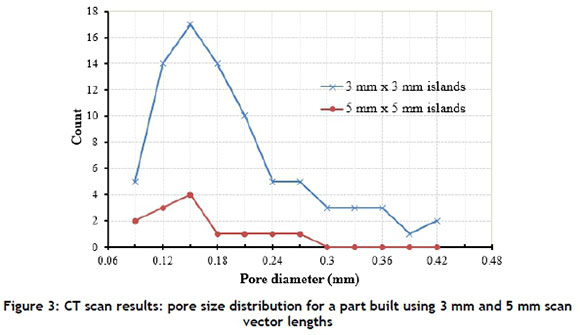
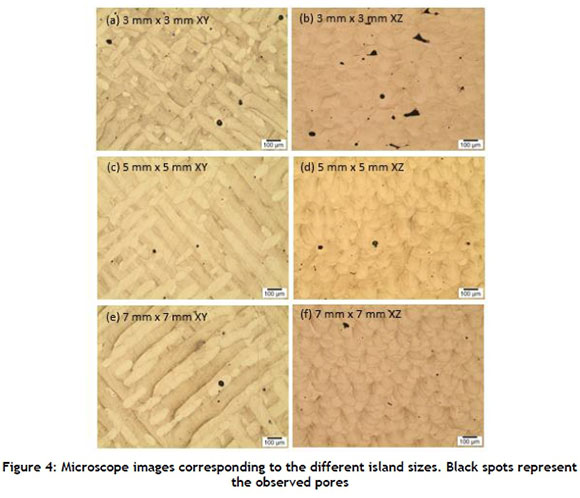
Optical microscopy also showed a higher concentration of pores for the 3 mm χ 3 mm islands compared with those of 5 mm χ 5 mm and 7 mm χ 7mm. Most of the pores for the 3 mm χ 3 mm islands were irregularly shaped, particularly along the building direction, as shown in Figure 4, where pores of greater than 100 μπι length can be observed for this island size. The XZ plane is along the building direction, whereas XY is the plane perpendicular to it, as shown earlier in Figure 1. The images along the building direction clearly depict the layer-wise consolidation style. No notable differences were observed under the microscope for the 5 mm χ 5 mm and 7 mm χ 7 mm islands. This is in agreement with findings from the Archimedes method. While the size of the pores that was picked up by optical microscopy is generally below 0.1 mm, the CT scanner detected much bigger pores of up to 0.42 mm in diameter. The generally smaller diameter of pores observed for optical microscopy compared with CT scanning is due to the difference in the measurement approach of the two methods. CT scanning is capable of 3D pore measurement, whereas optical microscopy only reveals a 2D section of the pores, which can give inaccurate information about their actual size. Nevertheless, the CT scan, optical microscopy, and Archimedes results correlate well.
3.2 Influence of scan vector length on residual stresses
Residual stresses ranged from compressive to tensile for all three components measured; that is, normal, longitudinal, and transverse stresses. While most studies focus on longitudinal and transverse stresses, the measurement of residual stresses along the building direction is critical, as these stresses can easily lead to delamination during the SLM process. The residual stress magnitudes in this work were generally low, relative to the yield strength of 950 MPa for maraging steel. As mentioned earlier, surface residual stresses could not be measured because the neutron beam does not fully submerge at the surface.
3.2.1 Normal stresses
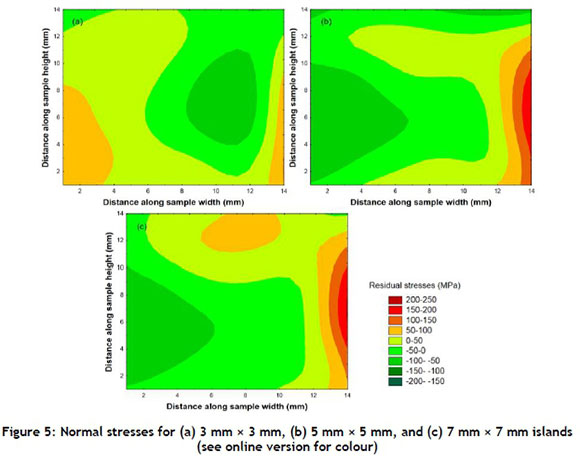
The influence of island size on the normal component of residual stresses is shown in the distance weighted contour plot in Figure 5. For all three island sizes, normal stresses were largely below 50 MPa, with small regions of the 3 mm χ 3 mm and the 5 mm χ 5 mm islands falling into a compressive stress range between -150 and -200 MPa. While there was generally no direct relationship between the nature/magnitude of the stresses and their positions within the specimen, these stresses became more tensile towards one of the edges along the width of the specimens. Maximum tensile stresses of 138, 268, and 280 MPa were found for the 3 mm χ 3 mm, 5 mm χ 5 mm, and 7 mm χ 7 mm islands respectively. These maximum stresses were concentrated close to the edges of the specimens. The central regions across the cross section of the specimens were largely under compressive stresses. The distribution of normal stresses for the 5 mm and 7 mm vectors was quite similar, except that there were more tensile stresses for 7 mm towards the top surface of the specimen.
3.2.2 Longitudinal stresses
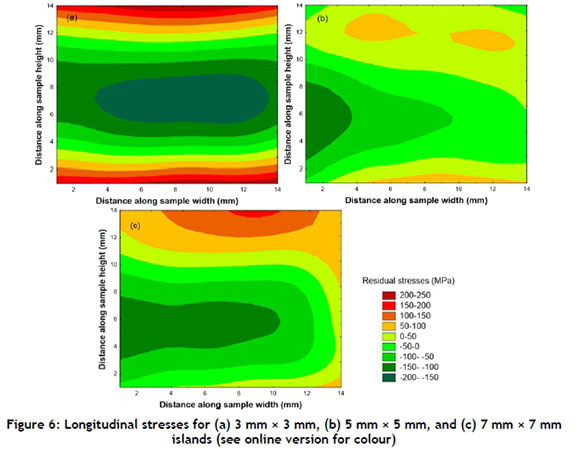
The longitudinal stresses illustrated in Figure 6 showed less scatter compared with the normal stresses described earlier. The specimen that was built using 3 mm χ 3 mm islands had the highest magnitudes of both tensile and compressive stresses. Close to the surface, the stresses were purely tensile, ranging from 103 MPa to 195 MPa. Similarly, close to the wire cut side, tensile stresses between 48 and 131 MPa dominated. The stresses gradually and consistently declined, becoming more compressive close to the centre of the cross-section of the sample. The compressive band of residual stresses at the centre of the specimen reached -215 MPa. On the other hand, the stresses were generally lower for the 5 mm χ 5 mm islands compared with the 3 mm χ 3 mm islands. Residual stresses for this island size (5 mm χ 5 mm) declined from a range between -55 MPa and 107 MPa near the baseplate side, to between -196 MPa and 36 MPa at 6 mm above the baseplate. Further above the baseplate side, the residual stresses increased, and reached top values of between 59 MPa and 152 MPa at a height of 11 mm before declining to between -61 MPa and 69 MPa at 2 mm below the top surface of the specimen. Relative to the material's as-built yield strength of 950 MPa, the 7 mm χ 7 mm islands also exhibited generally low stresses that ranged from -166 MPa to 143 MPa. The longitudinal stresses for this island size were generally compressive above the wire-cut side of the specimen surface, up to about 11 mm along the specimen's height. Thereafter, the stress became tensile, reaching top values of between 72 MPa and 143 MPa at 2 mm below the top surface of the specimen.
3.2.3 Transverse stresses
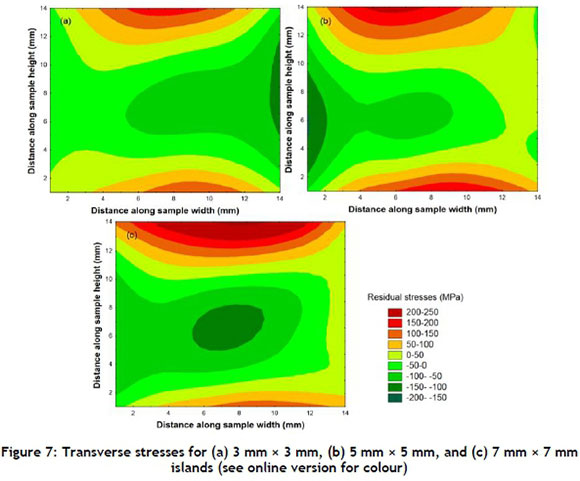
For the transverse stress components, the general trend was that the stress was tensile near the specimens' bottom and top surfaces (Figure 7). This trend was readily noticeable for the transverse stresses compared with normal and longitudinal stresses. Towards the centre of the specimens (between 3 mm and 9 mm along the height), the stress was almost purely compressive. The maximum stress measured for the 3 mm χ 3 mm islands was 161 MPa, found at about 2 mm along the specimen's height and 9 mm along the width, while the most compressive stress found was -112 MPa. For the 5 mm χ 5 mm islands, the maximum stress value was 222 MPa near the baseplate side of the specimen. All the other measurement points near the baseplate also exhibited tensile stresses, albeit low, except for a compressive stress of 58 MPa that was measured 1.6 mm from the edge of the specimen. The lowest stress found for this island size was -168 MPa. On the other hand, the highest stress value (250 MPa) was found at about 2 mm from the top surface of the specimen for the 7 mm χ 7 mm islands. Other stress magnitudes for this island size ranged between 150 and 250 MPa. As for compressive stresses, the central region of the specimen reached -165 MPa around 6 mm along the height and width of the specimen.
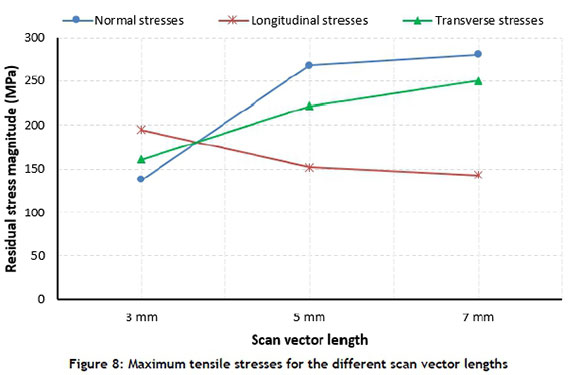
4 DISCUSSION
The residual stress patterns in all the specimens demonstrated that tensile stresses were concentrated towards the specimen edges, with the central cross section experiencing largely compressive stresses. Normal and transverse residual stress magnitudes increased with an increase in island size (or scan vector length), although no significant differences were observed between the 5 mm and 7 mm vectors. Along the normal direction, the maximum tensile residual stress increased from 138 MPa for the 3 mm χ 3 mm islands, to 268 MPa and 280 MPa when the island size was increased to 5 mm χ 5 mm and 7 mm χ 7 mm respectively. A similar pattern was observed for the transverse component, for which the maximum tensile stress rose from 161 MPa to 222 MPa and 250 MPa for the 3 mm, 5 mm, and 7 mm vectors respectively. The magnitudes of compressive stresses were also similar for the 5 mm and 7 mm vectors for the normal and transverse components. On the other hand, the longitudinal component showed an increase in both tensile stress and compressive stress magnitudes for the 3 mm vectors, compared with the 5 mm and 7 mm. The maximum tensile longitudinal stress found for the 3 mm χ 3 mm islands was 195 MPa, against 152 MPa and 144 MPa for the 5 mm χ 5 mm and 7 mm χ 7 mm islands respectively. The compressive stresses for this component also showed a similar trend, where the most compressive value of -215 MPa was found for the 3 mm vectors, whereas -196 MPa and -166 MPa were measured for the 5 mm and 7 mm vector lengths respectively. A summary of the maximum tensile stresses is shown in Figure 8.
These results indicate the directional dependence of the effect of the scan vector length on residual stresses. The overheating that can arise from reducing island sizes could be responsible for the higher longitudinal stresses for the 3 mm χ 3 mm islands, whereas the higher temperature gradients lead to higher stresses in the transverse and normal directions as the scan length increases. At the same time, the similarities in porosity and residual stress results for the 5 mm and 7 mm scan vector lengths, and significantly different corresponding results for the 3 mm vectors, show that porosity relaxed the bulk of the normal and transverse stresses for the 3 mm χ 3 mm islands. A quick scanning time analysis per layer was performed for a 50 mm χ 50 mm scanning area, from which the average scanning times were found to be 40, 41, and 42 seconds for the 7 mm, 5 mm and 3 mm scan vector lengths respectively. Reducing the island size increases the number of instances the laser beam should 'jump' from one island to the other. Although changing the scan vector length between 3 mm and 7 mm has a 'marginal' effect on scanning time, it potentially becomes significant with increase in part(s) volume.
5 CONCLUSION AND FUTURE WORK
• Reduction of island size contributes to porosity increase. The pores observed in this research were randomly distributed across the viewing planes, and were clearly not a result of hatching errors or insufficient overlaps between tracks and islands, but rather a result of the overheating that came with heat build-up for the 3 mm χ 3 mm islands. On the other hand, the 5 mm χ 5 mm and 7 mm χ 7 mm islands resulted in very similar porosity results.
• The 7 mm χ 7mm islands contributed to the highest achievable density, while also taking the shortest time to scan the powder bed completely. Although the 7 mm scan vectors introduced slightly higher transverse and normal residual stresses, they appeared to be more attractive from the standpoint of achievable density and scanning time.
• Normal and transverse stresses generally decline with a decrease in island size. On the other hand, the longitudinal stresses tend to increase with a decrease in island size - an indication of a possibility of overheating due to heat accumulation for the short scan vectors. These observations also lead to the conclusion that the effect of scan vector length on residual stress is dependent on the direction of measurement.
• Future research will focus on evaluating the impact of the scan vector lengths on surface residual stresses. Neutron diffraction residual stress measurement can be complemented by x-ray diffraction, which is capable of measuring surface stresses. Numerical modeling and simulation can also be powerful tools in studying the thermal gradients along different directions on the powder bed.
ACKNOWLEDGEMENTS
The authors are grateful to the South African Department of Science and Technology for funding under the Collaborative Programme on Additive Manufacturing. Special thanks to Dr Andrew Venter and Mr Tshepo Ntsoane from the Nuclear Energy Corporation of South Africa (NECSA) for conducting neutron and x-ray diffraction measurements of residual stresses.
DECLARATION
This work formed part of Lameck Mugwagwa's PhD study.
REFERENCES
[1] Kruth, J.-P., Deckers, J., Yasa, E. & Wauthle, R. 2012. Assessing and comparing influencing factors of residual stresses in selective laser melting using a novel analysis method. Proc. Inst. Mech. Eng. Part B J. Eng. Manuf., 226, pp. 980-991. [ Links ]
[2] Van Belle, L., Vansteenkiste, G. & Boyer, J.C. 2013. Investigation of residual stresses induced during the selective laser melting process. Key Eng. Mater., 554-557, pp. 1828-1834. [ Links ]
[3] Mohanty, S. & Hattel, J. 2014. Cellular scanning strategy for selective laser melting: Capturing thermal trends with a low-fidelity, pseudo-analytical model. Math. Probl. Eng., 2014, pp. 1-14. [ Links ]
[4] Mercelis, P. & Kruth, J. 2006. Residual stresses in selective laser sintering and selective laser melting. Rapid Prototyp. J. , 12(5), pp. 254-265. [ Links ]
[5] Kalentics, N., Boillat, E., Peyre, P., Gorny, C., Kenel, C., Leinenbach, C., Jhabvala, J. & Logé, R.E. 2017. 3D laser shock peening: A new method for the 3D control of residual stresses in selective laser melting, Mater. Des., 130, pp. 350-356. [ Links ]
[6] Vrancken, B. 2016. Study of residual stresses in selective laser melting. PhD thesis, Katholieke Universiteit Leuven. [ Links ]
[7] Yadroitsev, I. & Yadroitsava, I. 2015. Evaluation of residual stress in stainless steel 316L and Ti6Al4V samples produced by selective laser melting. Virtual Phys. Prototyp., 10, pp. 67-76. [ Links ]
[8] Yadroitsava, I. & Yadroitsev, I. 2015. Residual stress in metal specimens produced by direct metal laser sintering. in Solid Freeform Fabrication Symposium, pp. 614-625. [ Links ]
[9] Beal, V.E., Erasenthiran, P., Hopkinson, N., Dickens, P. & Ahrens, C.H. 2008. Scanning strategies and spacing effect on laser fusion of H13 tool steel powder using high power Nd:YAG pulsed laser. Int. J. Prod. Res., 46, pp. 217-232. [ Links ]
[10] Meier, H. & Haberland, C. 2008. Experimental studies on selective laser melting of metallic parts. Materwiss. Werksttech., 39, pp. 665-670. [ Links ]
[11] Zaeh, M.F. & Branner, G. 2010. Investigations on residual stresses and deformations in selective laser melting. Prod. Eng. , 4, pp. 35-45. [ Links ]
[12] Jhabvala, J., Boillat, E., Antignac, T. & Glardon, R. 2010. On the effect of scanning strategies in the selective laser melting process. Virtual Phys. Prototyp., 5, pp. 99-109. [ Links ]
[13] Fateri, M., Hötter, J.-S. & Gebhardt, A. 2012. Experimental and theoretical investigation of buckling deformation of fabricated objects by selective laser melting. Phys. Procedia, 39, pp. 464-470. [ Links ]
[14] Wu, A.S., Brown, D.W., Kumar, M., Gallegos, G.F. & King, W.E. 2014. An experimental investigation into additive manufacturing-induced residual stresses in 316L stainless steel. Metall. Mater. Trans. A Phys. Metall. Mater. Sci., 45, pp. 6260-6270. [ Links ]
[15] Li, C., Fu, C.H., Guo, Y.B. & Fang, F.Z. 2016. A multiscale modeling approach for fast prediction of part distortion in selective laser melting. J. Mater. Process. Technol., 229, pp. 703-712. [ Links ]
[16] Carter, L.N., Martin, C., Withers, P.J. & Attallah, M.M. 2014. The influence of the laser scan strategy on grain structure and cracking behaviour in SLM powder-bed fabricated nickel superalloy. J. Alloys Compd., 615, pp. 338-347. [ Links ]
[17] Ali, H., Ghadbeigi, H. & Mumtaz, K. 2018. Effect of scanning strategies on residual stress and mechanical properties of selective laser melted Ti6Al4V. Mater. Sci. Eng. A, 712, pp. 175-187. [ Links ]
[18] Hagedorn-Hansen, D., Bezuidenhout, M., Dimitrov, D. & Oosthuizen, G.A. 2017. The effects of selective laser melting scan strategies on deviation of hybrid parts. South African J. Ind. Eng., 28, pp. 200-212. [ Links ]
[19] Liu, Y., Yang, Y. & Wang, D. 2016. A study on the residual stress during selective laser melting (SLM) of metallic powder. Int. J. Adv. Manuf. Technol. , 87, pp. 647-656. [ Links ]
[20] Parry, L., AAshcroft, I.A. & Wildman, R.D. 2016. Understanding the effect of laser scan strategy on residual stress in selective laser melting through thermo-mechanical simulation. Addit. Manuf., 12, pp. 1-15. [ Links ]
[21] Nadammal, N., Cabeza, S., Mishurova, T., Thiede, T., Kromm, A., Seyfert, C., Farahbod, L., Haberland, C., Schneider, J.A., Portella, P.D. & Bruno, G. 2017. Effect of hatch length on the development of microstructure, texture and residual stresses in selective laser melted superalloy Inconel 718. Mater. Des., 134, pp. 139-150. [ Links ]
[22] Töppel, T., Müller, B., Hoeren, K.P.J. & Witt, G. 2016. Eigenspannungen und verzug bei der additiven fertigung durch laserstrahlschmelzen. Schweiss. und Schneid., 68, pp. 176-186. [ Links ]
[23] Concept Laser GmbH. 2010. Heat treatment CL 50WS. M2 Cusing Manual - Serial number M2-2011-02-01, Version 3. [ Links ]
[24] EOS GmbH. 2011. Material data sheet - EOS Maraging Steel MS1. TMS, WEIL/10.2011, pp. 1 -6. [ Links ]
[25] Becker, T. & Dimitrov, D. 2016. The achievable mechanical properties of SLM produced maraging steel 300 components. Rapid Prototyp. J., 22, pp. 487-494. [ Links ]
[26] Yasa, E., Kempen, K. & Kruth, J. 2010. Microstructure and mechanical properties of maraging steel 300 after selective laser melting. in Solid Freeform Fabrication Symposium, pp. 383-396. [ Links ]
[27] Spierings, A.B., Schneider, M. & Eggenberger, R. 2011. Comparison of density measurement techniques for additive manufactured metallic parts. Rapid Prototyp. J., 17, pp. 380-386. [ Links ]
[28] Siddique, S., Imran, M., Rauer, M., Kaloudis, M., Wycisk, E., Emmelmann, C. & Walther, F. 2015. Computed tomography for characterization of fatigue performance of selective laser melted parts. Mater. Des., 83, pp. 661-669. [ Links ]
[29] Cheng, X., Prask, H.J., Gnaeupel-Herold, T., Luzin, V. & Fisher, J.W. 2012. Neutron diffraction measurements for residual stresses in AL-6XN stainless steel welded beams. In: I. Khidirov (ed.), Neutron Diffr., InTech, pp. 25-48. [ Links ]
[30] Acevedo, C., Evans, A. & Nussbaumer, A. 2012. Neutron diffraction investigations on residual stresses contributing to the fatigue crack growth in ferritic steel tubular bridges. Int. J. Press. Vessel. Pip., 95, 3138. [ Links ]
[31] Suzuki, T., Oikawa, H., Imafuku, M., Suzuki, H., Sugiyama, M., Nose, T., Tomota, Y. & Moriai, A. 2011. Residual stress measurement of welding area by neutron diffraction method. Nippon Steel Tech. Rep., pp. 47-50. [ Links ]
[32] Lu, Y., Wu, S., Gan, Y., Huang, T., Yang, C., Junjie, L. & Lin, J. 2015. Study on the microstructure, mechanical property and residual stress of SLM Inconel-718 alloy manufactured by differing island scanning strategy. Opt. Laser Technol., 75, pp. 197-206. [ Links ]
Submitted by authors 27 Nov 2018
Accepted for publication 21 Oct 2019
Available online 12 Dec 2019
* Corresponding authors: lameck@sun.ac.za; smatope@sun.ac.za

