Services on Demand
Article
Indicators
Related links
-
 Cited by Google
 -
 Similars in Google
Share
South African Journal of Industrial Engineering
On-line version ISSN 2224-7890
Print version ISSN 1012-277X
S. Afr. J. Ind. Eng. vol.30 n.4 Pretoria Dec. 2019
http://dx.doi.org/10.7166/30-4-2030
GENERAL ARTICLES
Earned Value Analysis, Implementation Barriers, And Maturity Level In Oil & Gas Production
Z. ZhanI; C. WangI, *; J.B.H. YapII; S. SamsudinI; H. Abdul-RahmanIII
IIntelligence and Automation in Construction, Fujian Province Higher-educational Engineering Research Centre, College of Civil Engineering, Huaqiao University, Xiamen, China
IIDepartment of Surveying, Lee Kong Chian Faculty of Engineering and Science, Universiti Tunku Abdul Rahman (UTAR), Kajang, Selangor, Malaysia
IIIFaculty of Science, Vision College, Petaling Jaya, Selangor, Malaysia
ABSTRACT
Poor performance measurement practices in the oil and gas industry can cause project cost overruns, schedule delays, and scope increases. Earned value management, as an integrated project planning and control method measuring cost and schedule performance, enables the early detection of performance issues, and allows corrective actions to be implemented in a timely manner. Through a structured interview survey, this study aimed to identify the current maturity level of earned value management practice in Malaysian oil and gas firms to determine the barriers hindering the use of this practice, and to identify critical success factors for enhancing earned value management implementation in the oil and gas industry. The findings revealed the major barriers to earned value management implementation, and potential strategies to improve the effectiveness of earned value management practice in this industry.
OPSOMMING
Swak prestasiebestuurpraktyke in die olie- en gasindustrie lei tot die oorskryding van projek begrotings, skedule vertragings en omvang toenames. Verdiendewaarde bestuur wat as 'n geïntegreerde projekbeplanning en -beheermetode gebruik word om koste en skedule prestasie te meet stel die bestuurder in staat om prestasie probleme vroegtydig op te spoor. Dienooreenkomstige korrigerende stappe kan dan tydig geneem word. Hierdie studie se doelstelling was om deur middel van 'n gestruktureerde onderhoud opname die huidige volwassenheidsvlak van verdiendewaarde bestuurpraktyke in die Maleisiese olie- en gasindustrie te bepaal, om hindernisse tot die gebruik van hierdie praktyk te bepaal, en om kritiese suksesfaktore wat die implementering van verdiendewaarde bestuur aanmoedig te identifiseer. Die bevindinge het groot hoof hindernisse tot die implementering van verdiendewaarde prestasiebestuur in hierdie industrie ontbloot.
1 INTRODUCTION
In a competitive and rapidly changing business environment, project clients and their contractors from government and private sectors around the world are constantly under pressure to achieve better performance in projects, regardless of size, industry sector, or geographical location [1, 2]. The desire to do more with less, and to deliver faster, becomes even more pronounced in times of economic uncertainty [3]. The Project Management Institute's (PMI) practice standard for earned value management elucidates earned value management (EVM) as "a management methodology for integrating scope, schedule, and resources; for objectively measuring project performance and progress; and for forecasting project outcomes" [30]. According to Lukas [34], the EVM approach measures work performance by integrating schedules and budgets based on the work breakdown structure (WBS) of the project. EVM thus provides an integrated management control methodology that provides forecasts and early warnings of performance issues to enable timely corrective actions to ensure project success [4, 5]. EVM also improves the definition of project scope, prevents scope creep, communicates objective progress to stakeholders, and keeps the project team focused on achieving progress [6]. As eVm use and its knowledge base continue to expand, fundamental EVM principles withstand the test of time. Since its formal introduction in the 1960s by the U.S. Department of Defense (DOD), numerous studies and several decades of industry practice have shown the value of EVM [7-12]. EVM is regarded as a 'best practice' and standard for project performance management by many government agencies and private industry practitioners [13-17]. EVM has also been documented as a 'best practice' and a critical component of the overall project management framework in the PMI's A guide to the project management body of knowledge (PMBOK Guide), PMI's Practice standard for earned value management, and various national standards, such as the American National Standards Institute (ANSI)/Electronic. EVM is thus considered an effective performance measurement and feedback tool for managing projects [30, 35].
The basic concept of earned value was adopted in Program/Project Evaluation and Review Technique (PERT)/cost, and contractors were required to report cost performance using earned value [18]. PERT/cost did not survive, but the basic earned value concept has remained, and many variations of the earned value concept began to proliferate in a number of defence procurement programmes [18]. Notably, the U.S. Air Force investigated the best management practices used by leading American companies, and these practices were captured as criteria for effective management in the Cost/Schedule Planning Control System (C/SpCS) specification [19]. These efforts eventually led to the issuing of a DOD-wide specification entitled Cost/Schedule Control Systems Criteria (C/SCSC) in 1976. Since then, earned value has been consistently mandated and applied to major defence projects, and there has been no substantive change to the criteria for decades [11].
Today, globalisation has created more virtual and distributed projects and has prompted partnership among clients and contractors from different industry sectors and countries. This ever-increasing level of globalisation and cross-industry collaboration in project environments generates a great need for a clear understanding of current EVM practice across geographic and industry boundaries [20]. For that reason, this article examines EVM practice in the Malaysian oil and gas industry, which consists of various large international oil companies (IOC) that are distinct from the national oil and gas company. Malaysia's national oil and gas company, Petronas, has exploration and production businesses in over 22 countries in Southeast Asia, the Middle East, Central Asia, Latin America, and Africa [21]. Respondents for this study came from various disciplines, including government agencies, military, aviation, IT, construction, and academia, providing a holistic view across industries.
Unlike in developed countries, the oil and gas sector in a developing country such as Malaysia is normally dominated by the host government. The Malaysian oil and gas company, Petronas, holds the exclusive ownership rights to all exploration and production projects in Malaysia, including licensing. To operate in Malaysia, foreign and private oil companies must have working interests in a production sharing contract (PSC), the hydrocarbons and cost sharing between the host government and international oil companies (IOC), with Petronas. Under a PSC, the national company and the IOC enter into an agreement through attractive contract terms. The terms must also ensure that the host government receives maximum economic returns from the venture [22]. With the PSC, it became crucial to measure costs against the baseline to maximise shared profits. EVM is relevant in this situation, as it forecasts project costs and schedules at completion, and highlights the possible need for corrective action. Unlike traditional project reporting tools, such as PERT and Gantt charts, which conceal or cloud schedule and cost problems, EVM counteracts these situations [23].
Global oil and gas projects have often suffered significant time and cost overruns [24]. For instance, Allen - a project manager in the oil and gas industry - reported that poor performance measurement practices in the oil and gas industry caused project cost overruns, schedule delays, and scope increases in their organisations [25]. To improve the situation, Allen developed a fit-for-purpose approach to a work monitoring, evaluation, and improvement process, but did not apply the earned value method [25]. Previous studies and practitioners in the oil and gas industry have raised questions about EVM practice: a) What is the degree of EVM use by the industry? b) Have new standards of practice been adopted? c) What are the characteristics of EVM practice in the industry? d) What are the barriers to further improving EVM acceptance and usage? e) What are the success factors for improvements to current EVM standards? While Mackellar [26] and Elphick [27] tried to link time and resources into engineering monitoring, both studies failed to answer these questions. Therefore, the aims of this study are to identify the current maturity level of EVM practice in Malaysian oil and gas firms, to determine EVM barriers that hinder the use of EVM more broadly, and to identify critical success factors to enhance EVM implementation in the oil and gas industry.
2 EARNED VALUE ANALYSIS AND MATURITY MODEL
Earned value analysis (EVA) is a way to measure the amount of work actually performed on a project and to forecast a project's cost and date of completion [28, 29]. The method relies on a key measure known as 'earned value' (also known as the 'budgeted cost of worked performed', or BCWP). This measure enables one to compute performance indices for cost and schedule, which indicate how well the project is doing relative to the original plans [30]. These indices also enable one to forecast how the project will do in the future. Earned value actually uses three data values that are computed each week, month, or in any other determined time period. As illustrated in Figure 1, the three values are: estimate to complete (ETC), budget at completion (BAC), and estimate at completion (EAC). .
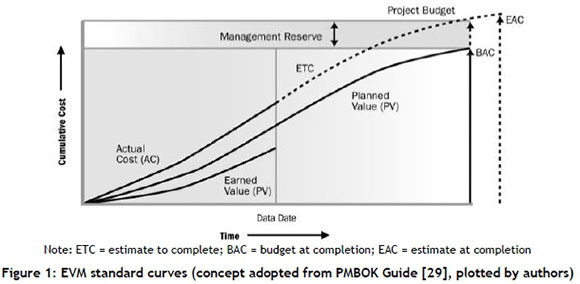
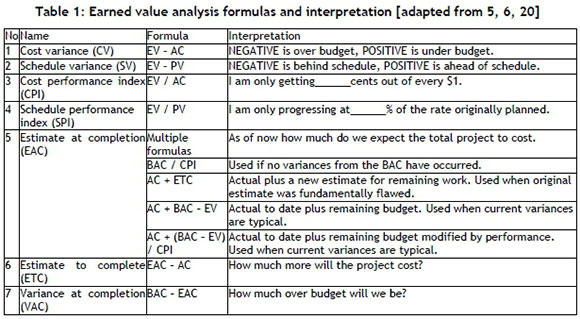
BCWP, or earned value, is the cost originally budgeted to accomplish the work that has been completed as of the analysis date. It answers the question, "How much work has actually been completed?". BCWS, or plan, is the total budgeted cost up to the analysis date. It answers the question, "How much did we plan to spend as of this date?" A variant of this question is, "How much work should have been completed by this date?" ACWP is the actual cost to accomplish all the work completed as of the analysis date. It answers the question, "How much have we actually spent?" This is usually determined from the organisation's accounting system, or can often be approximated by multiplying the number of people by the number of hours or days or weeks worked. Earned value analysis formulas and their interpretation are shown in Table 1.
In order to provide a system level measurement of different EVM applications, the 'earned value management maturity model' (EVM3) concept was referenced to establish a framework for the measurement. Unlike the basic technical EVM requirements, the maturity of an EVM system measures an organisation's capability of applying EVM and the quality of the EVM system. It provides a way to separate questionable EVM implementations from robust and continuously improving implementations [31].
EVM3 is a staged, five-level maturity model. The goal of EVM3 is to help organisations to define an EVM maturity level at the project level, for the purpose of accomplishing higher and more sophisticated EVM maturity through a systematic and incremental approach. Maturity level 1 refers to the organisation that has used EVM for a very few pilot projects. Level 2 users apply EVM for large and critical projects only. It can be reasonably assumed that a Level 2 EVM system is effective, as evidenced by usage to manage important projects. Level 3 users apply EVM as an organisational standard for project control. Level 4 users possess a robust organisational standard, and seek to improve the standard by introducing metrics to measure the quality of EVM data. Level 5 maturity is achieved when EVM data are measured and optimised.
3 METHODOLOGICAL APPROACH AND RESEARCH PROTOCOL
Research methodology is determined by its research goals. Basically, there are four types of goal: (i) Exploratory (become familiar with the basic facts, setting, and concerns; create a general mental picture of conditions; formulate and focus questions for future research; generate new ideas, conjectures, or hypotheses; determine the feasibility of conducting research; develop techniques for measuring and locating future data); (ii) Descriptive (provides the detailed, highly accurate picture; locate new data that contradict past data; create a set of categories or classify types; clarify a sequence of steps or stages; document a causal process or mechanism; report on the background or context of a situation); (iii) Explanatory (test a theory's predictions or principle; elaborate and enrich a theory's explanation; extend a theory to new issues or topics; support or refute an explanation or prediction; link issues or topics with a general principle; determine which of several explanations is best); and (iv) Instrumental (construct/calibrate research instruments, whether physical measuring equipment or as tests/data collection; in such situations the construction of instruments and data measurement in terms of meaning which renders the activity scientific research). The evaluation will be based on theory [32].
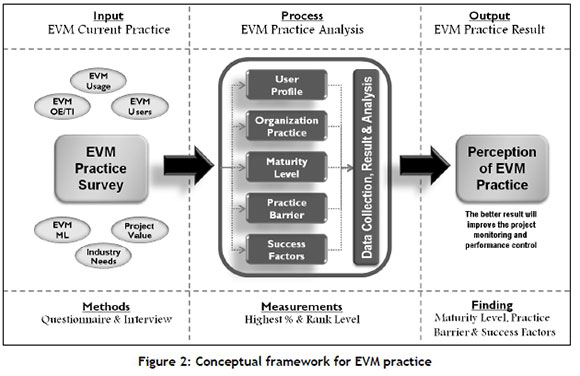
The goal of this research was defined to be a combination of exploratory and explanatory. A structured interview survey was employed to identify current EVM practices in oil and gas projects. A structured interview was employed because it could make the interview process efficient by standardising questions. All respondents answer the same questions so that answers can be easily compared and trends observed. Further, a structured interview can be easily repeated to check the reliability of the data, and a trained interviewer is present to answer any questions the interviewee has. Structured interviews offer a richer, more comprehensive view of an issue than a questionnaire survey does, and respondents can give more detailed responses [33]. The respondents were from major oil and gas companies operating in Malaysia. Six categories of survey variables were identified and then coded: EVM user profile, EVM organisation practice (organisation environment and EVM technical implementation - OE/TI), EVM maturity level (ML), EVM practice barrier, and EVM success factors. The conceptual framework developed for this research is illustrated in Figure 2.
Prior to the research survey, a preliminary survey was conducted with ten oil and gas practitioners who had no EVM experience. This survey skipped all the questions related to EVM practice, standard usage, EVM's contributions to project outcomes, and success factors for EVM implementation. These practitioners were asked to specify the reasons for not adopting EVM. The purpose of this preliminary survey was to understand the barriers to usage, which would allow the EVM community to refine EVM practice further and to provide better guidance for EVM. After the main interview survey, the findings were validated. This data validation stage involved eight randomly selected subject matter experts to validate the ratings. They also commented on the results and implications of the research outcome for the engineering managers. All of them had been involved in downstream and upstream projects. Two of the subject matter experts were directors, five of them were senior managers, and one was a programme/project manager. They had an average of 15 years of oil and gas experience. Their vast experience and involvement suggested that they were able to contribute relevant information to this research.
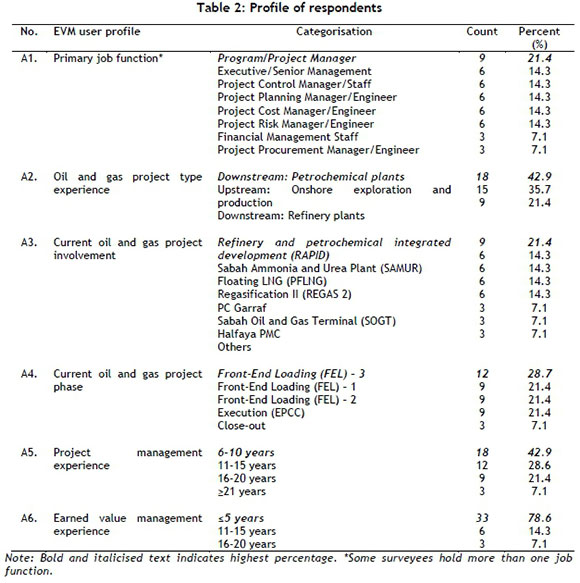
The profiles of the 42 respondents/EVM users involved in the structured interviews are shown in Table 2. The primary job functions of respondents included: project risk manager/engineer; project cost manager/engineer, project planning manager/engineer, project procurement manager/engineer, project control manager/engineer, financial management staff, programme/project manager, and executive/senior manager. The largest proportion of the respondents in 17 job functions were programme/project managers. The oil and gas project types included downstream: refinery plants, downstream: gas and power plants, downstream: petrochemical plants, upstream: offshore exploration and production (E&P), and upstream: onshore E&P. The largest of the oil and gas project types was downstream: petrochemical plants. The largest project involvement type was refinery and petrochemical integrated development (RAPID). The greatest number of projects were in the front end loading (FEL)-3 phase. The majority of the respondents had six to 10 years of project management experience and less than five years of experience in managing earned value.
4 DATA ANALYSIS
This study was designed to reveal perceptions of EVM practice in Malaysian oil and gas firms using the EVM practice analysis. The data collected were analysed using the percentage of responses for each question. The analysed data were then tabulated by option and percentage. The tabulated data were exported to Excel, and radar charts were generated. The radar chart is a graphical method for displaying multivariate data where magnitude is plotted on axes. This plot consists of a sequence of equiangular spokes, and each spoke represents a variable. The length of the spoke represents the magnitude of the variable. The plotted data are then connected with lines to form a star- or spiderlike diagram.
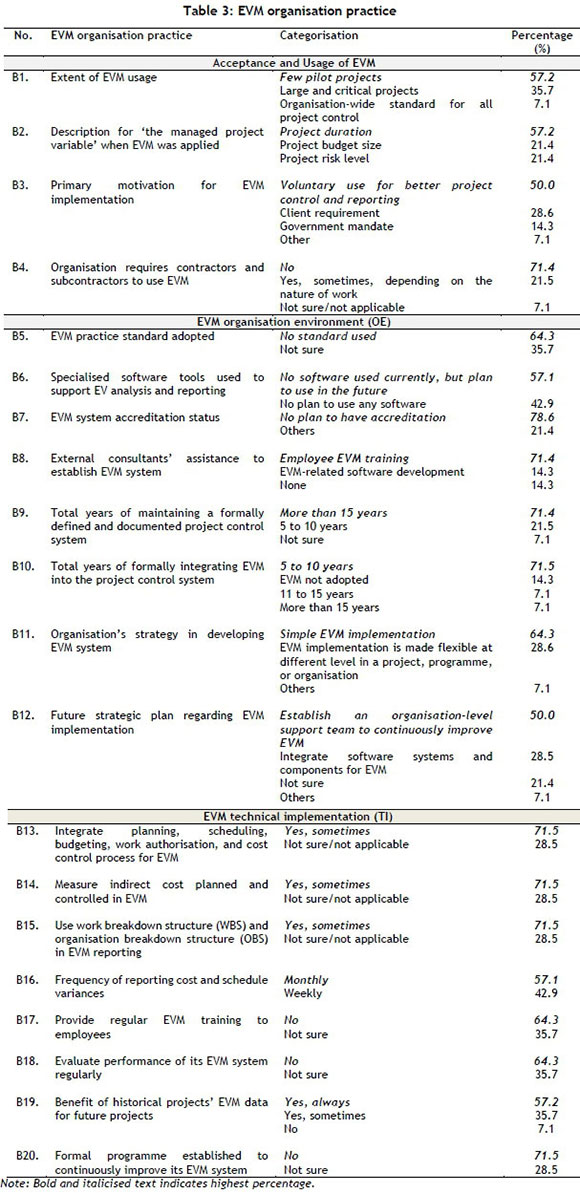
This study aimed to identify the current maturity level of EVM practice in Malaysian oil and gas firms. A close examination of Table 3 reveals that the practice of EVM methodology is still lack-lustre among oil and gas firms. For the overall EVM organisation environment (OE), there were no standards adopted, no software used, and no plans for EVM system accreditation. Employees were merely sent for external EVM training, despite the fact that EVM had been formally incorporated into project control systems for more than five years. This indicated that the implementation was established without further plans to improve upon or maximise the benefits of EVM. As for EVM technical implementation (TI), 71.5 per cent of the respondents responded 'sometimes' to integrate planning, budgeting, work authorisation, and cost control process for EVM, to measure indirect cost planned and controlled in EVM, and to use work breakdown structure (WBS) and organisation breakdown structure (OBS) in EVM reporting. More than 64 per cent responded 'no' when asked whether they provided regular training for employees on EVM or whether they provided regular monitoring of the EVM system or formal programmes to improve the system further. These results suggest little understanding, except among a handful of individuals, of the EVM technical usage and few plans for the optimisation of EVM.
Indicators of EVM maturity levels are represented in Figure 3. C1 represents Level 1 maturity, C2 represents Level 2 or localised maturity, C3 represents Level 3 or managed maturity, C4 represents Level 4 or managed maturity, and C5 represents Level 5 or an optimising maturity. A higher percentage of the responses (longer spoke/high magnitude) was found for C1, which averaged 81.9 per cent. This percentage is higher than all data points for the remaining maturity levels C2 to C5. Based on these results, Level 1 is the most common EVM practice level in Malaysian oil and gas projects.
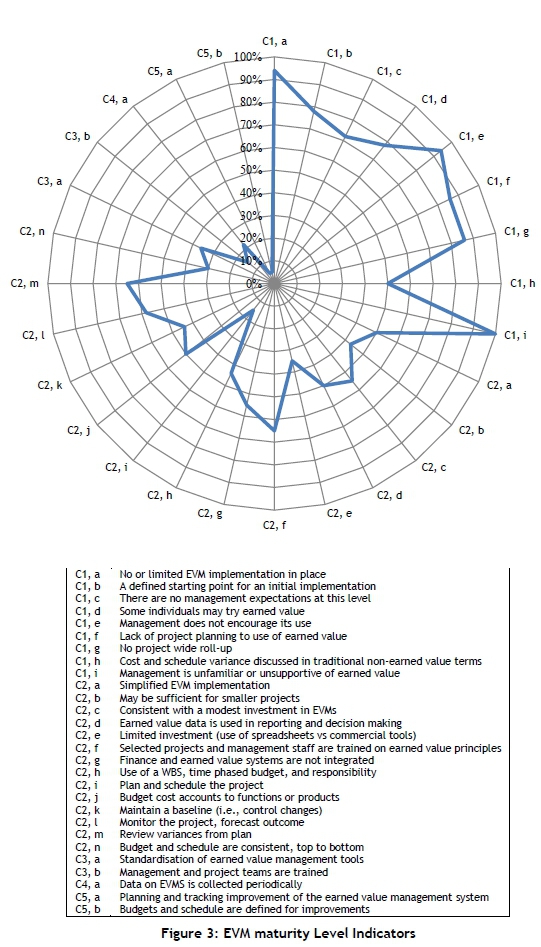
Figure 4 indicates that the top-ranked barrier to using EVM was "lack of motivation and top management support" with 86 per cent of the respondents identifying this as a barrier, followed by "tedious data collection procedure" at 79 per cent. Figure 5 shows that the top EVM implementation success factor was "top management support", with 91 per cent of respondents selecting this success factor, followed by "EVM training" at 89 per cent.
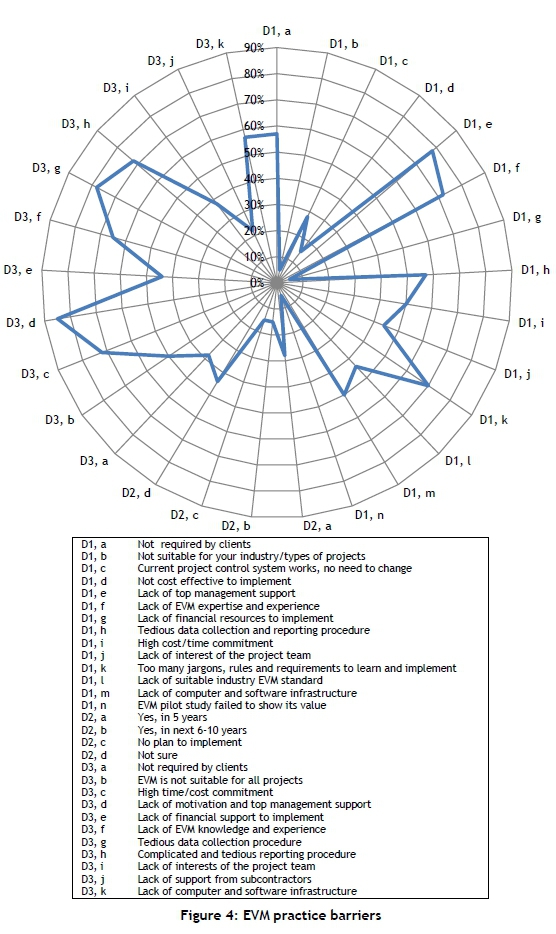
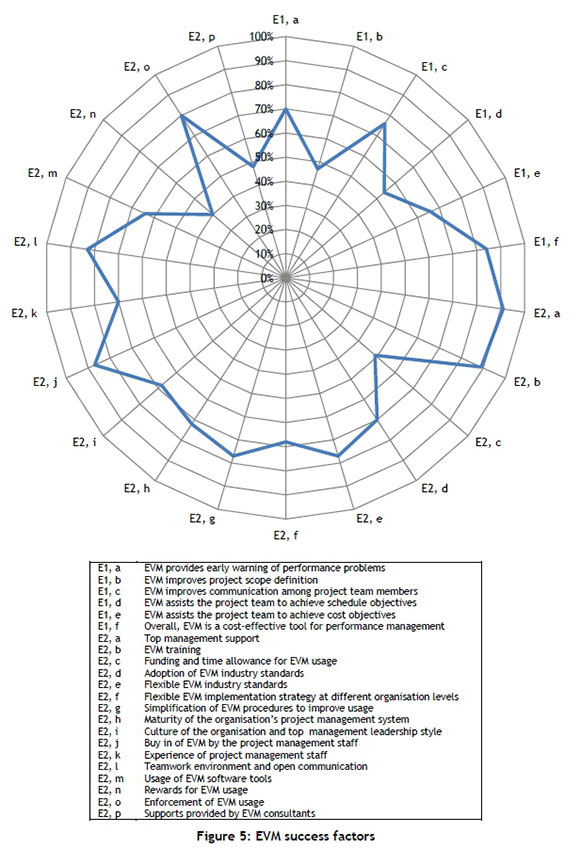
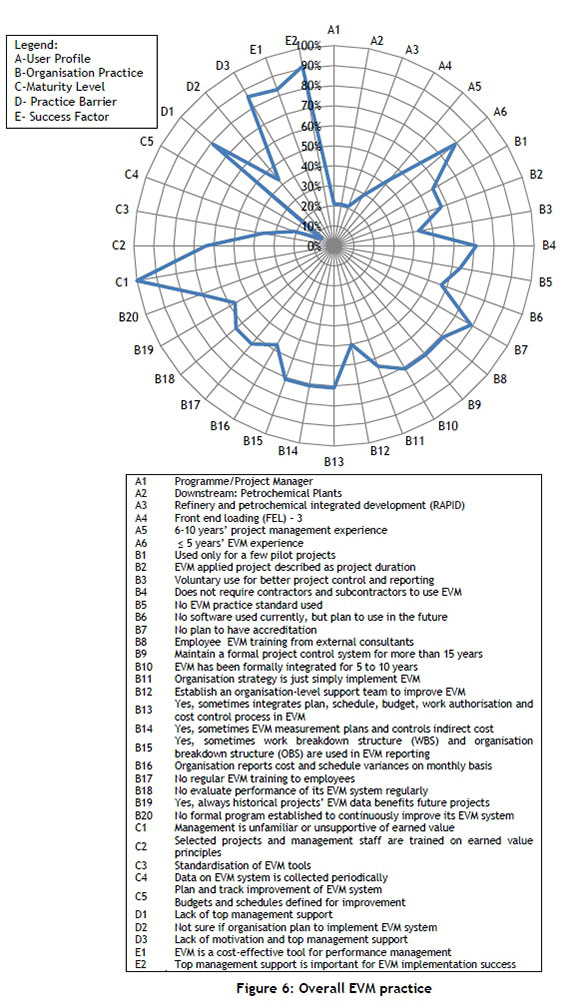
Figure 6 summarises an overall perspective of EVM practice in the oil and gas firms. Category A of the user profile showed that most respondents have less than five years' experience with EVM systems. The higher magnitude variables in category B for organisation practice were lack of EVM usage in projects (B4-B7) and little understanding of the EVM system (B13-B15). A distinct spoke with a magnitude of 100 percent for "management is unfamiliar or unsupportive of earned value" appeared in category C for maturity level. This also indicates that the maturity levels of oil and gas firms were at Level 1 - an initial stage with no or limited EVM implementation. For category D on practice barriers, lack of top management support was the top barrier to EVM implementation. This was affirmed with results from category E (success factors), which indicated that top management support is important for EVM implementation success. On the whole, the overall status of EVM practice in oil and gas projects indicates a lack of strong practices in nearly all categories.
5 DISCUSSION
This study was designed to develop an understanding of the current status of EVM usage and practice in oil and gas projects in Malaysian organisations. To understand practitioner perceptions of current EVM use better, the study data were used to measure current EVM practice maturity levels, barriers to acceptance and usage of EVM, and critical success factors for EVM implementation. The EVM maturity level was determined to be local and fairly limited. No or limited EVM implementation was in place, and it was less than fully compliant with ANSI 748 in the organisations studied. EVM barriers included lack of motivation and top management support, overuse of jargon, lack of EVM expertise and experience, EVM use not required by clients, tedious data collection processes and reporting procedures, and, finally, significant time and cost commitments to implement EVM. The critical success factors that were identified included top management support, buy in from project management staff, a strong teamwork environment, and open communication and training.
The eight experts commented that the large differences in the use of EVM organisation practice observed in Table 3 may be attributed to a number of possible factors. They include, but are not limited to, industry characteristics, organisation characteristics, project characteristics, and knowledge and experience, motivation, and cultural factors. The level of EVM usage and maturity varied from one organisation to another and also from one project to another. Aspects such as practice standard used, motivation for EVM implementation, level of usage, EVM maturity, decisions about EVM applicability, experience with EVM, EVM implementation strategy, and future plans, are ones to look for in assessing an organisation's EVM maturity.
The extent of EVM usage is related to how much it is required by the top management or client - in other words, the motivation to practise. From Figure 4, motivation for EVM usage was found to be moderately (not required by clients at 56 per cent, lack of top management support at 78 per cent) to strongly (lack of motivation and top management support at 86 per cent) associated with organisational practice. Mandatory use of EVM was deduced to be the leading factor in successful implementations of EVM systems, since EVM pilot study at five per cent, implementation of more than five years at 26 per cent, and implementation were weakly associated with EVM practice barriers. Three experts agreed that mandatory EVM implementation would push for EVM usage and thus witness its effective outcome.
EVM is applicable regardless of project type, as five per cent of respondents selected industry or project type as one of the EVM practice barriers (Figure 4). Budget appeared to be the most important EVM implementation decision factor (lack of financial resources to implement, at five per cent) for the respondents who believed that EVM may not be applicable. The subject matter experts added that the decision about EVM applicability is also influenced by other factors, such as duration, project type, risk level, and contract type, but to a lesser degree.
When the respondents were solicited for the EVM practice standard, four options were provided: first, no standard is used; second, the PMI EVM standard is used; third, the ANSI/EIA 748 and other standards are used; or lastly, not sure which standard is used. As shown in Table 3, most of the respondents revealed that no standard was in place (64.3 per cent) and the remainder were unsure (35.7 per cent). Neither the PMI standard nor the ANSI/EIA 748 standards were in practice. While the ANSI standard is primarily dominant in the government sector, the PMI standard was associated with EVM usage in the private sector, and was particularly popular outside of the U.S.
In Figure 5, EVM users in general "agree" to "strongly agree" with the statement that EVM contributes to providing early warning, helping to achieve cost goals, improving communication, helping to achieve schedule goals, and improving scope management. The level of agreement was also particularly high on statements related to the utility of EVM in providing early warning about performance issues, followed by the contribution of EVM to achieving cost objectives. EVM's contribution to cost performance (EVM assists the project team to achieve cost objectives, 65 per cent) is rated slightly higher than that of schedule performance (EVM assists the project team to achieve schedule objectives, 55 per cent). Five experts commented that EVM users recognised EVM's contributions in forecasting cost and schedule; however, more users perceived EVM as mainly a cost-effective tool for performance management.
The respondents were presented with a list of predefined issues obtained from the literature review and a few more from the preliminary survey. The major barriers from the main survey (Figure 4) were lack of top management support, lack of motivation, overuse of jargon, and various rules and requirements to learn and implement. In Figure 4, the majority of respondents agreed that lack of motivation and lack of expertise were the most significant barriers that lead organisations not to use EVM or to use EVM less frequently. The lack of motivation is a complex issue, and appears to be the result of a combination of other factors. A closer look at the factors shows that the lack of motivation can be traced to doubts about the applicability of EVM in different project environments (lack of suitable industry EVM standard, at 45 per cent, and EVM is not suitable for all projects, at 50 per cent) and about EVM's time- and cost-effectiveness (high time/cost commitment at 73 per cent). However, the same groups of users appear to "agree" or "strongly agree" that EVM is cost-effective (only 15 per cent of respondents selected 'Not cost effective to implement' as a practice barrier). The experts' comment on a possible explanation for these conflicting observations is that EVM appears to be applicable and cost-effective in certain types of projects, but not for all projects.
6 IMPLICATIONS FOR ENGINEERING MANAGERS
The interpretation of EVM for upstream and downstream oil and gas projects in the organisation may not be consistent. The experts commented that, depending on the experience of the upstream or downstream oil and gas engineering managers, some may take a narrower view of EVM and treat it as a control measure, while others may believe that EVM is an all-inclusive planning and control system. Such contradictory views of EVM may introduce some biases, such as the evaluation of EVM's contribution to project outcomes. The capability and benefit of EVM must be made known to allow organisations to benefit from EVM, particularly about projecting the cost and schedule at completion, and to underscore the possible need for corrective action [36]. In this respect, EVM application provides guidance for project managers in making informed decisions by providing a reliable forecasting method of the final cost and duration [37].
Since earned value forecasts cost and schedule, both cost and schedule performance indices should be incorporated in developing a monitoring system. When subjective parameters, which influence cost and schedule performance, are required in the monitoring system, knowledge and data can be acquired from experiences of domain experts in the industry. Examples of subjective parameters are management team capability, cash flow, material and equipment availability, labour availability and productivity, weather or other environmental influences, amount of rework, etc. The monitoring system should be designed to indicate cost and time, at any percentage of work performed, in order to estimate completion performance variations and to identify the need for corrective action. In oil and gas projects, this enables early warning about performance overruns, so that corrective action can be taken to prevent further decline; and a forecasting system recalculates the impact of future corrective actions on future performance. The accuracy of EVM results should be highlighted where averaging short time periods; for example, one to three days is more accurate than averaging over longer periods, such as one to three weeks, especially during the mid-stage of a project, when costs are often accelerating.
Numerous influencing factors were found to be attributed to the observed differences in EVM practice use, including characteristics of the industry and cultural factors. This is indirectly supported by the feedback on barriers that hinder the acceptance and usage of EVM. The experts commented that, owing to the conservative Asian culture of most organisations, engineering managers will have to introduce, initiate, and implement EVM to top management. Asians are less open to exploring a new tool or aid unless it is initiated by management. Some industries may not want to pool resources to kick-start EVM due to the lack of motivation from top management and the lack of EVM experts among the employees. Hence, a critical success factor for EVM implementation is top management support. To garner this support, top managers must be convinced of the long-term returns, despite significant initial start-up resources.
7 CONCLUSIONS AND RECOMMENDATIONS
This study investigated the current maturity level, practice barriers, and success factors of EVM practice in Malaysian oil and gas firms. Using a structured interview, data were collected from senior management of Malaysian oil and gas firms. Data were analysed using the EVM practice analysis. Using the EVM practice analysis portrayed in radar charts, this study found the barriers and success factors to improve the current maturity level of EVM practice. In Figure 6, the overall EVM practice showed that the respondents were a relatively young group of EVM users (80 per cent with less than five years of EVM experience). For organisation practice, the lowest rating is 'voluntary use for better project control and reporting' (43 per cent) and the highest rating is 'no plan to have accreditation' (80 per cent). This suggests that the organisations implemented EVM at a moderate level but not to its full potential, since some organisations implemented EVM voluntarily but had yet to achieve the level to opt for accreditation. The EVM maturity level is still low, as 100 per cent agreed with the statement, 'management is unfamiliar or unsupportive of earned value' while only five per cent of them are 'planning and tracking improvement of EVM system' or 'setting budgets and schedules defined for improvement'. The major EVM practice barriers are lack of top management support at 80 per cent, and lack of motivation at 87 per cent. Hence, the success factors to implement EVM are that EVM is a cost-effective tool for performance management (85 per cent) and that top management support is important for EVM implementation success (90 per cent).
This study contributes to the knowledge of EVM implementation in the oil and gas industry. Even though the current EVM maturity level may be low, the current effort is encouraging. The motivation from top management is definitely a key to push EVM implementation, as it is a cost-effective tool to be implemented. To encourage the use of EVM, performing organisations need to have an earned value management system (EVMS) in place that includes the process, procedures, tools, and templates [34]. This study also contributes to practice by assessing the level of maturity using EVM practice analysis. It looks into the specific items that contribute to five areas: user profile, organisation practice, maturity level, practice barriers, and success factors. An overall picture, similar to that of Figure 6, reveals the current EVM practice for the organisation to decide on the practice barriers and finding the success factors to improve the situation. To monitor the maturity level of the EVM practice in the oil and gas industry, this EVM practice analysis framework and survey can be repeated. In future research, the development of an EVM standard implementation guideline and framework for top management to enforce EVM practice effectively could be looked into.
ACKNOWLEDGEMENTS
Authors are grateful to the Fujian science and technology department for financial support through grant number (2019R0057); Quanzhou science and technology bureau for financial support through grant number (2018Z010), and Huaqiao University through grant number (17BS201).
REFERENCES
[1] Bryde, D., Unterhitzenberger, C. & Joby, R. 2018, Conditions of success for earned value analysis in projects. International Journal of Project Management, 36(3):474-484. [ Links ]
[2] Batselier, J. & Vanhoucke, M. 2017. Improving project forecast accuracy by integrating earned value management with exponential smoothing and reference class forecasting. International Journal of Project Management, 35(1): 28-43. [ Links ]
[3] Abdi, A., Taghipour, S. & Khamooshi, H. 2018. A model to control environmental performance of project execution process based on greenhouse gas emissions using earned value management. International Journal of Project Management, 36(3):397-413. [ Links ]
[4] Budd, C.I. & Budd, C.S. 2010. A practical guide to earned value management. 2nd ed. Vienna, VA: Management Concepts. [ Links ]
[5] Song, L. 2010. Earned value management 2010. Newtown Square, PA: Project Management Institute. [ Links ]
[6] Humphrey, W. 2011. Project management using earned value. 2nd ed. Orange, CA: Humphreys & Associates, Inc. [ Links ]
[7] Christensen, D.S. 1994. A review of C/SCSC literature. Project Management Journal, 25: 32-39. [ Links ]
[8] Christensen, D.S. & Heise, S.R. 1993. Cost performance index stability. National Contract Management Association Journal, 25(1): 7-15. [ Links ]
[9] Kerkhove, L.P. & Vanhoucke, M. 2017. Extensions of earned value management: Using the earned incentive metric to improve signal quality. International Journal of Project Management, 35(2):148-168. [ Links ]
[10] Silvius, A.J.G., Kampinga, M., Paniagua, S. & Mooi, H. 2017. Considering sustainability in project management decision making: An investigation using Q-methodology. International Journal of Project Management, 35(6):1133-1150. [ Links ]
[11] Fleming, Q.W. & Koppelman, J.M. 2010. Earned value project management. 4th ed. Newton Square, PA: PMI. [ Links ]
[12] Marshall, R.A. 2007. The contribution of earned value management to project success on contracted efforts: A quantitative statistics approach within the population of experienced practitioners. Journal of Contract Management, 4:21-33. [ Links ]
[13] Department of Engineering. 2005. Earned value management application guide. Washington, DC: DOE. [ Links ]
[14] Department of Engineering. 2008. Earned value management system (EVMSL DOEG 413.3-10). Washington, DC: DOE. [ Links ]
[15] Kerzner, H.R. 2017. Project management: A systematic approach to planning, scheduling and controlling. 12th ed. Hoboken, NJ: John Wiley & Sons, Inc. [ Links ]
[16] Kim, E.I., Wells, G.W. & Duffey, M.R. 2003. A model for effective implementation of earned value management methodology. International Journal of Project Management, 16(5):375-382. [ Links ]
[17] Lipke, W. 2009. Earned schedule: An extension to earned value management for managing schedule performance. Sydney: Lulu Publishing. [ Links ]
[18] Solomon, P.J. 2008. Integrating technical performance with earned value management. The Measurable News, 2008(2):15-22. [ Links ]
[19] National Aeronautics and Space Administration (NASA). 2011. Earned value management handbook (NASA/SP-2011). Washington, DC: NASA. [ Links ]
[20] Piyush, S. 2009. Earned value management. New Delhi: Global Indian Publications Pvt. Ltd. [ Links ]
[21] Petronas. 2012. International exploration & production. Available from [Accessed 11 March 2019]: http://www.petronas.com.my/our-business/exploration-production/Pages/international-ep.aspx [ Links ]
[22] Nutavoot, P. 2004. Partnerships in oil and gas production-sharing contracts. International Journal of Public Sector Management, 17(5):431-442. [ Links ]
[23] Pier Design. 2006. Earned value analysis: The only tool required for project management. Available from [Accessed 8 May 2019]: http://pierdesign.ca/index_eva.htm. [ Links ]
[24] Wood, D.A. 2017. High-level integrated deterministic, stochastic and fuzzy cost-duration analysis aids project planning and monitoring, focusing on uncertainties and earned value metrics. Journal of Natural Gas Science and Engineering, 37:303-326. [ Links ]
[25] Allen, S. 2000. Development of a work monitoring, evaluation and improvement process. Engineering Management Journal, 10(3):135-141. [ Links ]
[26] Mackellar, G.W. 1991. Time and resource management: The time plan. Engineering Management Journal, 1(2):77-81. [ Links ]
[27] Elphick, B. 1992. Linking the use of resources to project progress. Engineering Management Journal, 2(6):279-282. [ Links ]
[28] Standards Australia. 2006. Project performance measurement using earned value. Sydney: Council of Standards Australia. [ Links ]
[29] Project Management Institute. 2017. A guide to the project management body of knowledge (PMBOK Guide). 6th ed. Newtown Square, PA: Project Management Institute. [ Links ]
[30] Project Management Institute. 2011. Practice standard for earned value management. 2nd ed. Newtown Square, PA: Project Management Institute. [ Links ]
[31] Stratton, R.W. 2006. The earned value management maturity model. Plymouth, UK: Management Concepts. [ Links ]
[32] Neuman, W.L. 2003. Social research methods: Qualitative and quantitative approaches. 5th ed. New York: Pearson Education Inc. [ Links ]
[33] Kennedy, M.K. & Vargus, B. 2001. Challenges in survey research and their implications for philanthropic studies research. Nonprofit and Voluntary Sector Quarterly, 30(3):483-494. [ Links ]
[34] Lukas, J. A. 2008. Earned value analysis - Why it doesn't work. AACE International Transactions, EVM.01:1-10. [ Links ]
[35] Chen, H.L., Chen, W.T. & Lin, Y.L. 2016. Earned value project management: Improving the predictive power of planned value. International Journal of Project Management, 34:22-29. [ Links ]
[36] Anbari, F.T. 2003. Earned value project management method and extensions., Project Management Journal, 34(4):12-23. [ Links ]
[37] Lipke, W., Zwikael, O., Henderson, K. & Anbari, F. 2009. Prediction of project outcome: The application of statistical methods to earned value management and earned schedule performance indexes. International Journal of Project Management, 27:400-407. [ Links ]
Submitted by authors 14 Aug 2018
Accepted for publication 18 Oct 2019
Available online 12 Dec 2019
* Corresponding author: derekisleon@gmail.com


