


Services on Demand
Article
 English (pdf)
 Article in xml format
 Article references
Indicators

Related links
-
 Cited by Google
 -
 Similars in Google
Share

 Permalink
South African Journal of Industrial Engineering
On-line version ISSN 2224-7890
Print version ISSN 1012-277X
S. Afr. J. Ind. Eng. vol.30 n.3 Pretoria Nov. 2019
http://dx.doi.org/10.7166/30-3-2235
SPECIAL EDITION
Finding the Four Qualities of Intelligent Industrial Reporting
L.A. Botes*, #; W. Hamer†; S. van Jaarsveld†; M. Kleingeld
North-West University, Centre for Research and Continued Engineering Development (CRCED-Pretoria), Pretoria, South Africa
ABSTRACT
Internationally, innovation and technology are driving change through concepts such as 'Industry 4.0'. However, due to various constraints, South Africa is lagging behind in this transformation. Furthermore, local industry generates large amounts of data that could contribute to a positive transformation. Data analytics, in the form of reporting, may therefore present a workable alternative to understand better the intricate nature of real-world operations. This paper identifies four qualities for the practical application of data analytics, with the aim of intelligent reporting. The four qualities are focus area, data availability, analytics, and visualisation. Research on each quality shows that they have various levels. A comprehensive literature review supports these findings. Forty studies are included that were selected through a process of relevant research criteria. A case study is presented to show how the four qualities contribute to the development of intelligent reports as an objective representation of industry performance.
OPSOMMING
Internasionaal dryf innovasie en tegnologie verandering deur konsepte soos Industrie 4.0. Weens verskeie beperkings is Suid-Afrika egter agter in hierdie transformasie. Verder genereer die plaaslike industrie groot hoeveelhede data wat kan bydrae tot 'n positiewe transformasie. Data analise, in die vorm van verslaggewing, kan n werkbare alternatief bied om die ingewikkelde aard van werklike prosesse beter te verstaan. Hierdie artikel identifiseer vier kwaliteite vir die praktiese toepassing van data analise met die doel van intelligente verslaggewing. Die vier eienskappe is onderskeidelik fokusarea, beskikbaarheid van data, data analise en visualisering. Navorsing oor elke kwaliteit toon dat hulle uit verskillende vlakke bestaan. n Deeglike literatuurstudie ondersteun hierdie bevindings. Veertig studies is ingesluit wat geselekteer is deur n proses van toepaslike navorsingskriteria. n Gevallestudie word aangebied om te illustreer hoe die vier eienskappe bydrae tot die ontwikkeling van intelligente verslae.
1 INTRODUCTION
1.1 The growing role of data and analytics in industry
Globally there is a drive for change in the technological innovation field. This change, known as the fourth industrial revolution, is becoming increasingly popular [1]-[3]. It follows the first, second, and third industrial revolutions, each of which significantly impacted production processes. The first industrial revolution made use of water- and steam-powered mechanical production facilities. Thereafter, during the second industrial revolution, the introduction of electricity enabled mass production processes. The third industrial revolution further automated production by using electronics and information technology. Today we are experiencing the fourth industrial revolution, also known as Industry 4.0 (I4.0). This revolution is based on cyber-physical-systems [1]-[3].
Unfortunately, South African industries are falling behind in implementing I4.0. In a study that set out to evaluate I4.0 readiness [4], South African industries were ranked as 'beginners'. This ranking was obtained through a survey that considered the awareness and implementation of I4.0.
South Africa's lag in this transformation may be attributed to various constraints - the top three being a lack of digital culture, insufficient talent, and the requirement of high financial investment [2]. Due to these constraints, the implementation of advanced technologies may be seen as a strenuous and inopportune task for South African industries.
Despite this lag, South African industries generate a large amount of data that is increasing in volume, velocity, and variety. However, many industries only make use of a fraction of their captured data for valuable decision-making [5], [6]. This leaves scope to use this data as a positive contribution to I4.0. Data analytics has been identified as a powerful tool in I4.0 [7], [8]. Industries producing large amounts of data can thus implement data analytics despite the inhibiting factors. This would serve as an initiating step towards I4.0 readiness.
The application of data analytics in the form of reporting will present data as an alternative to real operations and analytics as an alternative to real performance, and enhance data-driven decision-making as an alternative to conventional practices. Business intelligence can therefore be improved by more intelligent reporting. This study will focus on identifying the qualities that can be used to evaluate reporting intelligence to assist with practical applications.
1.2 Research questions towards practical application
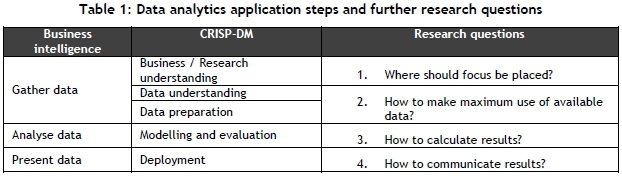
In industry, the term 'business intelligence' is used to describe the use of technology to gather, analyse, and present data for managerial purposes [9]. These generic steps are shown in the first column of Table 1. They can be aligned with the steps required by the cross-industry standard process for data mining (CRISP-DM) [10], as shown in the second column of Table 1. The steps from both of these fields were used to identify the core questions that need to be addressed in their practical application in industry. Therefore, the third column in Table 1 summarises four research questions for further evaluation.
This study proposes that data-driven decision-making needs to be promoted as a first step towards implementing I4.0 initiatives in established industries. An opportunity exists to use existing data sources that are currently underused. The challenge is to make this practically applicable for industries that are comfortable with conventional data applications.
This paper therefore aims to identify the qualities for intelligent reporting based on the research questions above. This is done by conducting a comprehensive literature review on each of the research questions. From this review, the four qualities associated with intelligent reporting are described. Practical applications from the literature are then reviewed to test the relevance and occurrence of the identified qualities (Section 2). Lastly, the identified qualities are tested and validated by a case study (Section 3).
2 RESEARCH METHOD
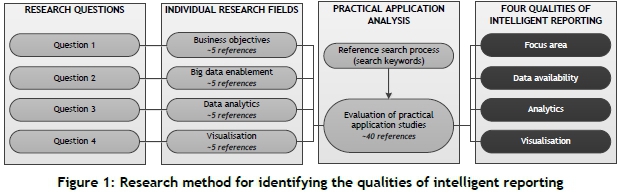
This section attempts to address the research questions (identified in Table 1) while aiming to identify the qualities of intelligent reporting. Firstl individual fields of the literature about each of the questions are evaluated. Second, studies focusing on the practical application of analytics are reviewed according to each of the research questions, as well as the information obtained in each of the individual research fields. The research method is depicted in Figure 1.
2.1 Individual research fields
Four individual research fields were evaluated to address the four research questions. The four fields include business objectives, big data enablement, data analytics, and visualisation.
Establishing focus areas through business objectives (Question 1)
A suitable focus area should be driven by business objectives [11], [12]. In a study undertaken by Kritzinger [11], it was stated that performance measurement should be linked to key business goals and drivers. Sondalini [12], in another study, highlighted that key performance indicators (KPIs) should match corporate goals. Business objectives thus form a crucial part in developing intelligent and functional reporting.
A review of the relevant literature [11], [12] emphasised the necessity to link a strategic objective to an executable task at an operational level. It is therefore practical to divide the business into a hierarchy of levels to illustrate the focus area. Furnham [13] stated that, through performance measurement, management is possible through a holistic view of complex underlying systems. A hierarchy of levels would thus ensure traceability from a management level to a parameter that is measured or manipulated at the level of execution (i.e., each complex underlying system).
Sondalini [12] suggested that KPIs should be created by a 'top-to-bottom' approach of an organisation. Three levels of an organisation are suggested to achieve this: corporate, site, and department and individual. It is suggested that corporate goals be used to establish the purpose of KPIs (top-to-bottom). Meanwhile, the bottom-up approach is used to achieve the goals and KPIs from the department and individual level.
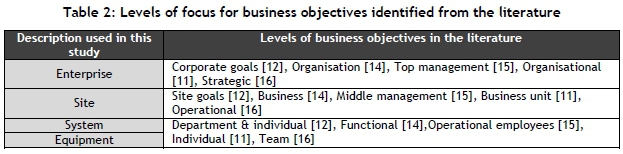
In the studies referenced above, the focus is placed on various levels of an organisation, depending on the specific business objectives. A detailed analysis of performance measurement and business objectives was performed, and is summarised in Table 2. The analysis of various studies [11], [12], [14]-[16] revealed that different levels of focus areas or objectives are suggested. The different levels suggested by these studies were consolidated into four levels, and are referred to in this study as the enterprise, site, system, and equipment levels.
'Enterprise' refers to the highest level of an organisation. On this level, strategic business objectives are set and high-level management decisions are made. The second-highest level includes the different sites within an organisation. Within a site, different systems and kinds of equipment are used. 'System' refers to individual departments or systems within a site. The lowest management level is the equipment level. This refers to the specific level of execution, and contains the highest amount of detail.
Establishing these levels of focus areas is critical to ensure that reports are traceable from strategic goals to a specific execution level. The various levels also aid in the practical functionality of reports by reporting to various levels within an organisation, according to their specific business objectives.
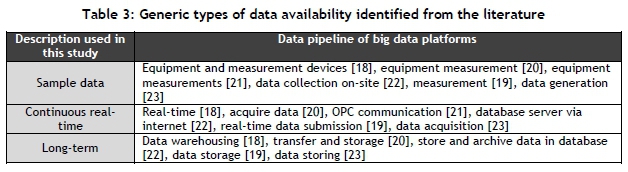
Identifying data availability through big data enablement (Question 2)
The big data enablement research field was evaluated to understand the flow of data within big data platforms. This helps to understand what data is available in order to know how to make maximum use of it, thus addressing the second research question.
'Big data' is used to refer to the speedy capturing (high velocity collection) of data that consists of large volumes of varyingly complex datasets [17] [18]. The term 'big data' has become relevant in recent times due to the increased volume of data generation in industry. As an example, it is predicted that by the year 2020 the amount of data in China will be ten times the amount it was in 2013 [19]. Big data platforms are necessary to manage this variety and volume of generated data, by making use of specific technologies and tools [17] [18] [19].
Various studies concerning big data platforms [18]-[23] were evaluated. From these studies it was found that measurement instrumentation installed on equipment forms the initial stage in the data pipeline. The data can be viewed in real-time on a Supervisory Control and Data Acquisition (SCADA) system, and local data historians are generally used to store the data for a short period of time. The local historian typically stores the data for a three- to six-month period. This enables the collection of sample data from the local historians. An Open Platform Communication (OPC) connection can be configured to enable data loggers to collect the data continuously (an increase in the velocity of data acquisition). This process allows users to view and analyse a variety of measurement variables from remote locations (an increase in data variety). The data can also be stored in a database, which then creates the long-term availability of data (an increase in data volume).
The studies evaluated make use of different structures and techniques within their big data platforms; however, the data pipeline remains consistent. Table 3 summarises three generic types of data available within the data pipeline identified from the various studies. The available data consist of sample data, continuous real-time data, and long-term data. These generic types of data availability identified from the literature [18]-[23] are used as the levels of data that can be used in reporting applications.
The different forms of data availability will influence reporting intelligence. Sample and continuous availability of data distinguishes whether reports will be a once-off or a continuous application. This in turn influences the ease of reporting, since sample data will be a manual process, while a continuous inflow of data can be used to develop automated reports. Furthermore, the use of long-term data will allow the evaluation of the trend of performance (i.e., improvement or deterioration).
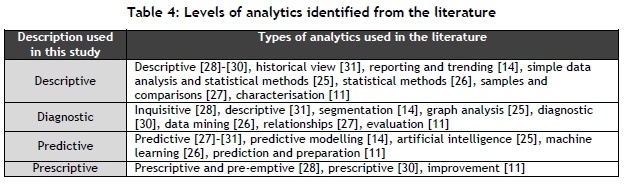
Calculations through analytics (Question 3)
Analytics are used to convert raw data to knowledge and wisdom. This conversion enhances the value of the data [24], while also reducing the level of detail. Reporting on raw data trends containing too much detail restricts the data from being used in valuable decision-making. Therefore, analytics are crucial in intelligent reporting.
Numerous analytical methods exist, and are covered extensively in the available literature[14], [25]-[27]. Some common methods include counts, statistical methods, classification, regression analyses, decision trees, and artificial intelligence. Each of the analytical methods varies not only in computational complexity, but also in the complexity of the questions it addresses.
Therefore, the various types of analytical methods are classified into different types of analytics. Various studies have a different classification of analytics. However, this classification generally includes descriptive, diagnostic, predictive, and prescriptive analytics. Each of the classifications increases in complexity and value. Table 4 summarises the classification of analytics by various studies, as well as by the description used in this study.
Descriptive analytics is used in reporting simply to describe occurrences by making use of past and present data without addressing complex questions. Diagnostic analytics, however, investigates what has happened by highlighting the causes and effects of occurrences. This level of reporting is useful in providing actionable information and transferring knowledge about influencing factors to real operations. Predictive analytics aims to identify what will happen in the future by making use of historical data to predict future outcomes. Reporting on predictive analytics is valuable for planning ahead. Prescriptive analytics is a form of predictive analytics, but also prescribes actions to the decision-maker about multiple possible predictions. A report's intelligence can be improved by addressing more complex questions to aid with specific decision-making scenarios by specifying the level of analytics.
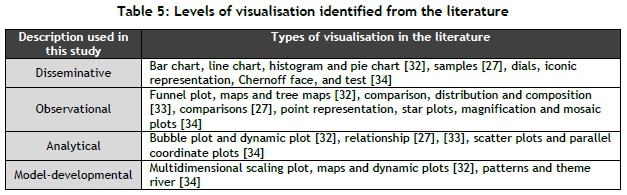
Communicate through visualisation (Question 4)
The visualisation of the completed data analysis is critical when reporting on an organisation's performance. Visualisation forms part of information processing. It assists in extracting information from data to enable decision-making which, in turn, leads to action.
Similar to analytical methods, numerous visualisation methods are widely used. These methods are available in the existing literature [27], [32]-[34]. The literature [27], [34], [32] has shown that typical methods include bar charts, line graphs, histograms, waterfall charts, pie charts, scatter plots, and bubble plots.
A study done by Chen and Golan [35] identified four levels of typical visualisation methods. These levels are disseminative, observational, analytical, and model-developmental. Each level of visualisation increases in the complexity of the question it addresses, as well as the number of variables considered. Disseminative visualisation does not address any questions - it informs users about the data (e.g., single variable line graphs). The aim of observational visualisation is the speedy and intuitive observation of the data; this visualisation answers what has happened. Analytical visualisation shows the relationship between variables, and thus answers what the variable relates to. The fourth level of visualisation - model-developmental - aids in the development of existing and new models or methods. It answers what the steps are from one situation to the next.
The first column of Table 5 lists the four levels identified by Chen and Golan [35]. These are also the levels used in this study. The second column summarises the visualisation methods identified by other studies. These methods are grouped according to the questions they address, as recommended by Chen and Golan. Each of the levels identified by Chen and Golan were verified by other studies.
Therefore, the levels recommended by Chen and Golan are also used to describe the levels of visualisation available in this study.
The usability of a report can be improved by making use of the appropriate level of visualisation. For instance, a focus on disseminative visuals may cause an information overload when used in the incorrect context. It is therefore critical that the chosen level of visualisation displays information and knowledge in such a way that it aligns with the overlying need of the report.
Summary
In this section, the four research questions (identified in Section 1) were addressed by evaluating four individual research fields. This review identified the four qualities attributed to intelligent reporting. It was also noted that each of the qualities consists of various levels that influence reporting intelligence. The use of these qualities and their associated levels in practical applications should, however, still be tested and verified. This will be addressed in the next section.
2.2 Practical application analysis
In this section, a literature review is presented to support the identified qualities and levels from the previous sections. This is done by evaluating how these qualities are addressed in practical applications. Studies of the practical application of data analytics were obtained by making use of the following key words:
• Analytics
• Practical application
• Industrial
• Data-driven
• Performance measurement / metric
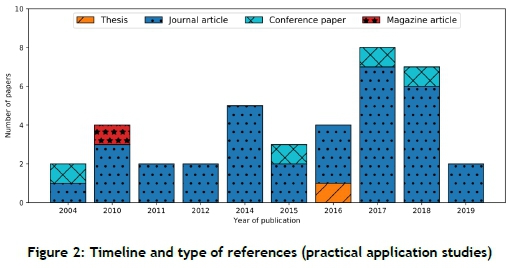
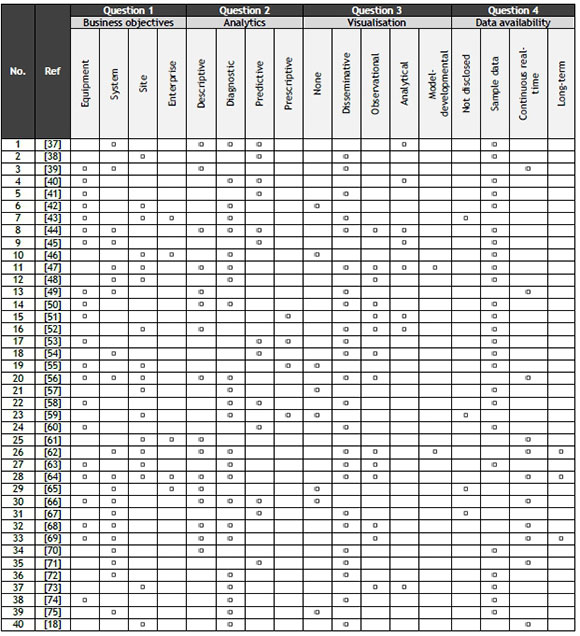
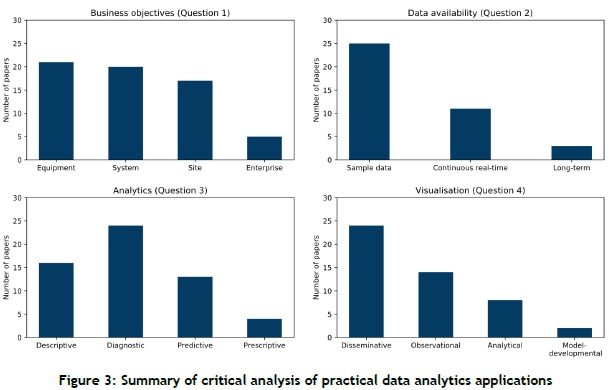
The references obtained were filtered according to their titles and abstracts to ensure relevance. Forty references were used in the final review. Figure 2 shows the timeline and type of references used. The majority of the references (86 per cent) consist of journal articles.
Each reference was evaluated according to the qualities described in the previous section, as well as the levels identified. The four qualities include focus area, data availability, analytics, and visualisation. The detailed review can be seen in Appendix A. A summary of the review is shown in Figure 3.
Figure 3 shows that the application of data analytics takes place across the four qualities and their respective identified levels. This verifies the identified qualities and levels. During the review, however, it was noted that none of these studies provides a framework that considers the various qualities with their associated levels. Therefore, providing guidelines for the use of the four qualities and their respective levels for intelligent report development can be evaluated in future work.
2.3 Four qualities of intelligent reporting
Evaluation of the research fields aided in identifying the qualities of intelligent reporting: focus area, data availability, analytics, and visualisation.
The evaluation also identified that each of the qualities could be divided into various levels. The identified qualities, as well as their respective levels, were verified by 40 studies related to practical applications. The levels associated with each quality add an additional level of complexity to the generic steps recommended by the CRISP-DM and business intelligence. Due to this additional level of complexity, it is recommended that implementation guidelines of data analytics be evaluated in future work. The multiple levels would lead to multiple analytical application options. Therefore, it is recommended that the proposed guidelines be of an iterative / agile nature in order to achieve rapid results.
The qualities and their respective levels identified in this section are summarised in Table 6.
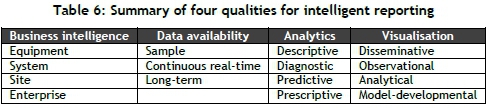
The four qualities are necessary for intelligent reporting of industrial processes. The identified levels are valuable in evaluating the status of an existing application. It should, however, be investigated whether these qualities can be practically used to improve existing applications. The next section will therefore illustrate how the four qualities and their respective levels can be used to aid in the improvement of reporting intelligence in a case study.
3 CASE STUDY & DISCUSSION
3.1 Case study selection
Numerous data applications exist in practice. For the purpose of this paper, a case study from the South African mining industry was selected to test the four qualities identified and described in the previous section. The pressure the mining industry is under to improve the uptake of new technology in order to improve operations and sustainability [6], [36] provides excellent opportunities for I4.0-based implementations.
In this section, a condition monitoring application in the mining industry is evaluated. Condition monitoring entails monitoring parameters that directly relate to the condition of equipment. Condition monitoring forms a crucial part of condition-based and predictive maintenance. This allows corrective actions on faulty equipment before critical failures occur, as opposed to reactive maintenance where equipment is maintained as a result of a failure.
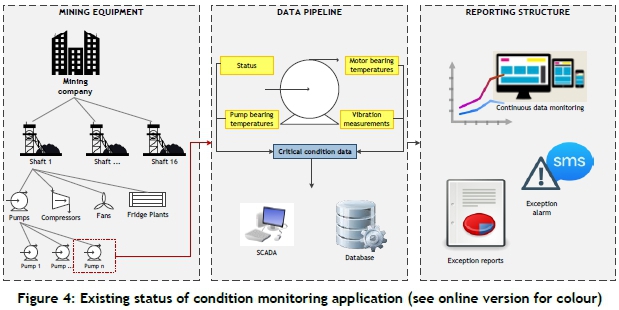
The existing status of the condition monitoring application is depicted in Figure 4. The critical mining equipment is shown in the left block, while the data flow of the condition monitoring data is shown in the second block. This data is then used for various reporting applications, which are shown in the third block.
As indicated in the left block of Figure 4, condition monitoring parameters are measured on various items of equipment on sixteen mine shafts. This equipment includes pumps, fans, compressors, fridge plants, and mills. This equipment forms part of the main systems necessary for daily mining activities to take place. As an example, the measured condition monitoring parameters of a pump are indicated in the middle block of Figure 4.
The measured data is available locally via the on-site SCADA system. An OPC connection then facilitates the data acquisition process, which provides users access to the condition monitoring data in continuous real-time. Finally, as data is acquired, it is stored in a cloud database. The stored data is used for various reporting purposes, as indicated in the right block of Figure 4.
The data is used to develop continuous real-time graphs of the condition monitoring parameters. 2100 graphs are continuously available on a daily basis for the various mining shafts. Upper limits are set for each parameter, and once a parameter exceeds a given limit, an SMS is sent to relevant mining personnel. On average, 4 400 SMSs are sent per month. Daily reports are also sent out for each of the mining shafts. This report summarises the exceptions of limits that occurred the previous day.
It is noted that the case study in its existing form already provides a basis for data-driven decision-making. However, it is not clear to what extent the existing application provides the end-user with actionable information. It is also not clear whether the reports being generated are usable to their full extent. This case study application is therefore evaluated in the next section according to the four qualities. This evaluation will then be used to identify the possible improvements relevant to each of the four qualities. Lastly, the information gained is used to discuss the potential value of the condition monitoring application.
3.2 Initial evaluation of reporting intelligence qualities
In this section, the existing condition monitoring reporting is evaluated according to the four qualities identified in this study. A large amount of information is available due to the numerous limit exceptions on a daily basis. This information is available in the form of single variable trends in the existing application. The graphs only describe what is already happening with each parameter. Therefore, the analytics and visualisation qualities will be descriptive and disseminative respectively. Furthermore, although data is reported in a real-time manner, there is no long-term indication of equipment deterioration. Lastly, the condition monitoring parameters are measured and reported on an equipment level. Table 7 shows the levels to which the existing application adheres (indicated by shaded cells).
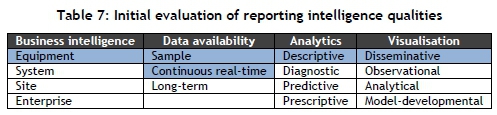
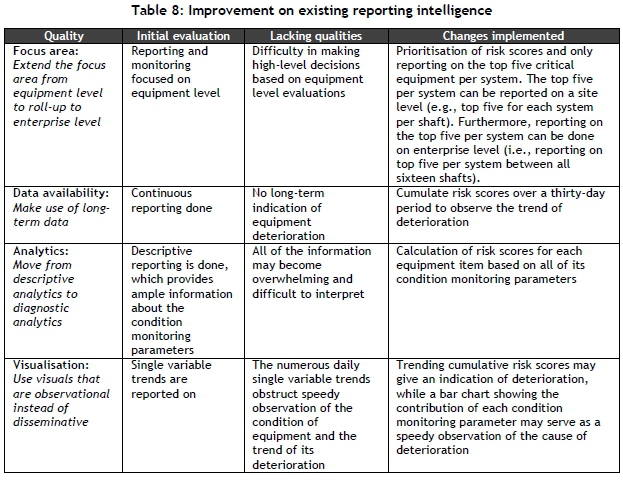
In a study focusing on the condition monitoring of gold mining equipment [20], it was suggested that the condition monitoring data be evaluated on a system level, making use of long-term data and using risk scores to identify the severity of equipment condition. From the evaluation in Table 7, it can be seen that each of the suggestions made by van Jaarsveld [20] would improve the intelligence of the existing method of reporting. These suggestions are therefore also used in this study. The risk scores are, however, cumulated over a thirty-day period in this study to indicate the trend of deterioration. Furthermore, the cumulated risk scores are used to rank and prioritise the various equipment's conditions. Only the top five critical equipment items are reported on. The reporting is done per system: reports are generated per shaft (i.e., top five per system for specific shaft) and enterprise (i.e., top five per system between all sixteen shafts). Table 8 presents the initial evaluation, the qualities lacking, and the implemented changes needed for improvement. Table 8 illustrates how each of the four qualities is used to evaluate the existing report, and how the levels within each focus area are used to identify areas of improvement.
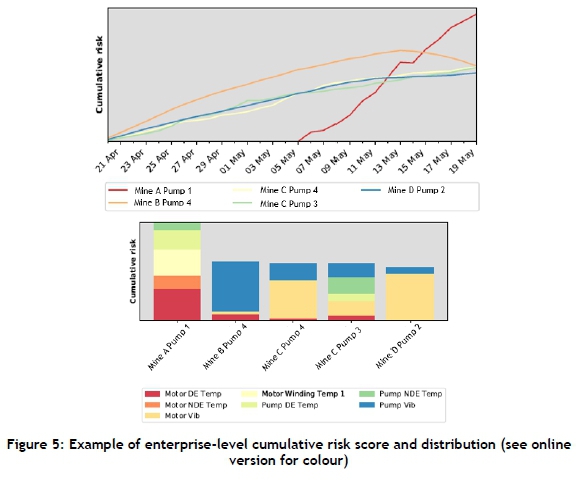
Figure 5 shows an example of an enterprise-level report for a pumping system. The two graphs in Figure 5 present the cumulative risk scores (Figure 5a) and the contribution of each condition monitoring parameter to the cumulated risk score (Figure 5b). Similar graphs can be obtained for each of the mining systems (e.g., pumps, fans, compressors, fridge plants, and mills).
3.3 Succeeding evaluation of reporting intelligence qualities
After implementing the changes described in Section 3.2, the analytics and visualisation qualities changed to a diagnostic and observational level respectively. This enabled actionable information that could be used to make decisions about equipment maintenance. The data availability not only made use of continuous data, but also a longer period of data to indicate deterioration over time. Lastly, the condition monitoring could be reported on an equipment, system, site, and enterprise level by prioritising the risk scores. Table 9 shows the succeeding evaluation of reporting intelligence qualities, indicated in lightly shaded cells.
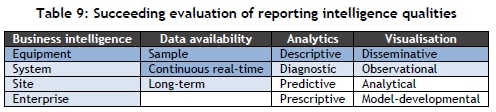
The resultant evaluation in Table 9 clearly indicates that the next steps include predictive analytics and analytical visualisation. Predictive analytics for this specific case study would include predicting equipment failures or lifetimes, to enhance maintenance planning. Analytical visualisation would be useful to indicate the relationship of the predicted lifetime and the respective influencing variables, which would enhance awareness of knowledge. The identified qualities and associated levels can therefore be used as criteria to motivate further improvements. Intuitively, the levels show what can be done incrementally to guide and motivate more intelligent reporting.
In this application, the condition monitoring data served as an alternative to real equipment conditions. Decisions could be made based on data analytics instead of intuition. Implementation did not require capital expenditure, since a big data framework was already available. The application of data analytics in the form of reporting showed the value of relying on digital concepts, thus enhancing the growth of a digital culture - both of which are seen as inhibiting factors towards I4.0 in SA. Therefore, the application of data analytics can be seen as an initiating step towards I4.0.
3.4 Potential value of application
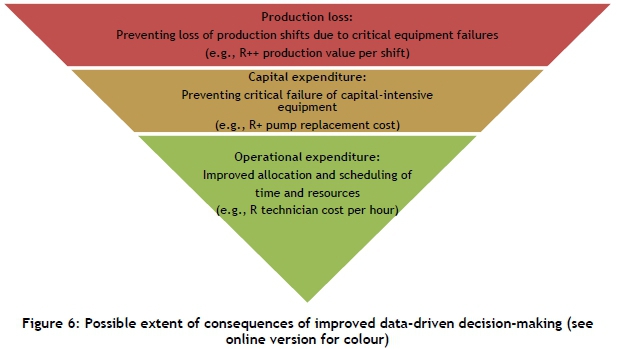
In the presented case study, the awareness of equipment condition was prioritised and rolled up to enterprise level. Reporting at this level is valuable, since most decisions on the expenditure of capital, time, and resources are made at this level. Using these resources on equipment maintenance can thus be based on informed decisions. Additionally, being unaware of the most critical equipment could have various consequences, the severity and financial implications of which may vary according to specific situations. Figure 6 illustrates the possible extent of these consequences.
The lowest level in Figure 6 represents operational expenditure, which refers to the improved allocation and scheduling of time and resources by maintaining the correct equipment. The second level in Figure 6 represents the prevention of large capital expenditure. This can be achieved by maintaining the relevant equipment and, in turn, preventing the critical failure of capital-intensive equipment. The most financially intensive consequence will be the loss of production. Prevention of production loss can be achieved by preventing the critical failure of equipment that directly influences production. These consequences validate the necessity of prioritising equipment condition.
4 CONCLUSION
Four research questions were identified from the CRISP-DM and general steps of business intelligence. Individual research fields were investigated to address the research questions. From these critical reviews, the four qualities contributing to intelligent reporting were identified. These qualities include establishing a focus area, data availability, analytics, and visualisation. The individual research fields further showed that each quality consists of various levels of implementation. A comprehensive literature review of practical application studies supports the qualities and the applicability of the defined levels.
A case study was presented to test and validate the four qualities. The selected case study made use of mine condition monitoring data as an alternative to the real equipment's condition. This data is used to improve condition-based maintenance strategies. The four qualities were used to evaluate the current intelligence of the case study's reporting. It could also be used to identify areas for improvement. The results indicate that the four qualities can be used to evaluate the intelligence of an existing data application so that it can intuitively show how it can be expanded to improve data-driven decision-making.
REFERENCES
[1] Kagermann, H., Wahlster, W. and Helbig, J. 2013. Recommendations for implementing the strategic initiative Industrie 4.0. National Academy of Science and Engineering, Germany, Final report of the Industrie 4.0 working group. [ Links ]
[2] Slusarczyk, B. 2018. Industry 4.0 - Are we ready? Polish Journal of Management Studies, 17(1), 232-248. [ Links ]
[3] Rojko, A. 2017. Industry 4.0 Concept: Background and Overview. International Journal of Interactive Mobile Technologies, 11(5), 77-90. [ Links ]
[4] Dewa, M.T., Adams, D.Q., Tendayi, T.G., Nyanga, L., Ganduri, L. and Gxamza, M. 2018. Industry 4.0: A myth or a reality in South Africa? in Proceedings of the South African Institute for Industrial Engineers Annual Conference, October 2018, 649-666. [ Links ]
[5] EY and Nimbus Ninety. 2015. Becoming an analytics-driven organization to create value. A report in collaboration with Nimbus Ninety. [Online]. Available: https://www.ey.com/Publication/vwLUAssets/EY-global-becoming-an-analytics-driven-organization/%24FILE/ey-global-becoming-an-analytics-driven-organization.pdf. [Accessed: 21-Oct-2019]. [ Links ]
[6] Durrant-whyte, H., Geraghty, R., Pujol, F. and Sellschop, R. 2015. Mining's next performance horizon: Capturing productivity gains from innovation. Metals and Mining, McKinsey & Company report. [Online]. Available: https://www.mckinsey.com/~/media/mckinsey/dotcom/client_service/metals%20and%20mining/pdfs/minings_next_performance_horizon.ashx. [Accessed: 21 -Oct-2019]. [ Links ]
[7] Lee, J., Kao, H. and Yang, S. 2014. Service innovation and smart analytics for Industry 4.0 and big data environment. Procedia CIRP, 163-8. [ Links ]
[8] Sackey, S. and Bester, A. 2016. Industrial engineering curriculum in Industry 4.0 in a South African context. South African Journal of Industrial Engineering, 27(4), 101-114. [ Links ]
[9] Burstein, F. and Holsapple, C. 2008. International Handbook on Decision Support Systems 2. [Berlin, Germany]: [Springer Science & Business Media]. [ Links ]
[10] Larose, D.T. 2006. Data Mining Methods and Models. [Hoboken, New Jersey]: [John Wiley & Sons]. [ Links ]
[11] Kritzinger, J.A. 2009. Determining the effectiveness of key performance indicators in a steel manufacturing company. North-West University, Masters dissertation. [ Links ]
[12] Sondalini, M. 2014. Useful Key Performance Indicators for Maintenance. Asset Management & Maintenance Journal, 27(4), 25-30. [ Links ]
[13] Furnham, A. 2004. Performance management systems. European Business Journal, 16(2), 83-94. [ Links ]
[14] Stubbs, E. 2011. The Value of Business Analytics: Identifying the path to profitability. [Hoboken, New Jersey]: [John Wiley & Sons]. [ Links ]
[15] Watts, T. and Mcnair-connolly, C.J. 2012. New performance measurement and management control systems. Journal of Applied Accounting Research, 13(3), 226-241. [ Links ]
[16] Stan, L. et al. 2012. KPI performance indicators for evaluating employees on industrial production lines. in 8th internatonal DAAAM Baltic Conference, 1-6. [ Links ]
[17] Saggi, M.K. and Jain, S. 2018. A survey towards an integration of big data analytics to big insights for value-creation. Information Processing and Management, 54758-790. [ Links ]
[18] Zhang, Y., Ma, S., Yang, H., Lv, J. and Liu, Y. 2018. A big data driven analytical framework for energy- intensive manufacturing industries. Journal of Cleaner Production, 197, 57-72. [ Links ]
[19] Liu, H., Huang, H., Li, H., Liu, W. and Wang, T. 2017. A Big Data Framework for Electric Power Data Quality Assessment. in 14th Web Information Systems and Applications Conference, 289-292. [ Links ]
[20] Van Jaarsveld, S. 2018. Developing an integrated information system to assess the operational condition of deep level mine equipment. North-West University, Thesis. [ Links ]
[21] Du Plessis, J.N. 2014. Development of a supervisory system for maintaining the performance of remote energy management systems. North-West University, Thesis. [ Links ]
[22] Motegi, N., Piette, M., Kinney, S. and Dewey, J. 2003. Case Studies of Energy Information Systems and Related Technology: Operational Practices , Costs , and Benefits. in Proceedings of the third international conference for enhanced building operations, 1-10. [ Links ]
[23] Elhussein, M. Gull, H., Alobaid, A., Ajez, A., Aldulaijan, R., Alasfoor, M. and Algaraawi, N. 2018. Big data framework for health informatics. in 21st Saudi Computer Society National Computer Conference (NCC). [ Links ]
[24] Rowley, J. 2007. The wisdom hierarchy: representations of the DIKW hierarchy. Journal of Information Sciences, 33(2), 163-180. [ Links ]
[25] Nagorny, K. Lima-Monteiro, P., Barata, J. and Colombo, A.W. 2017. Big Data Analysis in Smart Manufacturing: A Review. International Journal of Communications, Network and System Sciences, 10, 31 - 58. [ Links ]
[26] ur Rehman, M.H., Chang, V., Batool, A. and Wah, T.Y. 2016. Big data reduction framework for value creation in sustainable enterprises. International Journal of Information Management, 36(6), 917-928. [ Links ]
[27] Kenny, P. 2014. Better Business Decisions from Data. [New York]: [Apress]. [ Links ]
[28] Sivarajah, U., Kamal, M.M., Irani, Z. and Weerakkody, V. 2017. Critical analysis of Big Data challenges and analytical methods. Journal of Business Research, 70, 263-286. [ Links ]
[29] Appelbaum, D., Kogan, A., Vasarhelyi, M. and Yan, Z. 2017. Impact of business analytics and enterprise systems on managerial accounting. International Journal of Accounting Information Systems, 25, 29-44. [ Links ]
[30] Hagerty, J. 2016. 2017 Planning Guide for Data and Analytics. Gartner Inc. report, Technical Professional Advice. Available at: https://www.gartner.com/binaries/content/assets/events/keywords/catalyst/catus8/2017_planning_guide_for_data_analytics.pdf. [ Links ]
[31] Popovic, A., Hackney, R., Tassabehji, R. and Castelli, M. 2018. The impact of big data analytics on firms' high value business performance. Information Systems Frontiers, 20(2), 209-222. [ Links ]
[32] Ertug, G., Gruber, M., Nyberg, A. and Steensma, H.K. 2018. A brief primer on data visualization opportunities. Academy of Management Journal, 61(5), 1613-1625. [ Links ]
[33] van Aarde, C. 2018. A general approach to develop and assess models estimating coal energy content. , North-West University, Masters dissertation. [ Links ]
[34] Spence, R. 2014. Information Visualization: An Introduction, 3rd, illustr ed. [Berlin, Germany]: [Springer]. [ Links ]
[35] Chen, M. and Golan, A. 2016. What May Visualization Processes Optimize? IEEE Transactions on Visualization and Computer Graphics, 22(12), 2619-2632. [ Links ]
[36] Deloitte. 2019. Tracking the trends 2019: The top 10 issues transforming the future of mining. Deloitte mining and metals report. [Online]. Available: https://www2.deloitte.com/content/dam/Deloitte/ru/Documents/energy-resources/ttt-en-2019.pdf. [Accessed: 21-Oct-2019]. [ Links ]
[37] Cilliers, C. 2016. Benchmarking electricity use of deep-level mines. North-West University, Thesis. [ Links ]
[38] Shin, S.J., Woo, J. and Rachuri, S. 2014. Predictive analytics model for power consumption in manufacturing. Procedia CIRP, 15, 153-158. [ Links ]
[39] Bevilacqua, M., Ciarapica, F.E., Diamantini, C. and Potena, D. 2017. Big data analytics methodologies applied at energy management in industrial sector: A case study. International Journal of RF Technologies: Research and Applications, 8(3), 105-122. [ Links ]
[40] Herty, M. and Visconti, G. 2018. A two-dimensional data-driven model for traffic flow on highways. Networks & Heterogeneous Media, 13(2), 217-240. [ Links ]
[41] Mohapatra, R.K. 2015. Application of Artificial Neural Network Modeling for Predicting the Ferro Alloys Furnace Output. in The Fourteenth International Feeroalloys Congress, 609-618. [ Links ]
[42] Elevli, S. and Elevli, B. 2010. Performance Measurement of Mining Equipments by Utilizing OEE. Acta Montanistica Slovaca, 15(2), 95-101. [ Links ]
[43] Fourie, H. 2016. Improvement in the overall efficiency of mining equipment: A case study. Journal of the Southern African Institute of Mining and Metallurgy, 116(3), 275-281. [ Links ]
[44] Booysen, W., van Rensburg, J. and Kleingeld, M. 2012. Simplified methods to evaluate industrial dsm project performance. in Proceedings of the 9th Industrial and Commercial Use of Energy Conference, 5-8. [ Links ]
[45] Jacobs, J.A., Mathews, M.J. and Kleingeld, M. 2018. Failure Prediction of Mine De-watering Pumps. Journal of Failure Analysis and Prevention, 18(4), 927-938. [ Links ]
[46] Debnath, R.M. and Sebastian, V.J. 2014. Efficiency in the Indian iron and steel industry - an application of data envelopment analysis. Journal of Advances in Managemenet Research, 11(1), 4-19. [ Links ]
[47] Suriadi, S. Leemans, S.J.J., Carasco, C., Keeney, L., Walters, P., Burrage, K., ter Hofstede, A.H.M. and Wynn, M.T. 2018. Isolating the impact of rock properties and operational settings on minerals processing performance: A data-driven approach. Minerals Engineering, 122(July 2017), 53-66. [ Links ]
[48] Zanardo, R.P., Siluk, J.C.M., de Souza Savian, F. and Schneider, P.S. 2018. Energy audit model based on a performance evaluation system. Energy, 154, 544-552. [ Links ]
[49] Jradi, M., Arendt, K., Sangogboye, F.C., Mattera, C.G., Markoska, E., Kjaergaard, M.B., Veje, C.T. and Jorgensen, B.N. 2018. ObepME: An online building energy performance monitoring and evaluation tool to reduce energy performance gaps. Energy and Buildings, 166, 196-209. [ Links ]
[50] Agarwal, S.. Pal, J. and Ghosh, D. 2016. Smelting characteristics of fluxed chromite sinter and its performance assessment in electric arc furnace to produce high carbon ferrochrome. Ironmaking & Steelmaking, 43(2), 97-111. [ Links ]
[51] Samet, H.. Ghanbari, T. and Ghaisari, J. 2014. Maximizing the transferred power to electric arc furnace for having maximum production. Energy, 72, 752-759. [ Links ]
[52] Hosseini, S.A. and Abedi, M. 2015. Data Envelopment Analysis: A knowledge-driven method for mineral prospectivity mapping. Computers and Geosciences, 82, 111-119. [ Links ]
[53] Eksteen, J., Frank, S. and Reuter, M. 2004. Towards predictive control of ferroalloy furnaces: Combining thermochemistry, inventory modelling and systems engineering. , in Tenth International Ferroalloys Congress, 648-658. [ Links ]
[54] Nedzingahe, L., Managa, M. and Ncube, O. 2010. Forecasting energy consumption in the ferrochrome sector. Energize, 52-55. [ Links ]
[55] Biermann, W., Cromarty, R.D. and Dawson, N.F. 2012. Economic modelling of a ferrochrome furnace. The Journal of The Southern African Institute of Mining and Metallurgy, 112, 301 -308. [ Links ]
[56] Donovan, P.O., Bruton, K. and Sullivan, D.T.J.O. 2016. Case study: the implementation of a data-driven industrial analytics methodology and platform for smart manufacturing. International Journal of Prognostics and Health Management, 1 -22. [ Links ]
[57] Bai, C. and Sarkis, J. 2010. Green supplier development: analytical evaluation using rough set theory. Journal of Cleaner Production, 18(12), 1200-1210. [ Links ]
[58] Bidar, B., Sadeghi, J., Shahraki, F. and Khalilipour, M.M. 2017. Data-driven soft sensor approach for online quality prediction using state dependent parameter models. Chemometrics and Intelligent Laboratory Systems, 162, 130-141. [ Links ]
[59] Bon, J., Clemente, G., Vaquiro, H. and Mulet, A. 2010. Simulation and optimization of milk pasteurization processes using a general process simulator ( ProSimPlus ). Computers and Chemical Engineering, 34(3), 414-420. [ Links ]
[60] Boukouvala, F., Muzzio, F.J. and Ierapetritou, M.G. 2011. Dynamic Data-Driven Modeling of Pharmaceutical Processes. Industrial & Engineering Chemistry Research, 50, 6743-6754. [ Links ]
[61] Dev, N.K., Shankar, R., Gupta, R. and Dong, J. 2019. Multi-criteria evaluation of real-time key performance indicators of supply chain with consideration of big data architecture. Computers & Industrial Engineering, 128, 1076-1087. [ Links ]
[62] Di, Z., Chang, M. and Guo, P. 2019. Water Quality Evaluation of the Yangtze River in China Using Machine Learning Techniques and Data Monitoring on Different Time Scales. Water, 11(339), 1 -23. [ Links ]
[63] Hao, H., Zhang, K., Ding, S.X., Chen, Z. and Lei, Y. 2014. A data-driven multiplicative fault diagnosis approach for automation processes. ISA Transactions, 53, 1436-1445. [ Links ]
[64] Herman, J., Herman, H., Mathews, M.J. and Vosloo, J.C. 2018. Using big data for insights into sustainable energy consumption in industrial and mining sectors. Journal of Cleaner Production, 197, 1352-1364. [ Links ]
[65] Kablan, M. 2004. Decision support for energy conservation promotion : an analytic hierarchy process approach. Energy Policy, 32, 1151 -1158. [ Links ]
[66] Li, D. and Wang, X. 2017. Dynamic supply chain decisions based on networked sensor data: an application in the chilled food retail chain. International Journal of Production Research, 55(17), 5127-5141. [ Links ]
[67] Moyne, J. and Iskandar, J. 2017. Big Data Analytics for Smart Manufacturing: Case Studies in Semiconductor Manufacturing. Processes, 5(39), 1-20. [ Links ]
[68] van Jaarsveld, S., van Blerk, W., Marais, J.H. and Goosen, P. 2018. Continuous evaluation of operational risks on deep-level mine equipment. in Proceedings of the South African Institute for Industrial Engineers Annual Conference, October 2018. [ Links ]
[69] van Jaarsveld, S., van Heerden, S. and van Rensburg, J. 2017. Development of a condition monitoring information system for deep level mines. in Proceedings of the South African Institute for Industrial Engineers Annual Conference. [ Links ]
[70] Yin, S., Ding, S.X., Sari, A.H.A. and Hao, H. 2013. A data-driven multiplicative fault diagnosis approach for automation processes. International Journal of Systems Science, 44(7), 1366-1376. [ Links ]
[71] Wang, D. 2011. Robust Data-Driven Modeling Approach for Real-Time Final Product Quality Prediction in Batch Process Operation. IEEE Transactions on Industrial Informatics, 7(2), 371-377. [ Links ]
[72] Yu, C. and Matta, A. 2016. A statistical framework of data-driven bottleneck identification in manufacturing systems. International Journal of Production Research, 54(21), 6317-6332. [ Links ]
[73] Tang, J. and Yan, X. 2017. Neural network modeling relationship between inputs and state mapping plane obtained by FDA - t-SNE for visual industrial process monitoring. Applied Soft Computing Journal, 60, 577-590. [ Links ]
[74] Skordilis, E. and Moghaddass, R. , 2017. A condition monitoring approach for real-time monitoring of degrading systems using Kalman filter and logistic regression. International Journal of Production Research, 55(19), 5579-5596. [ Links ]
[75] Niamsuwan, S., Kittisupakorn, P. and Mujtaba, I.M. 2014. Control of milk pasteurization process using model predictive approach. Computers and Chemical Engineering, 66, 2-11. [ Links ]
* Corresponding author: lbotes@researchtoolbox.com
# Author was enrolled for a PhD at North-West University's Centre for Research and Continued Engineering Development (CRCED-Pretoria), Pretoria, South Africa
† Author was a post-doctoral student at North-West University's Centre for Research and Continued Engineering Development (CRCED-Pretoria), Pretoria, South Africa
APPENDIX A: CRITICAL ANALYSIS OF PRACTICAL DATA ANALYTICS APPLICATIONS

