


Services on Demand
Article
 English (pdf)
 Article in xml format
 Article references
Indicators

Related links
-
 Cited by Google
 -
 Similars in Google
Share

 Permalink
South African Journal of Industrial Engineering
On-line version ISSN 2224-7890
Print version ISSN 1012-277X
S. Afr. J. Ind. Eng. vol.30 n.3 Pretoria Nov. 2019
http://dx.doi.org/10.7166/30-3-2236
SPECIAL EDITION
Improving Data Management for Environmental Reporting in the Gold Mining Industry
H.M. Janse van Rensburg*, #; A.G.S. Gous†; J.C. Vosloo; M. van Heerden
North-West University, Centre for Research and Continued Engineering Development (CRCED- Pretoria), Pretoria South Africa, Pretoria, South Africa
ABSTRACT
Environmental reporting is a realistic alternative for mines to prioritise operational changes in crucial environmental areas. Gold mines report to multiple platforms - i.e., integrated reporting. All these platforms have created the need for effective environmental data management. A methodology was developed in which the environmental performance data for numerous operations is centralised. A standardised reporting procedure was developed for each environmental data category that includes the different stakeholders' needs. Focus was also placed on reducing the data transfer errors due to the importance of data accuracy. The methodology is based on the plan-do-check-act (PDCA) cycle and was implemented at a gold mining company. After implementation, the rate of transfer error that would have been recorded in the data was reduced from 20 percent to four percent. This error rate was recorded before an external audit took place.
OPSOMMING
Omgewingsverslagdoening is 'n realistiese alternatief vir myne om operasionele veranderinge in kritiese omgewings te prioritiseer. Goudmyne lewer verslag aan verskeie platforms, dit is dus 'n geval van geïntegreerde verslagdoening. Al hierdie platforms skep die behoefte vir doeltreffende omgewingsdatabestuur. 'n Metodologie is ontwikkel waarbinne die omgewingvertoning data vir verskeie bedrywighede gesentraliseer is. 'n Gestandaardiseerde verslagdoeningsprosedure is ontwikkel vir elke data kategorie. Die vermindering van data oordrag foute het ook spesifieke aandag gekry. Die metodologie is gegrond op die beplan-doen-kontroleer-doen siklus en is by 'n goudmyn geïmplementeer. Na implementering is die oordrag fout koers verlaag van 20 persent na vier persent. Dié syfers is bepaal voor n eksterne oudit plaasgevind het.
1 INTRODUCTION
Corporate environmental reporting evolved from the reporting of a company's financial performance to shareholders[1], [2]. This financial reporting allows shareholders to make an informed decision about where to invest with the lowest possible risk and greatest return on investment. Recently, many entities, including governments and companies, have also been faced with a growing landscape to be transparent about their non-financial risks, which can include socio-economic, climate-change, health-and-safety, and environmental matters [3].
Poor management of these environmental, social, and governance (ESG) risks can have an impact on a company's reputation, and potentially cause significant financial losses through penalties and reduced profitability. ESG risks can therefore result in governments, shareholders, and investment firms suffering heavy losses in dividends and investment returns. Companies that have experienced ESG risk impacts include Uber Technologies Inc., with the 2017 #DeleteUber movement after a sexual harassment scandal; and Volkswagen, which had to recall millions of cars after falsifying emission tests [3].
The Johannesburg Stock Exchange (JSE) requires listed companies to communicate how they have prioritised financial and non-financial matters in their integrated annual report to shareholders [4]. The most widely adopted guideline to align a company's sustainability matters is the global reporting initiative (GRI) standards [5]. Mandatory disclosures must be filed for a company to claim that their report is GRI compliant [6]. These disclosures focus on reporting the performance of key performance indicators (KPIs). KPIs simplify a company's vast quantity of available environmental data into comprehensive information. These KPIs can be compared with other variables to understand the environmental performance of a facility [7].
As environmental KPIs are mostly data-driven, shareholders are concerned about the data accuracy and quality of the information presented [8]. To mitigate these concerns, the data used for reporting is externally assured by an independent audit firm [8]. However, large corporate firms can have multiple operations in multiple countries. Corporate-level reporting is required for a company's annual filings, which means that thousands of lines of data and source documents need to be collected, captured, summarised, and converted to be able to report on the required KPIs. The summarised dataset is then submitted to the auditors. They, however, only take samples of the entire dataset for review. The literature therefore questions the credibility of these assurance audits [9], [10].
Environmental risk management has also become an integrated part of mining companies' decisionmaking processes [11], [12]. The gold mining industry is inherently disruptive to the environment [13]. For example, to manufacture one ounce of gold, about 30 tons of toxic waste is produced [14], even though the mining industry has made strides towards improving their sustainability framework [15]. Lack of data centralisation techniques for environmental data management is still present [12]. This is evident from the fact that data processing still mostly occurs through the use of MS Excel spreadsheets [12]. In addition, gold mining companies can have more than 10 operations, all in need of effective data management.
There is therefore a need to develop an integrated framework that standardises, centralises, and verifies all the data required for environmental sustainability reporting. This paper will focus on improving the environmental data management for the gold mining industry.
2 ENVIRONMENTAL REPORTING
To develop an integrated data management framework, three key aspects need to be understood. First, the environmental KPIs that are mainly reported in the company's integrated annual report, and that affect the company's decision-making, will be identified. Thereafter, the continued improvement method, plan-do-check-act (PDCA), will be reviewed to ensure that the framework can be successfully incorporated into present management processes. Finally, data management techniques will be reviewed to identify the concepts that need to be incorporated into the standardised framework for automation.
2.1 The GRI standards and the gold mining industry
Any ESG risk can be viewed as either material to a company's suitability, or irrelevant to that fact. The United States Financial Accounting Standards Board defines materiality in legal and financial filings as [16] :
The magnitude of an omission or misstatement of accounting information that, in the light of surrounding circumstances, makes it probable that the judgment of a reasonable person relying on the information would have been changed or influenced by the omission or misstatement.
The GRI standards define materiality as [6]:
The report shall cover topics that reflect the reporting organization's significant economic, environmental, and social impacts; or substantively influence the assessments and decisions of stakeholders.
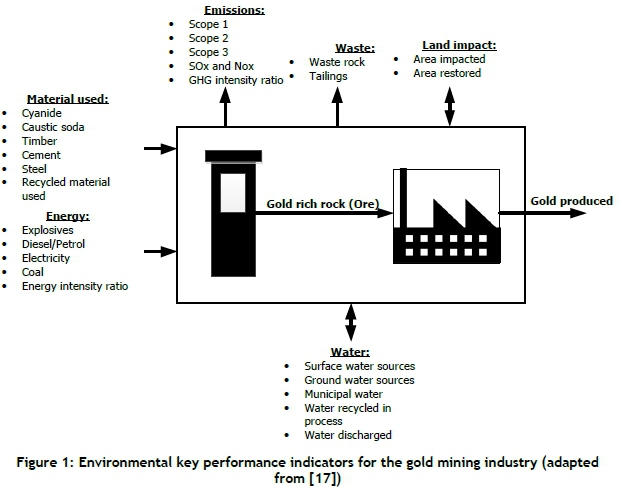
The 300 range of GRI standards states the required disclosures for environmental material topics for a company's sustainability [6]. Vosloo [17] focused on the comparability of quantified GRI environmental information in the mining industry. The study's empirical data was based on a review of JSE-listed mining companies integrated annual reports. A sample was only taken from facilities that use deep-level mining techniques, which limited the study to the gold and platinum mining industries. The gold mining companies reviewed include AngloGold Ashanti, Sibanye Stillwater, Goldfields, Harmony Gold, Pan African Resources, and DRDGOLD. The universal environmental KPIs identified by this study as material to gold mining companies can be viewed in Figure 1 [17].
Figure 1 shows that environmental KPIs are reported in six main categories: materials used, energy, emissions, waste, water, and land impacted. The standardised environmental data framework therefore needs to focus on improving the data management of these six categories of environmental KPIs.
2.2 Plan-do-check-act cycle
The standardised framework needs to be adaptable to the current processes in an organisation. This means that the system needs to be based on integrated management procedures. Large firms have based most of their environmental management approaches on the International Standards Organization (ISO) 14001 standards [18]. This ISO system uses the principles of the PDCA cycle of continuous improvement [19]. The key concept of the PDCA cycle is to implement change in a system which, if continuously iterated, should provide a better understanding of the dynamics of that system. Consequently, this understanding should lead to continuous improvement [19], [20]. The basic principles of the PDCA will be incorporated into the standardised framework procedures.
2.3 Data management processes
The management of data in the gold mining industry is complex. This complexity is because some systems for data collection are automated, while others are completely manual [12]. Mining techniques also differ between operations. Data management is a wide-ranging subject that consists of multiple subject areas. The focus point of the integrated framework is standardisation, centralisation, and verification. Therefore, data integration into a database and the quality of the data integrated will be reviewed. Existing environmental data management software will also be reviewed for shortcomings.
2.3.1 Existing environmental data management software
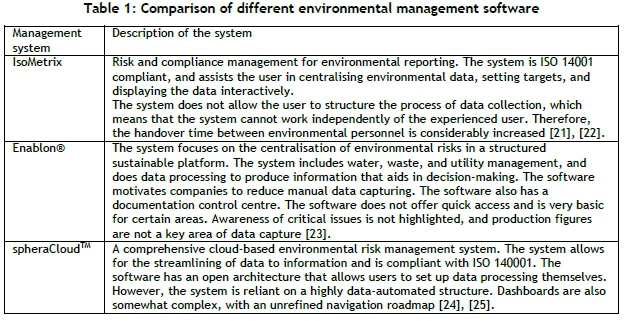
A variety of environmental systems are available for managing the environmental risks of an organisation. The three systems that this paper will discuss are IsoMetrix, Enablon®, and spheraCloudTM. Table 1 summarises the scope and the shortcomings of each system.
From Table 1 there are three main shortcomings that need to be addressed in the integrated framework. First, the standardisation of data input to ensure that the system is independent of one user. Second, the system should make the production figure easily available for environmental performance review. Finally, the system should be web/cloud-based for easy access and should accommodate both automated and manual data.
2.3.2 Data integration and quality
Generating business intelligence from poor data will affect the bottom line of a business. This inaccuracy can lead to 12 percent of revenue being wasted [26]. There are a variety of methods to integrate data into a database. A relational SQL database is one of the most widely used database management systems; it will be used for this system's centralisation [27]. The data structure defines the methodology in which the data is linked and summarised in the database [28], [29]. Figure 2 illustrates the basic principle of the data tree structure.

The 'leaf' is the basis of the data, which will sum back to the root. A data tree structure's integrity can be compromised if incorrect data is entered as input on the leaf nodes. Error identification is therefore necessary to ensure that data is of an acceptable quality. There are two methods of verification: proofreading and double entry. The comparison of input data with the source of that data is called proofreading. Double entry involves two users independently consolidating data from sources. The output of each user is then compared for discrepancies. The comparison conducted in both methods identifies potential errors [30].
The integrated data management framework, via data automation, will be based on the principle of a data tree structure, and a combination of the double entry and proofreading verification techniques will be used.
3 INTEGRATED DATA MANAGEMENT FRAMEWORK
The integrated framework is based on the PDCA cycle, and has four key steps:
1. Understand: Obtain a basic understanding of the system and the environmental KPI boundaries.
2. Simplify: Document irregularities and develop a standardised data flow from all the data categories for each operation.
3. Review: Automate the data management system with improved data capturing techniques.
4. Improve: Conduct an external assurance audit and ensure that the system is still relevant to the GRI standards and international best practices.
The integrated framework also has three horizontal steps over the primary PDCA processes:
1. Data analysis: To ensure that accurate data is obtained, an investigation of and comparison between current data and the optimal process is required.
2. Reporting: Environmental inefficiencies are identified by converting the data to information, and displaying it in relevant reports.
3. Audit: Quarterly internal audits are required to identify any potential problems and correct these issues before the external audit.
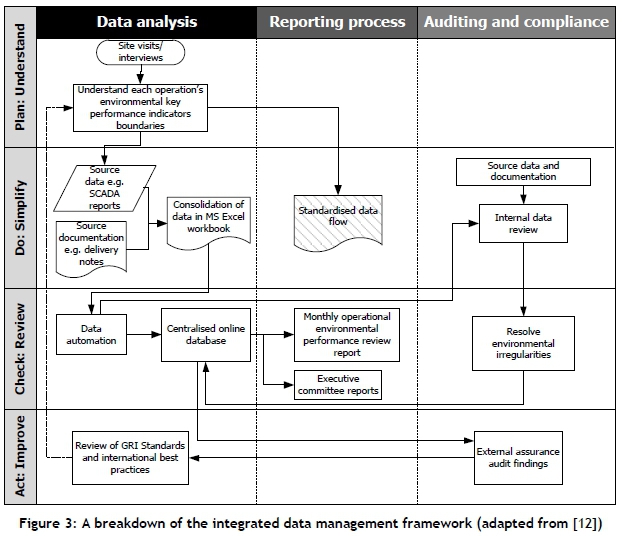
Figure 3 illustrates the integrated framework process layout.
The first step in the system is to understand the operational boundaries and data collection methodologies of each operation. Hidden issues or incomplete data collection can only be identified with this in-depth investigation into the systems relevant to each environmental KPI, as outlined in Figure 1.
The most important outcome of the 'plan' step is to understand how the operations consolidate the data, and that no data stream for the relevant KPI is overlooked. The data collection must also adhere to the definitions of the GRI 300 range of standards. Site visits, interviews, operational walkthroughs, and process and instrumentation diagrams (P&IDs) can be used to obtain this understanding. Previous years' assurance audits can also be reviewed to identify the underlying issues at facilities.
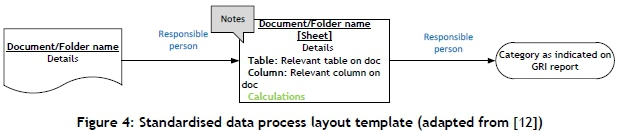
After a complete understanding of the system has been obtained, the data collection and centralisation of the processes can be simplified. The data sources and consolidated MS Excel workbooks generated by each operation can be standardised and documented. Van Heerden [12] developed a standardisation methodology to track how data is collected for each KPI. Figure 4 illustrates this process.
Calculation sheets are required between the value reported and the data origin, as shown in Figure 4 . These calculation sheets allow for both automated systems data and manually entered data processes to be captured. These sheets are generally in the form of an MS Excel workbook. From the left to right, any user can track how the final reported figure was calculated. This standardisation significantly improves the traceability of any data reported.
After improving the data collection methods through standardisation, data automation is possible, as shown in the 'review' step of Figure 3. To reduce human error and allow for the creation of environmental performance reports, data centralisation is required. This is achieved by streamlining the data collection methods, initially by centralising all the calculation MS Excel workbooks. To ensure that the consolidated data is accurate, the source documentation for those summaries is also obtained.
A double entry verification technique is applied during the 'improve' step, which will independently compile the data from the source documentation. The two values will be compared, and the final value will be entered into an online visual database. The source documentation is then also uploaded to the database, to be accessible for higher management to review anomalies in performance in the environmental KPIs. Finally, the online database is reviewed and audited by external auditors. Any findings are reviewed, and the process restarts at the operations to improve the database.
4 IMPLEMENTATION AND RESULTS
The integrated framework was implemented in a mining company to improve the data quality of the reported values. The company has various mining operations consisting of either deep-level or open-pit mining techniques.
The first step was to standardise the reporting process. As stated, this needed to include the source documentation, the calculations, and the reported values. Site visits, operational walkthroughs, and interviews were done at each site. The main issues noted were the incompleteness of data streams, human error in data processing, and the incorrect application of the GRI standards definitions.
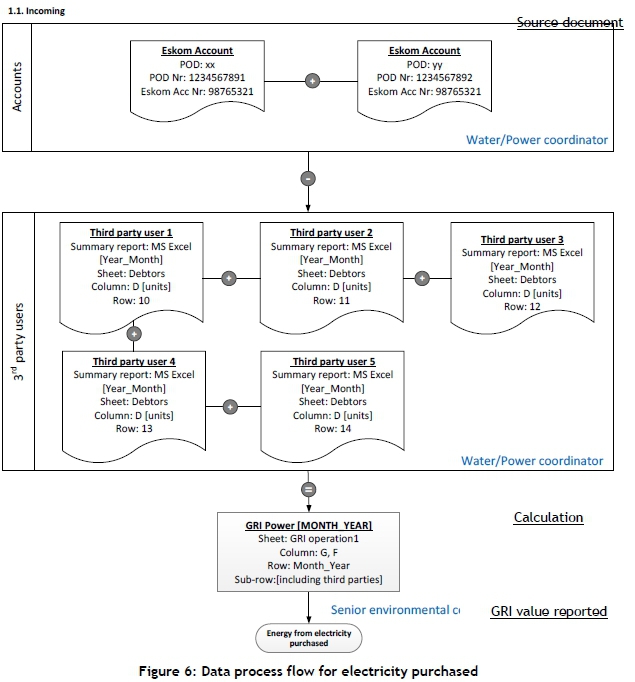
An example of this incorrect application was at one particular operation that had excluded the hostels' municipal water use. Due to this exclusion, significant municipal water wastage was going unnoticed by higher management. After the investigation, a water project with an annual savings of R10 million was identified. Examples of the final standardised layouts can be viewed in Figure 5 and Figure 6.
Figure 5 shows how the data is consolidated for the material used by the KPIs. The source data is from the operations store warehouse database that monitors the amount of material issued to the different users. This database is summarised monthly for each KPI, and the final figure is reported under GRI.
Figure 6 illustrates how the GRI value is reported for the electricity purchased. The main source documentation is Eskom invoices. The mining operation's distribution network accommodates external third-party users, which can be shops, clinics, fuel garages, etc. The usage of these third-party users must be subtracted from the total value reported. The subtraction is summarised in an MS Excel summary, and the final figure reported.
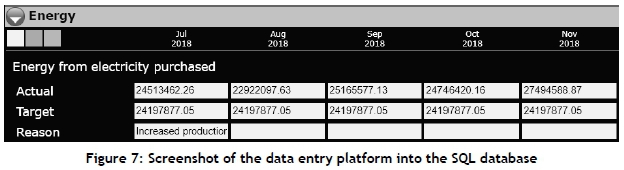
This standardised process allows for a seamless transfer between environmental personnel. The process was repeated for each resource, although it is not shown here. After all the documentation and MS Excel summary spreadsheets had been identified, data automation was implemented. The 'leaf' node data can be entered into the database manually, or by CSV spreadsheet mass database upload, in a standard format. Figure 7 illustrates the online data upload screen.
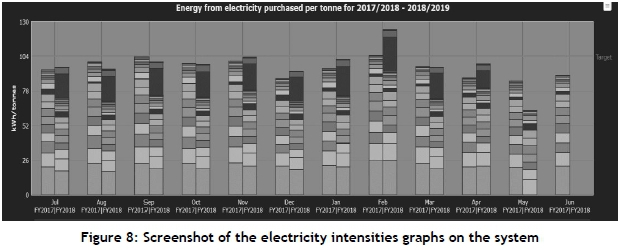
One of the shortcomings identified while investigating existing environmental management software was login security and editing rights. This was addressed by ensuring that environmental managers only have privileges to edit sites where they are the representatives, whereas other personnel that use the management software only have rights to view the data, not to edit it. After the data has been entered into the system, it is consolidated into the root node from each operation. To simplify and identify operations that are underperforming, stacked bar graphs are used to display data - such as electricity intensities - as shown in Figure 8.
If all the data is centralised, the figures can be compared with the previous year's data. This allows for the monitoring of year-on-year performance, by site. All the data has been centralised by the newly developed environmental management system. The materials used, energy, land management, water performance, emissions, and waste management KPIs are centralised in the same way. Different environmental performance graphs can be developed, depending on the operation's needs.
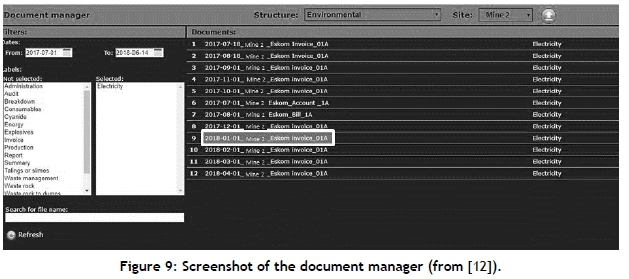
The system must also store the source documentation. To find specific source documents, a search function was built into the system that allows one to filter the data based on year and/or resource. The source documents can then be viewed and downloaded, as seen in Figure 9.
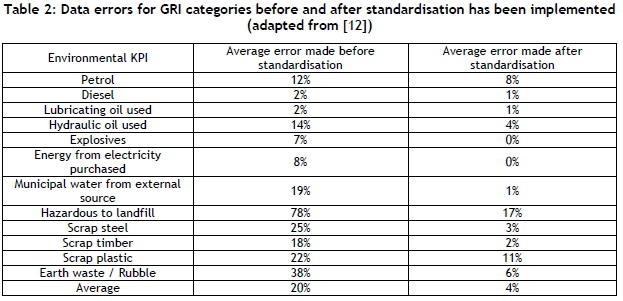
An internal audit was conducted on the 'leaf' data using the double entry verification technique. Table 2 shows what standard percentage error was made by the user before the standardisation documentation, and the average error made after the documentation was made available.
It can be seen from Table 2 that the errors were reduced, on average, from 20 percent to four percent. This shows just how effective the newly developed environmental framework is.
Finally, the external audit was conducted, and recommendations were made. These recommendations were reviewed, and changes were made to the standardised data flow where necessary. However, no material data transfer errors were noted by the external auditors, further validating the effectiveness of the framework. From the results shown in Table 2, it can be deduced that the framework improves data accuracy. Board-level decision-making is improved due to the availability of a standardised reporting process that allows for the reporting of auditable and accurate data. The simplified display and document storage system further adds to the improved auditability of the data. Although this reporting framework was implemented on an environmental system, it can also very easily be extended to other reported data-like production figures.
5 CONCLUSION
The gold mining industry is feeling increased pressure to report their ESG risks accurately to shareholders. Three available environmental management software systems were thus analysed, and it was found that these systems fell short of the basic needs of the gold mining industry. To address these shortcomings, a new integrated data management framework was developed.
This new framework is based on the PDCA cycle, and has three horizontal steps: data analysis, reporting, and audit. The framework generates a standardised data flow layout that ensures that the system is not reliant on an experienced user. After the data flow has been formalised, the data is centralised in a web-based SQL relational database. To verify that the data is correctly entered, a double entry verification technique is used. The data is also displayed in a simplified manner for generating environmental reports and year-on-year comparisons, while a document manager for the source documents has been developed.
This framework therefore addresses the shortcomings of other environmental management systems, and offers a simplified solution to reducing the risk involved in reporting inaccurate data. Implementing this framework on a case study ultimately improved the user data capturing accuracy from a 20 percent error rate to a four percent error rate.
REFERENCES
[1] De Villiers, C. and Van Staden, C. 2011. Shareholder requirements for compulsory environmental information in annual reports and on websites. Australian Accounting Review, 21(4), pp 317-326. [ Links ]
[2] De Villiers, C. and Van Staden, C. 2011. Where firms choose to disclose voluntary environmental information. Journal of Accounting and Public Policy, 30(6), pp 504-525. [ Links ]
[3] World Business Council for Sustainable Development and Committee of Sponsoring Organizations of the Treadway Commission. 2018. Enterprise risk management. The Gordon and Betty Moore Foundation in Palo Alto, available online: https://www.coso.org/Documents/COSO-WBCSD-ESGERM-Executive-Summary.pdf [Accessed 28 October 2019]. [ Links ]
[4] The Institute of Directors in Southern Africa. 2016. King IV Report on Corporate Governance for South Africa 2076,Johannesburg, pp 1-128. [ Links ]
[5] Monte, T. 2009. Application of Global Reporting Initiative (GRI) in the sustainability reporting. Master's dissertation. University of Tampere, Tampere, pp 1-70. [ Links ]
[6] Global Sustainability Standards Board. 2016. GRI 101: Foundation 2016,Global Reporting Initaitive, Amsterdam, pp 1-30. [ Links ]
[7] Jasch, C. 2000. Environmental performance evaluation and indicators. Journal of Cleaner Production, 8(1), pp 79-88. [ Links ]
[8] Global Reporting Initiative. 2013. The external assurance of sustainability reporting, Amsterdam, pp 120. [ Links ]
[9] Perego, P. and Kolk, A. 2012. Multinationals' accountability on sustainability: The evolution of third-party assurance of sustainability reports. Journal of Business Ethics, 110(2), pp 173-190. [ Links ]
[10] Gürtürk, A. and Hahn, R. 2016. An empirical assessment of assurance statements in sustainability reports: Smoke screens or enlightening information? Journal of Cleaner Production, vol. 136(A), pp 30-41. [ Links ]
[11] AngloAmerican. 2016. Climate change: Our plans, policies and progress, London, pp 1-15. [ Links ]
[12] Van Heerden, M. 2018. Environmental data management for gold mines. PhD thesis. Potchefstroom: North-West University. [ Links ]
[13] Schoenberger, E. 2016. Environmentally sustainable mining: The case of tailings storage facilities. Resources Policy, 49, pp 119-128. [ Links ]
[14] Howden,D. 2005. The real price of gold | The Independent. [Online]. Available: https://www.independent.co.uk/environment/the-real-price-of-gold-5348614.html. [Accessed: 15-Jun- 2019]. [ Links ]
[15] Tost, M., Hitch, M., Chandurkar, V., Moser, P. and Feiel, S. 2018. The state of environmental sustainability considerations in mining. Journal of Cleaner Production, 182, pp 969-977. [ Links ]
[16] Financial Accounting Standards Board. 1980. Statement of financial accounting concepts No. 2, Norwalk, p 7. [ Links ]
[17] Vosloo, J.C. 2018. Determining the level of comparability of quantified environmental information of mining companies. Master's in Business Administration. Potchefstroom: North-West University, p 41. [ Links ]
[18] Darnall, N. 2006. Why firms mandate ISO 14001 certification. Business and Society, 45(3), pp 354-381. [ Links ]
[19] International Organization for Standardization. 2015. ISO 14001:2015 Environmental management, p vii. [ Links ]
[20] Gupta, P. 2006. Beyond PDCA - A new process. Quality Progress, July, pp 45-52. [ Links ]
[21] Isometrix. Environmental sustainability. [Online]. Available: https://isometrix-cdn.mediaserver.co.za/uploads/files/Environmental-Sustainability-Brochure.pdf. [Accessed: 15 Jun 2019]. [ Links ]
[22] Isometrix. Integrated GRC for Mining GRC. [Online]. Available: https://isometrix-cdn.mediaserver.co.za/uploads/files/GRC-Mining-Brochure.pdf. [Accessed:15 Jun 2019]. [ Links ]
[23] enablon. 2018. Green facilities solutions | Enablon. [Online]. Available: https://enablon.com/solutions/green-facilities. [Accessed: 15-Jun-2019]. [ Links ]
[24] sphera. Sphera's environmental performance solution. [Online]. Available: https://sphera.com/environmental-performance/. [Accessed: 15-Jun-2019]. [ Links ]
[25] Rosen, N. Seamless integration with Sphera's environmental solutions - Sphera. [Online]. Available: https://sphera.com/videos/sphera-tv-seamless-integration-spheras-environmental-soulutions/. [Accessed: 15-Jun-2019]. [ Links ]
[26] Experian Data Quality. 2014. The state of data,White papar, Dublin, p 9. [ Links ]
[27] Lu, H., Chan, H.C. and Wei, K.K. 1993. A survey on usage of SQL. ACM SIGMOD Record, 22(4), pp 60-65. [ Links ]
[28] Patelia, R.M., Vyas, S.D., Vyas, P.S. and Patel, N. 2015. Basic tree terminologies, their representation and applications. International Journal of Computer Science and Information Technologies, 6(1), pp 384387. [ Links ]
[29] Goosen, P., Mathews, M. and Vosloo, J.C. 2017. Automated electricity bill analysis in South Africa. South African Journal of Industrial Engineering, 28(3), pp 66-77. [ Links ]
[30] Doyle, S. 2008. Essential ICT A level: AS student book for AQA, 1st edition. United Kingdom: Buckinghamshire, Folens Publishers. [ Links ]
* Corresponding author: mjvrensburg@rems2.com
# Author was enrolled for a PhD at North-West University's Centre for Research and Continued Engineering Development (CRCED-Pretoria), Pretoria, South Africa, South Africa
† Author was a post-doctoral student at North-West University's Centre for Research and Continued Engineering Development (CRCED-Pretoria), Pretoria, South Africa

