


Services on Demand
Article
 English (pdf)
 Article in xml format
 Article references
Indicators

Related links
-
 Cited by Google
 -
 Similars in Google
Share

 Permalink
South African Journal of Industrial Engineering
On-line version ISSN 2224-7890
Print version ISSN 1012-277X
S. Afr. J. Ind. Eng. vol.30 n.3 Pretoria Nov. 2019
http://dx.doi.org/10.7166/30-3-2234
SPECIAL EDITION
Structuring Uncertainty Management for Energy Savings Calculations
K.A. Johnson*, #; W. Hamer; J.C Vosloo
North-West University, CRCED-Pretoria, Pretoria, South Africa
ABSTRACT
South Africa has committed itself to reducing its greenhouse gas emissions. A key strategy to minimise the greenhouse gas intensity involves using incentivised energy efficiency initiatives. In South Africa, one of these energy efficiency incentives is Section 12L of the Income Tax Act, which rewards claimants with 95c/kWh for verified energy efficiency savings linked to the reduction of greenhouse gas emissions. This verification is done using the SANS 50010 standard, which requires the management and quantification of the uncertainty associated with reported savings. The accurate quantification of energy efficiency savings is therefore critical, and highlights the need for uncertainty management to ensure accurate and fair results. Although uncertainty quantification and management methods are already available, the correct and consistent application of relevant methods for specific uncertainty contributors is important. In this study, a solution in the form of an uncertainty quantification and management flowchart was developed to quantify and manage energy efficiency savings uncertainties. This tool incorporates a five-step approach towards energy efficiency savings quantification, and was applied to three industrial energy efficiency case studies. It was found that uncertainty levels can range between two and 18 per cent, due to varying uncertainty contributors. This highlighted the need for a structured approach pro-actively to identify, quantify, and manage uncertainty contributors.
OPSOMMING
Suid-Afrika is daartoe verbind om kweekhuisgasvrystellings te verminder. Energie effektiwiteit word dus aangemoedig om kweekhuisgasvrystellings te verminder. In Suid-Afrika, is artikel 12L van die inkomstebelastingwet een van hierdie aansporings vir energiedoeltreffendheid. Dit beloon eisers met 95c/kWh vir geverifieerde energiebesparings. Die verifikasie word gedoen aan die hand van die SANS 50010-standaard. Dit vereis die bestuur en kwantifisering van die onsekerheid verbonde aan gerapporteerde besparings. Die akkurate kwantifisering van energiebesparings is dus van kritieke belang en dit beklemtoon die behoefte aan onsekerheidsbestuur om akkurate en billike resultate te verseker. Alhoewel metodes oor onsekerheidskwantifisering en -bestuur reeds beskikbaar is, is die korrekte en konsekwente toepassing van veskillende metodes ook belangrik. In hierdie studie is 'n oplossing in die vorm van 'n vloeidiagram ontwikkel om onsekerhede rakende energiebesparings te kwantifiseer en te bestuur. Dit behels 'n vyf-stap benadering en is toegepas op drie industriële gevallestudies. Daar is gevind dat onsekerheidsvlakke tussen twee en 18 persent kan wissel weens verskillende onsekerhede. Dit het die behoefte aan 'n gestruktureerde benadering beklemtoon om onsekerheids-bydraers te identifiseer, te kwantifiseer en te bestuur.
1 INTRODUCTION
South Africa is considered to be a carbon dioxide (CO2) intensive country and, as part of the global movement towards reduced carbon intensity, has committed to a 32 per cent reduction in greenhouse gas (GHG) emissions by 2020 and 42 per cent by 2025 [1], [2]. A significant part of the strategy implemented to achieve this is the use of incentivised energy efficiency initiatives (EEIs) [3]. On a national scale, the industrial and mining sectors make a large contribution to CO2 emissions, and EEIs can thus be used to reduce these emissions.
The National Treasury and the South African Revenue Services (SARS), in collaboration with the Department of Energy (DoE), offer a tax allowance to businesses that achieve energy efficiency savings [4]. The tax allowance, contained in Section 12L of the Income Tax Act (Act no 58 of 1962) [5], rewards claimants 95c/kWh for verified energy efficiency savings (EES) linked to the reduction of GHG emissions. This incentive was initiated on the 1st of November 2013, and is claimable until the 1st of January 2020 [6]. In the recent national budget speech, this horizon was extended to 2022 to coincide with the implementation timetable for carbon tax [7].
Accurate quantification of the EES is a critical component of the 12L claim, since the savings cannot be measured directly [8]. The reported 12L savings must therefore be quantified in accordance with the SANS 50010 standard - i.e., the South African National Standard (SANS) for Measurement and Verification of Energy Savings. Due to the complexity of the measurement and verification (M&V) process, the reported EES always include a degree of uncertainty [9]-[11 ]. The SANS 50010 standard previously only required the management of uncertainty (SANS50010:2011) [12]; however, it now also requires the quantification of that uncertainty (SANS50010:2018) [13]. This ensures that savings are reported conservatively.
Uncertainty quantification and management can be a broad topic that is applied with different levels of rigour. Reasonable effort should thus be made to identify and attempt to minimise every potential source of uncertainty [14]. The quality and utility of the uncertainty reported for a result depends on the understanding, critical analysis, and integrity of the factors that contributed to the assignment of its value [11], [15]. However, there is some ambivalence about how uncertainty should be approached and reported in practice [16].
Overall, the strict regulatory requirements and technical complexity associated with 12L make it less attractive for industry than desired [5], [6], [11], [13], [17]-[19]. Uncertainty management further adds to this challenge. This paper therefore focuses on reviewing uncertainty quantification and management practices in order to identify challenges and potential solutions.
1.1 Application of SANAS statistical tests
The South African National Accreditation System (SANAS) issued a guideline that could be used by stakeholders for uncertainty management [11]. The methods in the SANAS guideline were applied to existing M&V reports from EEI case studies in a preliminary investigation to ascertain their effectiveness and applicability. Case studies 1 to 3 dealt with EEIs on the following respective operations: furnace operations, an industrial gas engine and boiler system, and a mine compressor network [20]. Savings uncertainty tests using expanded uncertainty, model validation tests (i.e., R2 correlation, P-value regression significance, Durbin-Watson auto-correlation test), and model prediction tests (i.e., F-test, net determination bias (NDB), and coefficient of variation on the root mean square error (CV[RMSE])) were carried out on these case studies. The results can be seen in Table 1 below.
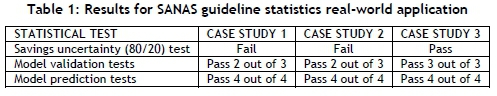
The savings uncertainty was calculated using an 80/20 confidence limit, which is a common heuristic for expanded uncertainty tests [11]. The failure of this test by two of the case studies is critical, as it indicates that the uncertainty level is too high. Depending on the uncertainty level, the reported saving would either need to be adjusted (monetary impact) or, if too high, could even invalidate the claim.
Both case studies 1 and 2 failed one of the three model validation tests. The implications of these failed tests are not apparent on the final reported savings; hence more investigation is needed to establish this. It can be noted, however, that all the models passed the model prediction validation tests. This suggests that all the models are good predictors of the baseline conditions.
Through this preliminary investigation, it can be noted that there are inconsistent results across the case studies, and that the relevance or importance of each of the tests is not apparent. The implications of the failed statistical tests, or the reasons for the failed uncertainty tests, are also not evident. Furthermore, the sources of these uncertainties are not well-established, and statements based on this purely statistical evaluation would be inconclusive. Ultimately, it is difficult to find ways to foresee these failed tests and pro-actively to compensate for the associated uncertainties.
More investigation is therefore necessary into how best to quantify and successfully manage the uncertainties, as well as how to understand and interpret the statistical results of the tests and their implications. This study thus focuses on addressing this need with the following problem statement: A need exists for practical methods to quantify and manage the uncertainties associated with a calculated energy efficiency saving.
1.2 Research objectives and scope
The main objective of this study is to provide a practical and structured strategy to quantify and manage uncertainty effectively for professionals claiming EES. However, additional objectives are needed to assist in the study and to provide a functional solution. The objectives of this study are thus to:
1. Identify the largest contributors to EES uncertainty,
2. Develop a strategy to manage and quantify uncertainty when calculating an EES,
3. Provide a support tool that assists stakeholders with navigating the decisions associated with the calculation of an EES,
4. Report a final EES with an uncertainty value, and
5. Provide a generic solution that can be applied to industrial EES initiatives.
The fields of interest for this study include energy efficiency, statistics, and uncertainty management. The study reviews the energy efficiency of industrial facilities, with specific reference to EEIs carried out to reduce energy intensity and the subsequent calculation of the reported savings. The key focus of this study is the management and quantification of uncertainty - specifically, the uncertainty associated with the EES reported for a 12L tax deduction.
2 REVIEW OF M&V UNCERTAINTY QUANTIFICATION AND MANAGEMENT TECHNIQUES
2.1 Sources of uncertainty
This section describes the four sources of uncertainty that arise in the calculation of EES, as well as uncertainty quantification and management techniques that are available from the literature. The uncertainty sources discussed are: measurement, database, modelling, and assessment decision uncertainty.
2.1.1 Measurement uncertainty
Measurement uncertainty is recognised in the M&V literature; however, strict guidance on how to manage it is seldom provided [21]. Measurement uncertainty is an important consideration for EES quantification, since the accuracy of the measurand influences the reported savings.
'Measurement uncertainty' refers to the range within which the true value of the measurand occurs. The standard allows two main sources of measured data: invoices of measured quantities, and measurement equipment with appropriate calibration records [22]. The use of accredited calibration laboratories provides assurance that certain minimum requirements are met, which minimises measurement uncertainty.
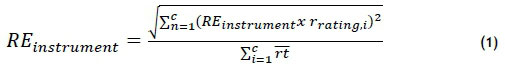
Measurement uncertainty management is often reduced to outlier detection, added to overall uncertainty propagation calculations, or is considered negligible [8], [23]. Measurement uncertainty can only be considered negligible when using high-calibre metering devices. Power meters commonly have measurement errors of less than one per cent [10]. Equation (1) below, found in the ASHRAE guideline [24], represents an equation that can be applied to multiple meters to determine the relative measurement error percentage.
A M&V plan is required to identify which measurements will be used for the characterisation of a specific energy system [25]. Measurement boundaries may include a whole facility or the isolation of a facility. It is therefore necessary to evaluate multiple data sources applicable to the energy system. In the M&V literature, measurement accuracy is emphasised; however, data handling from measurement to point-of-use can also significantly affect overall data uncertainty.
Measurement and database uncertainty can often be linked, since both factors contribute to data quality and the accuracy of the reported savings. Thus the next source of uncertainty that will be discussed is database uncertainty.
2.1.2 Database uncertainty
Data quality is a noteworthy contributor to uncertainty, since it can bias the outcome and compromise the accuracy of the reported saving [26]. Energy savings calculations are reliant on data; however, the data collected from measurements are never 100 per cent error-free [26]. Errors arise from the inaccuracy of sensors, imprecise measurements, data integration, sampling rate, sensor drift, data capture and handling errors.
Data are available in different resolutions, compliance rates, and accuracy. Database evaluation is thus important to determine whether the dataset is satisfactory or not by identifying any abnormalities and establishing the dataset quality. There are four parameters within which the datasets can be investigated: accuracy, traceability, relevance, and compliance.
Evaluation techniques such as plotting redundant datasets, using universal dataset checklists, and interrogating the datasets for specific phenomena (spikes, meter malfunction, data loss, and abnormal operation) are reported in the M&V literature as effective methods for managing and quantifying uncertainty [17], [26], [27]. Once full datasets are collected, baseline models can be constructed to represent the energy system under evaluation.
2.1.3 Modelling uncertainty
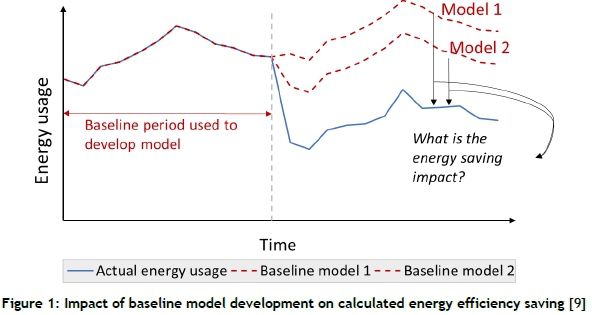
EESs cannot be directly measured, since they represent the absence of energy. Energy-savings models are thus necessary for EES determination [8], [9]. Modelling error is, however, the biggest contributor to EES uncertainty. Developing an accurate and representative baseline model is therefore a critical aspect in determining the quantity of 12L energy savings. A baseline model predicts what the energy use would have been in the absence of energy saving measure (ESM) implementation [6], [26].
The model is developed by forecasting the baseline energy consumption into the performance assessment period - see Figure 1 below. 'Modelling uncertainty' refers to how well the mathematical model represents the variability in the measured data. Modelling error can be due to using the wrong model, assuming inappropriate functional forms, including irrelevant information, or excluding relevant information. In Figure 1, two different baseline models are depicted, each showing a different energy savings impact. The key challenge, therefore, is to determine which baseline provides an appropriate reflection of baseline conditions to determine the achieved energy savings impact.
Uncertainty created by model accuracy can cause doubt about the credibility of the calculated energy savings. Hence it is necessary to stipulate the precision range and confidence level of modelled results. 'Confidence' refers to the probability that the true value will fall within the calculated precision range - e.g., the true value falls within ±20 per cent of the modelled result at 80 per cent confidence.
The uncertainty of a model can be mitigated by including model validation statistics and presenting multiple models as an assurance technique. Various techniques can be employed to manage and quantify measurement, database, and modelling uncertainty. However, no resource is available to help one decide where and when to apply certain techniques. The next section will discuss assessment decision uncertainty.
2.1.4 Assessment decision uncertainty
Multiple decisions need to be made when constructing the baseline model. These decisions can have a significant effect on the reported EES, and when made incorrectly can lead to inaccurate reported savings. The uncertainty associated with the assessment decisions cannot be quantified, but assurance techniques can be used to minimise the uncertainty. Assurance techniques are methods of uncertainty management that provide certainty and creditability to the reported value. Common examples include using supporting documents, or the compilation of multiple models as a supplementary validation technique.
Three common decisions that need to be made when developing a model are: measurement boundary selection, baseline and assessment period selection, and model selection. However, although uncertainty management and quantification techniques are well-established in the literature, no guidance is readily available about which techniques of uncertainty management to use under which circumstances. Decision support tools will therefore be discussed in the section to follow.
2.2 Decision support tools in M&V
There is a need for a method for making consistent, communicable, and reliable decisions while navigating uncertainty. Two support tools found in M&V that can be used to assist in making such decisions include decision flowchart construction and multiple criteria decision-making.
2.2.1 Decision flowchart construction
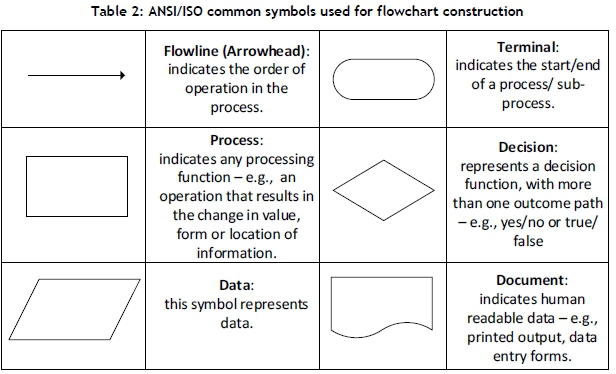
Decision flowcharts can be used to navigate the decision-making process in a simple way by associating a criterion with a decision. A flowchart is a visual representation of information that depicts the steps a process must follow to be completed [29], [30]. Flowcharts are constructed using a combination of arrows and shapes [31], as can be seen in Table 2.
A decision-making flowchart is a simple tool that can be used to make decisions in a uniform way. Decision-making flowcharts are often encountered in the M&V field [24]. However, no flowchart exists for the full EES quantification process that also considers measurement, database, modelling, and assessment decision quantification with the management of uncertainty.
2.2.2 Multiple criteria decision-making
The standard allows for multiple modelling techniques, since different measurement boundaries, data sources, and quantification methods can be employed to calculate the EES. Thus various EES models are constructed, and there is a need for a method to select the most feasible model.
Multiple criteria decision-making (MCDM) provides a tool that can be used to do this in a uniform way. MCDM refers to a choice that must be made while considering numerous objectives. The result is a solution that considers all of the criteria and is acceptable to all stakeholders [32]. Decision-making is a process that involves the trade-off between various intangibles. In order to evaluate these intangibles, they must be measured alongside tangibles whose measurements must also be evaluated for how well they fit the objectives of the decision-maker [33] .
Botes [34] carried out a study that verified the use of a MCDM technique for model selection. The analytic hierarchy process (AHP) is a simple and commonly used MCDM tool [33] that can be used to compare different EES models. EES model comparison is done using the priority scales that represent how much more one element dominates another, relative to a specific attribute. However, AHP is subject to the judgement of the evaluator, and the judgements may be inconsistent - which is of concern when using this tool [33].
Multiple techniques are available to quantify and manage the four identified sources of EES uncertainty. There is thus a need for an easily implemented, understandable, and widely accepted procedure for evaluating and expressing uncertainty when quantifying an EES. The next section will detail the use of the uncertainty Q&M techniques mentioned in Section 2, as well as the decision support tools for the construction of a methodology.
3 A STRUCTURED APPROACH TO QUANTIFY AND MANAGE M&V UNCERTAINTY
At present there is no standardised approach that can be used to navigate EES quantification while considering the identified uncertainty sources. The aim of this section is to use the uncertainty Q&M techniques and decision support tools to construct a solution that is:
1. Generic: The solution is reproducible for multiple industrial EES initiatives.
2. Simple: The techniques are non-complex and easy to interpret, so that they can be used and interpreted by end users and various stakeholders.
3. Useable: The solution should aid an end user to navigate the EES quantification process while considering uncertainty.
4. Outcome-based: The uncertainties associated with the calculation of the EES should be clearly identified, managed, and quantified.
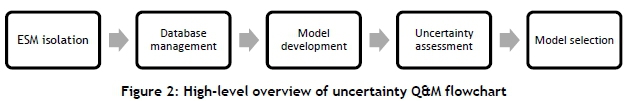
The main tool used in the development of the solution is a decision flowchart. The decision flowchart provides a Q&M framework to assist the navigation of the EES computation while addressing the various uncertainties encountered in a typical M&V process for 12L applications. The decision flowchart is referred to as the uncertainty Q&M flowchart, and uses a five-step approach to EES quantification, as shown in Figure 2.
Typically a model selection step is not included in a standard M&V approach. However, it has been included as the use of multiple models increases the credibility of the claimed value. Each step includes a high-level conceptual requirement of the standard M&V process, but also includes several outcomes that are required to quantify and manage uncertainty. This paper provides only an overview of the basic requirements of each of the five key steps (Section 3.1 to Section 3.5). The uncertainty Q&M flowchart is then consolidated and reviewed in Section 3.6.
3.1 Step 1: Energy saving measure (ESM) isolation
'ESM' refers to the specific activities or efforts that were implemented to improve energy efficiency. The details of the ESM provide the basis for several decisions that will affect the M&V process. It is therefore important to isolate the ESM in a structured way. This step involves the isolation of the ESM by investigating two parameters: the baseline and performance assessment period selection, and the measurement boundary selection. Once these two parameters are determined, the ESM should be isolated to the extent that the required information for uncertainty quantification and management will be made available. This step is used to identify the data sources and measurements available for the selected baseline (BL) and performance assessment (PA) periods. This step thus incorporates uncertainty management techniques for measurement and assessment decision uncertainty.
3.2 Step 2: Database management
'Database management' refers to the evaluation of the available data sources. This step incorporates three key evaluation analyses: redundant data analysis, dataset interrogation, and the construction of universal dataset checklists. The focus of the redundant dataset analysis is to verify the data, and as a means of considering any interactive effects. The dataset interrogation is used to identify and manage any abnormalities in the data. Lastly, the universal checklist is used to summarise the key information of the datasets evaluated. This step thus incorporates uncertainty management techniques for database uncertainty.
3.3 Step 3: Model development
'Model development' refers to the generation of a baseline model for calculating the EES. Multiple options are available when generating a baseline model. The flowchart provides guidance about which modelling option should be used in relation to the data availability, data resolution, and independent variables. For the purposes of this study, it helps an end user to decide between simple modelling options - i.e., between linear regression, energy intensity, unadjusted energy reduction, sampling, and calibration models. This step thus focuses on providing guidance for modelling and assessment decision uncertainty.
3.4 Step 4: Uncertainty assessment
The uncertainty assessment incorporates the use of statistical techniques for the quantification of the error associated with the reported EES and the validation of the constructed energy model. The aim is to report a final uncertainty value associated with the EES. This is important for proving the credibility of the reported saving and abiding by the current requirements for a 12L application. The uncertainty assessment step incorporates three key analyses: model validation, savings uncertainty level determination, and combined uncertainty calculation.
'Model validation' refers to the verification that the assumptions of the model hold true. The calculation of an uncertainty level associated with the reported EES is included in the assessment. 'Combined uncertainty calculation' refers to a calculation that incorporates more than one uncertainty source to produce a single uncertainty value. This step thus incorporates considerations for modelling uncertainty, and delivers an EES value that has an associated quantified uncertainty value.
3.5 Step 5: Model selection
Multiple modelling options are available. M&V practitioners may thus choose to develop various models to represent an activity's baseline conditions. 'Model selection' refers to the process of picking the model that represents the baseline most accurately. The use of multiple models increases the credibility of the claimed value [35]. The selection process integrates the use of the AHP decision-making tool to rank the models. The model ranked with the highest score is proposed as the feasible claim model, and the next two models with slightly lower scores are suggested as validation models. This step thus incorporates considerations for assessment decision uncertainty.
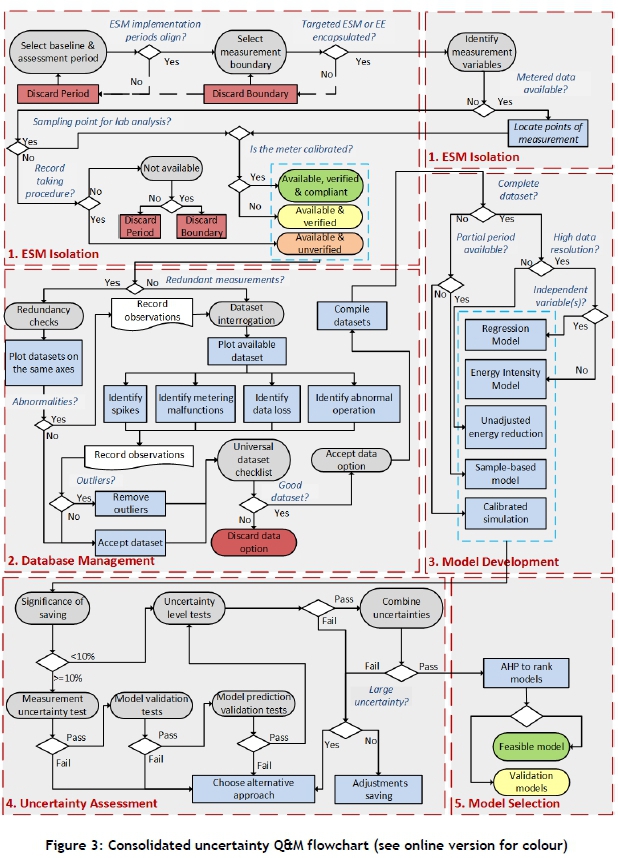
3.6 Consolidation of uncertainty Q&M flowchart development
Figure 3 below indicates the consolidated uncertainty Q&M flowchart. Each of the five steps - ESM isolation, database management, model development, uncertainty assessment, and model selection - is indicated in the figure using red dashed lines. The starting point for the flowchart is a terminal block labelled 'Select baseline and assessment period'. From the starting point, when a question is posed, there is more than one answer to a question. Depending on the answer, an operation can be carried out as indicated by the process block, or the evaluation could end. In the case where the process ends, an observation should be made and, if possible, a re-evaluation should occur.
Specific operations within each step in the flowchart produce deliverables. The deliverables assist both to quantify and to manage the four sources of uncertainty as they progress from step to step. The deliverables are as follows: step 1 - a data availability table, point of measurement diagram, and data points ranked by status. Step 2 - redundancy checks, dataset interrogation, and universal dataset checklist construction. Step 3 - multiple models' development. Step 4 - calculation of the significance of saving, measurement uncertainty, model validation with statistics, uncertainty level value for EES, and combined uncertainty value. Step 5 - ranked models using the analytical hierarchy process. By answering the relevant questions, the user is able to move through the flowchart and find the most feasible model and obtain validation models.
4 RESULTS AND DISCUSSION
The methodology was applied to the same three industrial case studies tested in the preliminary investigation. The case studies represent different South African production industries in which energy saving measures were implemented. The data for these case studies were collected from existing M&V reports, and correspond with the case studies that were originally investigated in Section 1. The result from Case study 1 is presented step-wise in this article in order to illustrate how the methodology was applied. Only the final results of Case studies 2 and 3 are reported here. A validation of the results is also provided.
4.1 Case study 1
This case study represents the 12L tax incentive investigation into the energy intensity reduction of a furnace smelting operation. The investigation was carried out through the implementation of the uncertainty Q&M flowchart.
STEP 1: Energy saving measure (ESM) isolation
The simplified operational layout of the furnace smelting operations is indicated in Figure 4.
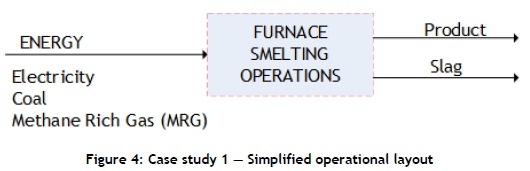
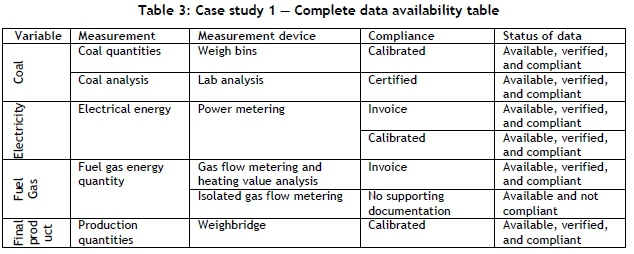
The ESM focused on the improved use of energy carriers to reduce the quantity of energy required to deliver production values. A point of measurement diagram was constructed and the data sources summarised in a data availability table, as shown in Table 3. This information is required in order to isolate the specific ESM that is being evaluated.
STEP 2: Database management
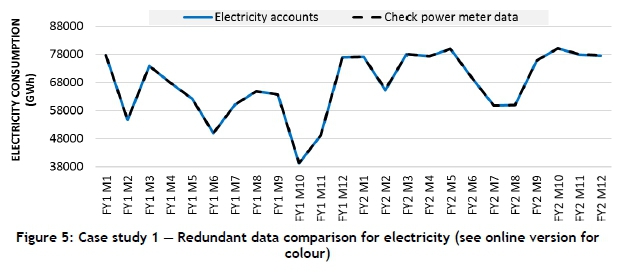
This step includes data redundancy checks, dataset interrogation, and the construction of universal dataset checklists. An example of the application of a redundancy check for electricity measurements is indicated in Figure 5 below, where 'FY' refers to financial year and 'M' refers to month. The electricity supply invoices are compared with the site check metering. Little variance was observed between the two datasets, with the overall difference calculated as 0.057 per cent. This produces confidence in the accuracy of the check metering available on site.
This step is repeated for each dataset in order to ensure that the included datasets are accurate, representative, and error-free.
STEP 3: Model development
All the data sources (electricity, coal, and fuel gas) have at least monthly data available, and linear regression models can therefore be constructed. Since it is useful to incorporate multiple models, three models were developed to quantify the EES achieved on the furnace smelting operation, with the final results shown in Table 4.
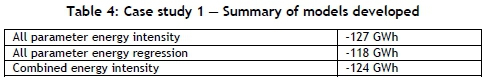
These models were developed using the M&V reports gathered for this case study. An all-parameter energy intensity model, a total energy regression model, and a combined energy intensity model were developed.
It is observed that all the models indicate savings within a similar range (±10 per cent variance) despite the different approaches used for the three models. This indicates that the observed EES is not strongly influenced by the calculation method.
STEP 4: Uncertainty assessment
In the next step of the process, an uncertainty assessment was carried out on each of the three developed models. The specific tools used for model validation and model prediction validation can be found as add-ins in commonly available software (e.g., MS Excel). The savings uncertainty is calculated using the expanded uncertainty technique, and the combined uncertainty is calculated using an equation (both techniques are explained in the SANAS guideline [11]). The results for the uncertainty assessment can be seen in Table 5.
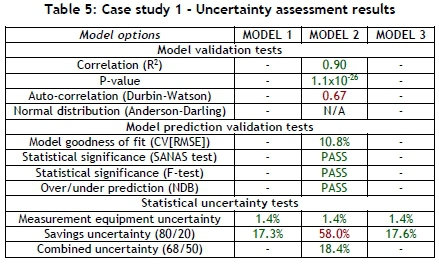
From the table it can be seen that three types of tests were carried out: model validation, model prediction validation, and savings uncertainty tests. The values indicated in green represent the values that passed the test, and those indicated in red represent values where the test was failed. Dashes indicate where the test could not be carried out.
Models 1 and 3 passed all the tests that could be done, whereas model 2 failed two tests. Although model 2 failed the savings uncertainty test at an 80/20 confidence interval, the combined uncertainty value (which includes savings uncertainty and measurement uncertainty) passes the uncertainty test.
The complexity of the model plays an important role in which uncertainty calculations are possible. From Table 5 it is observed that the regression type models can undergo more statistical analysis than energy intensity models. This means that regression models provide additional assurance of the credibility of the saving, since they include these statistical analyses.
STEP 5: Model selection
This step consists of the overall comparison between the models using the AHP. Four criteria were used to evaluate the models against each other. These criteria are: 12L compliance, economic feasibility, model validation, and statistical uncertainty. Model 2 had the highest score, with model 1 and 3 having similar scores. Model 2, the regression model, should therefore be used as the feasible claim model, with models 1 and 3 used as validation models.
4.2 Result summary from additional case studies
The developed flowchart was applied to two additional case studies similar to Case study 1. The additional case studies were for industrial applications: the improved energy efficiency of an industrial engine and boiler system (Case study 2); and a compressor network (Case study 3). Application of the uncertainty Q&M flowchart was applied to all three case studies, and uniform outcomes in terms of 12L deliverables and uncertainty Q&M were achieved.
A two to 18 per cent uncertainty range was observed from the case studies' results for the feasible model's quantified EES. When this uncertainty range is extrapolated country-wide to the R11bn in 12L claims already processed [9], it amounts to a R220m to R1.9bn value. This emphasises the need for reporting the associated uncertainty with the reported EES. It thus reaffirms the need for structured and consistent uncertainty quantification and management.
4.3 Methodology validation
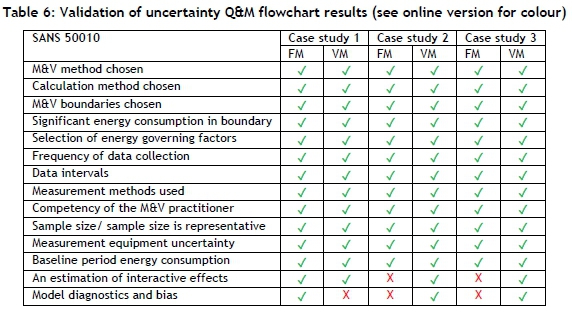
The validation is conducted by comparing the outcomes from the case study applications with the requirements of the SANS 50010 standard. In Table 6, 'FM' refers to the feasible claim model and 'VM' refers to the validation models. The ticks indicate where the case study has included the consideration, and a cross indicates where it has not. It can be noted from Table 6 that, where the feasible claim model did not meet all the requirements of the standard, validation models provided the additional necessary assurance so that all the criteria of the standard were met.
The research objectives were addressed by the study as follows: The largest contributors to EES uncertainty were identified (measurement, database, modelling, and assessment decision uncertainty). The strategy developed was the Uncertainty Q&M flowchart.
The flowchart was applied to three case studies and, hence, was proven to be generic. It is simple in that it makes use of a structured approach that links decisions to criteria, which makes the flowchart easy to navigate. In terms of usability, although time-consuming, it produces uniform results that are easily interpreted. The solution is also outcome-based in that it produces deliverables. The deliverables of the flowchart include information pertinent to a 12L application, and align with the four sources of uncertainty.
The developed methodology was applied to previously completed M&V case studies in order to verify that the approach provides clarity about the pitfalls of studies carried out previously. The implication of this is that errors and pitfalls in the results can only be reported to stakeholders but cannot be managed or corrected in hindsight. It is therefore suggested that the method be applied pro-actively during the implementation of energy efficiency initiatives, because it has been established as a structured methodology.
5 CONCLUSION
Accurate quantification of the EES saving is a critical component of the 12L claims process. However, the reported EESs will always include a degree of uncertainty that must be acknowledged and mitigated. There is, however, some ambivalence about how uncertainty should be approached and reported in practice.
The study therefore introduces a new approach that can be used to quantify and manage the uncertainties associated with a reported EES in a structured manner. This takes the form of an uncertainty Q&M flowchart that assists in the navigation of the EES computation, while also addressing the various uncertainties encountered in a typical M&V process.
The uncertainty Q&M flowchart was applied to three different EE projects in three different industries. The application of the uncertainty Q&M flowchart shows that the solution could be applied to each case study and deliver consistent results. The significance of the study is highlighted by the fact that uncertainty levels can range between two and 18 per cent of the reported results.
REFERENCES
[1] United Nations Framework Convention on Climate Change. 2015. Conference of Parties 21 - Adoption of Paris Agreement, United Nations, Paris, France. [ Links ]
[2] Sustainable Energy Africa. 2015. State of energy in South African cities. Sustainable Energy Africa, Westlake, South Africa. [ Links ]
[3] Department of Environment Affairs. 2011. National Climate Change Response White Paper, no. 34895. Department of Environmental Affairs, South Africa, pp. 3-51. [ Links ]
[4] Department of Energy. 2013. Overview on the National Energy Efficiency Strategy (NEES) - current & post 2015. Department of Energy, South Africa. [ Links ]
[5] National Treasury. 2013. Regulations in terms of Section 12L of the Income Tax Act, 1962, on the allowance for energy efficiency savings. Government Gazette, no. 37136, pp. 3-10. [ Links ]
[6] Campbell, K., Booysen, W. and Vosloo, J.C. 2017. Evaluating the feasibility of the 12L tax incentive for energy intensive industries. 28th South African Institue for Industrial Engineering (SAIIE) Annual Conference, Riverside Sun, Vanderbijlpark. [ Links ]
[7] South African National Energy Development Institute. 2019. Business further incentivised to improve energy efficiency amid constrained capacity. South African National Energy Development Institute: Press release. [ Links ]
[8] Booysen, W., Hamer, W. and Joubert, H. 2016. A simplified methodology for baseline model evaluation and comparison. Industrial & Commercial Use of Energy Cape Town (ICUE) Conference, Cape Town, South Africa. [ Links ]
[9] Hamer, W., Booysen, W. and Mathews, E.H. 2017. A practical approach to manage uncertainty in the measurement and verification of energy efficiency savings. South African Journal of Industrial Engineering (SAJIE), 28(3) Special Edition, pp 128-146. [ Links ]
[10] Olinga, Z., Xia, X. and Ye, X. 2017. A cost-effective approach to handle measurement and verification uncertainties of energy savings. Energy, 141, pp 1600-1609. [ Links ]
[11] SANAS TG 50-02. 2017. Guidelines for reporting uncertainty in measurement and verification. South African National Accreditation System (SANAS), pp. 1-35. [ Links ]
[12] SABS. 2011. SANS 50010: Measurement and verification of energy savings. SABS Standards Division. Pretoria, South Africa. [ Links ]
[13] SABS. 2018. SANS 50010: Measurement and verification of energy savings. SABS Standards Division. Pretoria, South Africa. [ Links ]
[14] Efficiency Valuation Organization. 2018. Uncertainty Assessment for International Performance Measurement and Verification Protocol (IPMVP). Efficiency Valuation Organization, vol. 1. [ Links ]
[15] Citac and Eurachem. 2000. Quantifying Uncertainty in Analytical Measurement. Eurachem, vol. 2, pp 126. [ Links ]
[16] Carstens, H. and Rawlins, M. 2017. A user's guide to the SANAS STC WG guideline for reporting uncertainty in measurement and verification. 12th South African Energy Efficiency Confederation Conference (SAEEC). Johannesburg, South Africa. [ Links ]
[17] Gous, A.G.S. 2018. A practical approach to quantify carbon tax in South Africa. PhD thesis, North-West University, South Africa. [ Links ]
[18] Republic of South Africa. 2015. Republic of South Africa Taxation Laws. National Treasury, South Africa. [ Links ]
[19] Francois, E. and Toit, D.U. 2011. Energy Efficiency Savings Allowance in South Africa : An International Comparison. Masters dissertation, University of Pretoria, South Africa. [ Links ]
[20] Johnson, K.A. 2019. Management of measurement and verification uncertainty for industrial 12L tax incentive applications. Masters disseration, North-West University, South Africa. [ Links ]
[21] Carstens, H., Xia, X. and Yadavalli, S. 2018. Measurement uncertainty in energy monitoring: Present state of the art. Renewable and Sustainable Energy Reviews, 82, pp 2791-2805. [ Links ]
[22] SABS. 2011. SANS 50010: M&V standard for 12-L tax incentives overview of presentation. SABS Standards Division. Pretoria, South Africa. [ Links ]
[23] Efficiency Valuation Organization. 2012. International performance measurement and verification protocol (IPMVP), concepts and options for determining energy and water savings. Efficiency Valuation Organization, vol. 1. [ Links ]
[24] American Society of Heating Refrigeration and Air-conditioning. 2002. ASHRAE guideline: Measurement of energy and demand savings. American Society of Heating Refrigeration and Air-conditioning, Inc., Atlanta, USA. [ Links ]
[25] Den Heijer, W. and Grobler, L.J. 2010. Measurement and verification guideline for energy efficiency and demand-side management (EEDSM) projects and programmes. Corporate Services Division, Assurance and Forensic Department, Eskom Holdings SOC Ltd, South Africa. [ Links ]
[26] Gous, A.G.S., Booysen, W. and Hamer, W. 2016. Data quality evaluation for measurement and verification processes. Industrial & Commercial Use of Energy Cape Town (ICUE) Conference, Cape Town, South Africa. [ Links ]
[27] Hamer, W. 2016. A practical approach to quantify RSA Section 12L EE tax incentives for large industry. PhD thesis, North-West University, South Africa. [ Links ]
[28] SANAS STC. 2017. SANAS STC WG Guideline for Reporting Uncertainty in Measurement and Verification. South African National Accreditation System, pp 1 -37. [ Links ]
[29] IBM. 1970. IBM Data Processing Techniques. International Business Machines (IBM) Corporation Data Processing Division, pp 495-509. [ Links ]
[30] International Standards Organization. 1985. International Standard 5807: Information processing - Documentation symbols and conventions for data, program and system flowsheets, program network charts and system resource charts. International Organization for Standardization, pp 1-25. [ Links ]
[31] ASME. 1947. ASME standard operation and flow process charts. American Society of Mechanical Engineers, New York, New York. [ Links ]
[32] Kolios, A., Mytilinou, V., Lozano-Minguez, E. and Salonitis, K. 2016. A comparative study of multiple-criteria decision-making methods under stochastic inputs. Energies, 9(566), pp 21. [ Links ]
[33] Saaty, T.L. 2018. Decision making with the analytic hierarchy process. International Journal of Services Sciences, 1(1), pp 83. [ Links ]
[34] Botes, L. 2017. Objective evaluation of industrial efficiency models for RSA Section 12L tax incentive. Masters dissertation, North-West University, South Africa. [ Links ]
[35] Mathews, G.E., Hamer, W., Booysen, W., Vosloo, J.C. and Mathews, E.H. 2016. The case for multiple models and methods of verification in the measurement & verification of energy efficiency projects. Industrial & Commercial Use of Energy Cape Town (ICUE) Conference. [ Links ]
* Corresponding author: johnsonkristin304@gmail.com
# Author was a post-graduate student at North-West University's Centre for Research and Continued Engineering Development (CRCED) in Pretoria, South Africa

