


Services on Demand
Article
 English (pdf)
 Article in xml format
 Article references
Indicators

Related links
-
 Cited by Google
 -
 Similars in Google
Share

 Permalink
South African Journal of Industrial Engineering
On-line version ISSN 2224-7890
Print version ISSN 1012-277X
S. Afr. J. Ind. Eng. vol.30 n.2 Pretoria Aug. 2019
http://dx.doi.org/10.7166/30-2-1955
GENERAL ARTICLES
Integrating qualitative and quantitative factors in supplier selection and performance evaluation
P. Kaya SamutI, *; H. ErdoganII
IDepartment of Econometrics, Akdeniz University, Turkey
IIDepartment of Management Information Systems, Akdeniz University, Turkey
ABSTRACT
Companies need to cooperate with reliable and high-performing suppliers of goods and services, and build mutual long-term relationships in order to sustain their existence and increase their market share. An engineering manager can determine the most effective strategy in supplier selection by the proposed model, which allows an integration of objective values and the uncertainty of human judgements. A two-stage integrated fuzzy analytic network process (FANP) and super-efficiency data envelopment analysis (DEA) model is proposed and applied to a wind turbine project of a company operating in the renewable energy sector. At the first stage of the methodology, the weights of the qualitative criteria were determined by using FANP. At the second stage, the qualitative supplier selection criteria that were converted into quantitative criteria with FANP were used as outputs; and cost (which was already a quantitative criterion) was used as an input in the DEA, by way of which the performances of the suppliers were assessed. This study, which includes decision-making, performance management, and supply chain management issues, introduces a new approach, both in terms of the sector referred to and the methodology that enables companies to select the best suppliers by assessing both qualitative and quantitative factors.
OPSOMMING
Maatskappye moet met betroubare en presterende verskaffers van dienste en goedere saamwerk en langtermyn verhoudings bou om hulle voortbestaan volhoubaar te maak en om hulle markaandeel te vergroot. 'n Ingenieursbestuurder kan die mees effektiewe Strategie in verskafferkeuring bepaal met behulp van die voorgestelde model. Dit bied ruimte vir die integrasie van objektiewe waardes en die onsekerheid van menslike beoordeling. 'n Tweeledige geïntegreerde wasige analitiese netwerk proses (FANP) en super-effektiwiteit data omhulsel ontleding (DEA) model is voorgetel en toegepas op 'n windturbine projek van 'n maatskappy in die hernubare energiesektor. Die eerste gedeelte van die metodologie bepaal die gewigte van die kwalitatiewe kriteria met die gebruik van FANP. Die tweede gedeelte gebruik die kwantitatiewe uitsette van die FANP saam met die koste as inset vir die DEA. Sodoende word die verskaffers assesseer. Die studie, wat besluitneming, prestasiebestuur, en voorsieningskettingbestuur insluit, stel 'n nuwe benadering voor, beide in terme van die sektor waarna daar verwys word en die metodologie wat maatskappye in staat stel om die verskaffers te identifiseer (op grond van beide kwalitatiewe en kwantitatiewe faktore).
1 INTRODUCTION
Companies should determine the best and most effective strategy in choosing reliable and high-performing suppliers with whom to establish long-term relations, since this relationship ensures that they have a competitive advantage. An effective supplier selection not only reduces the operational costs of a company, but also improves its operational quality. In addition, product development times and lead times can be decreased, thereby contributing to the competitiveness of the company [1]. Therefore, supplier selection is no longer a matter of making a 'simple' decision based on price alone: it now requires the assessment of several additional and more complicated qualitative and quantitative factors [2]. Companies should have an effective performance evaluation system in order to create efficient supplier networks. While establishing this system, it should be ensured that the performance of existing and potential suppliers is continuously evaluated by combining the human factors and the basic management functions with engineering, and modelling the random and variable structure of the system.
Recent studies confirm that more comprehensive supplier selection multi-criteria decision-making and performance assessment techniques, in which several qualitative and quantitative factors are integrated, are more commonly used. This paper proposes a two-stage integrated method for effective supplier selection, which is a highly complicated process. A fuzzy analytic network process (FANP) was used at the first stage of this method, while a data envelopment analysis (DEA) model was applied at the second stage. The relevant supplier selection criteria were identified initially. With FANP, qualitative supplier selection criteria were converted into quantitative criteria, and these constituted the data used as the outputs of the DEA method. On the other hand, cost, which is an intrinsically quantitative item, constituted the input of the DEA, through which efficient and inefficient suppliers were identified. Finally, super-efficiency scores were calculated and the efficient suppliers were ranked.
FANP was used at the first stage, when the weights of the criteria were determined; thus the network structure that was created could reflect the interaction both between and within the criteria and their feedbacks in the model. In this model, where fuzzy logic was applied, the ambiguous and risky structure of the criteria-setting process relying on human judgement was defined and determined more accurately. At the second stage of the method, the performances of the suppliers were assessed using a super-efficiency DEA model; hence, those criteria with different measurement units could be used in combination. The super-efficiency model also enabled the ranking of suppliers according to efficiency, and the most efficient supplier was presented to the company.
The proposed method was applied to the supplier selection problem for a wind turbine project of a company operating in the renewable energy sector. Studies on supplier selection reveal that the focal point is mainly mass production. Nevertheless, it is equally important for project-oriented companies to identify the most efficient suppliers. This paper not only offers a new approach - in both the model it proposes and the sector to which it is applied - but it also enables project-oriented companies to evaluate qualitative and quantitative factors together. As such, this paper provides valuable insights for engineering managers that would help them to improve their supply chain management performance by evaluating the performance of suppliers.
The rest of the paper is organised as follows. In the second part, a review of the relevant literature is presented. It is followed by the methodology section, in which the procedure of the proposed FANP-DEA model and the steps of the process are described first. Then the FANP and DEA models are introduced. In the fourth section the steps of the proposed model are applied to the energy company. The paper ends with the fifth section, where the conclusions and suggestions for future studies are presented.
2 LITERATURE REVIEW
Supplier selection is a very commonly studied theme in the literature. To solve the supplier selection problem, some studies have preferred a one-stage method, while others have preferred two-stage integrated methods. Some of the studies that employed one-stage methods for supplier selection are as follows: the analytic hierarchy process (AHP) and fuzzy analytic hierarchy process (FAHP) [3,4,5,6,7,8,9,10]; the analytic network process (ANP) and FANP [11,12,13,14]; DEA [15,16,17,18]; fuzzy technique for order preference by similarity to ideal solution (FTOPSIS) [19,20,21]; multi-objective 0-1 programming (MOP) [22,23]; linear programming (LP) and goal programming (GP) [24,25,26,27]; genetic algorithm (GA) [24,28]; fuzzy mixed integer goal programming (f-MIGP); and fuzzy mixed integer linear programming (f-MILP) [29,30].
The review of the relevant literature shows that the one-stage methods have gradually been abandoned and that two-stage integrated methods, in which both qualitative and quantitative factors are assessed, have become more common. Authors such as De Boer, Eva and Morlacchi [31], Ho, Xu and Dey [2], Jain, Wadhwa and Deshmukh [32], and Chai, Liu and Ngai [33] conducted detailed studies on supplier selection. Between 2000 and 2008, 17.95 per cent of the papers published were about supplier selection using the integrated model [2], while this rate rose to 39.84 per cent between 2008 and 2012 [33]. In subsequent years there were hardly any studies that used a single decision-making (DM) model.
In this study, the supplier selection was carried out with FANP at the first stage and then DEA methods at the second stage. Ho et al. [2] analysed the papers published between 2000 and 2008 that were conducted on supplier selection, and found that 14 papers out of 78 used DEA, while three papers used ANP. Chai et al. [33] also analysed papers on the application of DM in the selection of suppliers between 2008 and 2012, and found that 15 papers out of 123 used ANP, whereas 13 papers used DEA. Although there are not as many studies in which ANP and DEA are integrated for supplier selection, the number of such studies has increased in recent years. Some of these are as follows: ANP and DEA methods were integrated for the selection of supply chain partners at small and medium-sized companies [34], for supplier selection at a manufacturing firm [35], and for green supplier selection [36]. In Abdollahi, Arvan and Razmi's [37] study, the authors categorised the suppliers as 'lean' and 'agile', and proposed some suggestions for supplier relationship management (SRM). They used the fuzzy decision-making trial and evaluation laboratory (fuzzy DEMATEL) to define the interdependence between the criteria, ANP to find the weights of sub-criteria, and DEA to rank the suppliers. Che and Chang [38] developed a supplier selection method that they named 'hyADMOPSO', in which ANP, DEA, and multiple objective particle swarm optimisation methods were integrated.
This study proposes a model in which FANP and DEA methods were integrated for supplier selection in a wind turbine project. To the best of our knowledge, no other studies have integrated FANP and DEA to model supplier selection; nor are there any studies that have applied supplier selection methods in the renewable energy sector. However, various DM methods have been used for different purposes in the energy sector. For instance, Kaya and Kahraman [39] selected the best renewable energy source for an Istanbul production site by integrating the 'vise kriterijumska optimizacija i kompromisno resenje' (VIKOR) and AHP methods. Cristobal [40] determined the best renewable energy project for Spain through the VIKOR method. Biomass was found to be the best source of energy, which was followed by wind and solar thermo-electric power. Chen, Kang and Lee [41 ] found the best solar-wind power generation project by applying FAHP. Lee, Chen and Kang [42] proposed a novel AHP-based approach to find the optimum wind farm project. Büyüközkan and Güleryüz [43] integrated DEMATEL and ANP models to determine the optimal renewable energy source; while Yazdani-Chamzini, Fouladgar, Zavadskas and Moini [44] found the optimal source of renewable energy through an integrated COPRAS-AHP model. Pan, Zhang and Zhang [45] measured the industrial energy efficiency of China through a two-stage method: they assessed regional energy efficiency by applying DEA at the first stage; while at the second stage they analysed the energy efficiency variables through panel data analysis. Akbari, Irawan, Jones and Menachof [46] integrated AHP and FANP methods and determined the most appropriate location for off-shore wind farms. Ghosh et al., [2016] [47] found the most suitable location to generate energy from ocean waves by integrating AHP and artificial neural networks (ANN) methods.
3 METHODOLOGY
3.1 Proposed procedure for supplier selection and evaluation
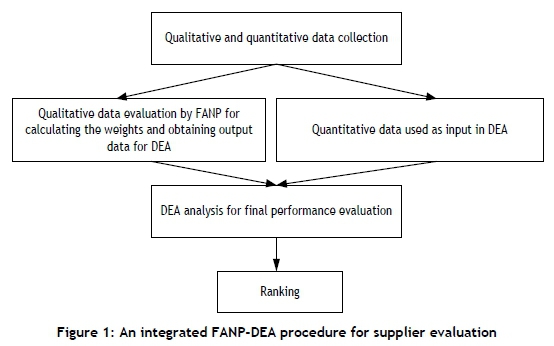
This article suggests a two-stage method using qualitative and quantitative criteria simultaneously in the determination, selection, and evaluation of suppliers. In the first stage of this method, FANP is used to determine the relative weights of qualitative supplier selection criteria. In the second stage, these qualitative factors are converted into quantitative ones, which are then used as the output in the DEA model. By taking these qualitative factors as outputs and a quantitative factor as an input, the super-efficiency scores of suppliers are obtained by DEA, which allows efficient and inefficient suppliers to be ranked. Figure 1 illustrates the proposed method for supplier performance evaluation.
The evaluation process is described as follows:
Step 1: Decision-maker's wind turbine supplier selection criteria are identified. After determining both the quantitative and the qualitative supplier criteria with the help of the decision committee, the process is continued with the steps that follow.
Step 2: The FANP model is structured according to its goal, factors, and sub-factors determined in the previous step.
Step 3: Pair-wise comparison matrices are formed by the decision committee using a linguistic scale for importance (given in Table I, as defined by Kahraman, Ertay and Buyukozkan [48]).
Step 4: The local weights of factors and sub-factors are calculated by Chang's extent analysis method [49,50].
Step 5: The inner dependence matrices and relative importance weights of the criteria are determined. The impact of each criterion on each of the others is assessed with paired comparison matrices, by way of which the interdependence of the criteria is described.
Step 6: The relative importance weights of the criteria derived from the inner-dependency matrices and the local weights are multiplied together, and interdependent weights are obtained.
Step 7: The normalised interdependent weights are multiplied by the local weights of the sub-criteria to calculate their global weights.
Step 8: The criteria weights of the suppliers are determined for the sub-criteria of each criterion by comparing the suppliers. While creating the pair-wise comparison matrices of the suppliers, the linguistic scale given in Table 1 is also used to determine their relative priorities.

The paired comparison values of the suppliers are normalised and their relative weights are calculated [51]. Then a consistency ration (CR) that measures the consistency of the comparisons made by the decision-maker is calculated. If CR is smaller than 0.10, it means that it is an indication of consistency. The consistency index (CI) and consistency ratio (CR) are defined as [52]:
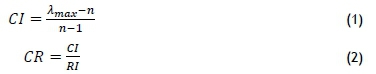
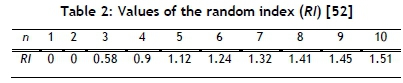
where is the greatest eigenvalue of the matrix, n is the number of items compared in the matrix, and RI is the random index. The values of RI [52] are given in Table 2.
Step 9: The final weights are calculated by multiplying the criterion weights of the suppliers by the global weights of the sub-criteria. The criteria obtained are used as outputs in the DEA analysis.
Step 10: The quality, risk, and service criteria obtained from FANP are used as outputs; and the cost criterion is used as an input for DEA analysis. The performances of the suppliers achieving super-efficiency scores are assessed and ranked.
The next two sub-sections present the FANP method that was used at the first stage of the study, and the DEA method that was applied at the second stage.
3.2 Fuzzy analytic network process (FANP)
The analytic network process (ANP) method that was developed by Saaty [53] is the generalised version of the analytic hierarchy process (AHP), which was also developed by Saaty [52]. Both methods are multi-criteria decision-making methods that allow the assessment of several alternatives by taking account of many criteria. However, AHP establishes a one-dimensional hierarchy between the criteria, sub-criteria, and alternatives, whereas ANP describes a multidimensional dynamic relationship. Just like many other decision-making problems, supplier selection also requires a model in which different needs and desires are assessed in an integrated manner and there is a mutual interaction between the criteria. ANP provides the possibility to reflect the outcome of the dependence and feedback within and between clusters of elements.
Since human perception and decisions always contain uncertainty and vagueness, FANP is more appropriate instead of conventional ANP. Fuzzy logic was first used by Zadeh [54] to define and measure uncertainty. Fuzzy set theory is suitable for transforming uncertainty and knowledge-in-pieces that relies on personal judgements obtained from decision-makers to several parameters [55]. In cases where it is difficult to define the perceptions using crisp numbers, as in the case of supplier selection, fuzzy numbers and linguistic variables allow more reliable results to be obtained [56, 57]. In this study, fuzzy pair-wise comparisons are calculated using Chang's extent analysis method [49, 50].
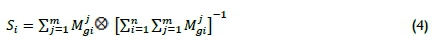
The criteria set is x = {x1(x2, ....,xn} and the goal set is G = {g1,g2,..... gn}. The extent analysis is applied to each criterion for each goal and g;values are created. Thus, m extent analysis values for each object can be obtained with the following symbols:

where all the M1gi(j = 1,2, ...m) are triangular fuzzy numbers (TFNs). The steps of Chang's extent analysis [49,50] can be given as below [12,48,58,59]:
Step 1: The value of fuzzy synthetic extent with respect to the i.th object is defined as:
To obtain Ej=iMgj, perform the fuzzy adition operation of m extent analysis values for a particular matrix, such that:

To obtain [Σ1n=1Σjm=1 Mjgj] , perform the fuzzy additional operation of Mjgi;(j = 1,2,..., m) values, such that:

After that, compute the inverse of the vector in Equation 6 as

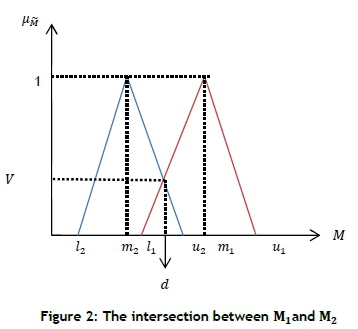
Step 2: The degree of possibility of M2 = (l2, m2, u2) > M1 = m1, u1) is defined as:
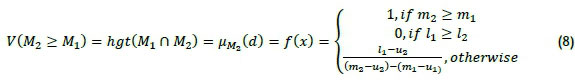
where d is the ordinate of the highest intersection point D between μΜ and μΜ , and hgt(M1 η M2) is a separation index for two fuzzy numbers. To compare M1and M2, both V(M1 > M2) and V(M2 > M1) values are needed. The intersection between M1and M2is seen in Figure 2.
Step 3: The degree of possibility for a convex fuzzy number to be greater than fe convex fuzzy numbers, M; (i = 1,2,.., k) can be defined as

Assume that

for k = 1,2, -, n; k ψ i. Then, the weight vector is given by

where Ai (i = 1,2,..., k) are η elements.
Step 4: Using normalisation, the normalised weight vectors are

where W is a non-fuzzy number.
3.3 Data envelopment analysis (DEA) and super-efficiency model
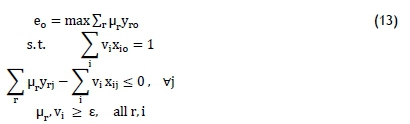
Data envelopment analysis (DEA) is a mathematical programming method that measures the relative efficiency of decision-making units (DMUs) using multiple inputs and outputs that have different measurement units. DEA was first introduced by Farrell [60]. Charnes, Cooper and Rhodes [61] developed the CCR-DEA model based on the constant returns to scale (CRS) assumption, and Banker, Charnes and Cooper [62] developed the BCC-DEA model based on the variable returns to scale (VRS) assumption. In DEA, which is not a parametrical method, those DMUs that are on the efficiency frontier are considered to be relatively efficient, and are assigned a '1'. The CCR-DEA model is based on the CRS assumption, and assumes that all DMUs operate at the optimal scale. The input-oriented CCR-DEA model used in this study is formulated by equation (13).
It is considered that a set of η DMUs, with each DMU j,j = (1,2,...,n) generating s outputs yrj(r = 1,2,..,s) by using m inputs xij (i = 1,2,..,m) [63].
The dual of the linear programming model in the equation (13) is as follows [64]:
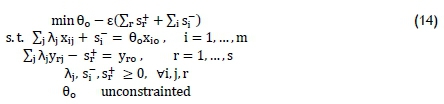
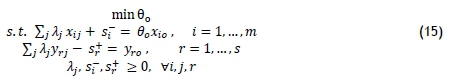
The super-efficiency (SE) DEA model used in this paper was proposed by Andersen and Petersen [65], and aims at ranking the DMUs that are found to be efficient with a value of '1', using the CCR-DEA, BCC-DEA, or other DEA models [66]. In the super-efficiency model, every efficient DMU is removed from the efficient production frontier, and the distance of the removed DMUs to the efficiency frontier that is redetermined is measured.
These scores are the super-efficiency scores of the efficient DMUs, and have a value greater than 100 per cent [67]. This allows the ranking of the efficient DMUs among themselves. The values assigned to the inefficient DMUs in the standard model remain unchanged. The DEA model is equivalent to the dual CCR-DEA model, except for the fact that DMUs are excluded from the reference set. The super-efficiency model is presented below [65]:
4 RESULTS
The case study for the application of this two-stage model was conducted in an engineering company in Ankara, Turkey that specialises in renewable energy projects, such as wind power plants, geothermal energy, and solar power. In this study, supplier selection through the evaluation of their performances was carried out for wind power plant projects. In wind power plant projects, turbine suppliers are liable not only for the procurement of turbines, but also their transportation, installation, and operation. There are nine main firms that supply wind turbines in Turkish market. In the study, these nine suppliers' performances were evaluated by FANP and DEA. All of this process was carried out with the decision committee of the wind power plant department of the company, consisting of three individuals.
Step 1: An extensive list of supplier selection criteria was submitted to the decision-making team in the wind power plant department to determine the criteria for selecting the best suppliers. The team agreed on four main criteria as quantitative and qualitative variables, with their sub-criteria, which can be seen in Table 3.
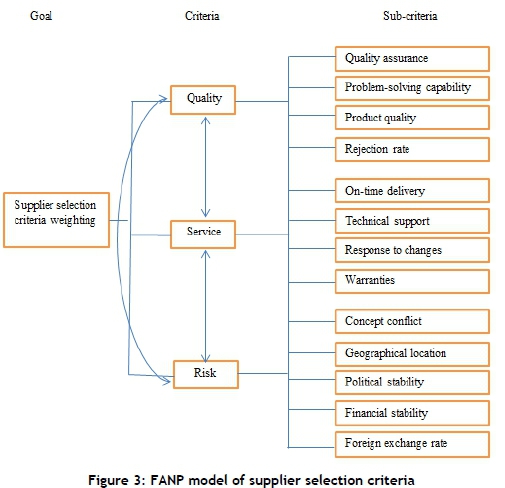
Step 2: At this stage, the FANP model was created by using the factors that were defined in the previous steps. The FANP model that was devised to weight the selection criteria of suppliers is seen in Figure 3. The model comprised three steps. The purpose was described in the first step, while the criteria and sub-criteria were identified in the second and third steps respectively. The curves in the second step show the inner-dependence between quality, service, and risk. In this way, the model allowed for the analysis of the impact of the factors on each another.
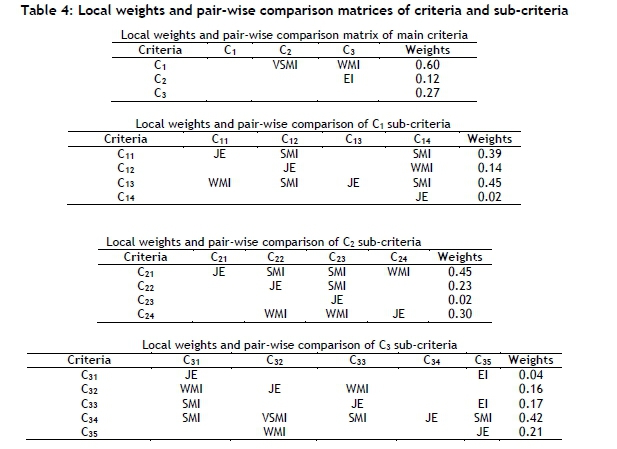
Step 3: The pair-wise comparison matrices (see Table 4) were obtained from the opinion of the decision-making committee. The matrices were obtained by using a linguistic scale for importance (given in Table 1), as defined by Kahraman et al. [48].
Step 4: The local weights of the main criteria and their sub-criteria, which were calculated using Chang's extent analysis method [49,50], are given in Table 4.
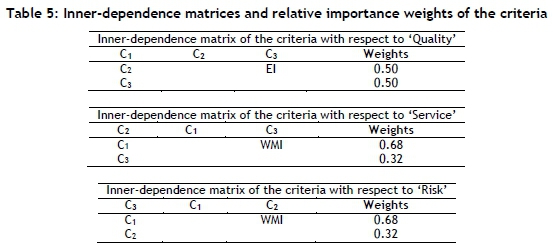
Step 5: In this step, pair-wise comparison matrices were obtained, based on the dependencies represented in the second part of Figure 3. The inner dependence matrices and the computed relative importance weights of the criteria are given in Table 5.
Step 6: The interdependent weights were calculated by multiplying the relative importance weights of the criteria by the local weights, and then interdependent weights were normalised. The values obtained were 0.44 for quality, 0.26 for service, and 0.31 for risk.
Step 7: The global weights of the sub-criteria were obtained by multiplying the weights of the criteria by the local weights of the sub-criteria (Table 6).
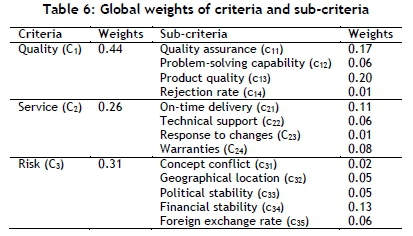
The results revealed that 'quality' was the most important criterion in the selection of wind turbine suppliers, followed by 'risk'. The 'service' criterion, on the other hand, had the lowest weight. The most important sub-criteria of quality were 'product quality' and 'quality assurance'. 'Financial stability' was the sub-criterion of risk with the highest weight, and 'on-time delivery' was the sub-criterion of service with the highest weight.
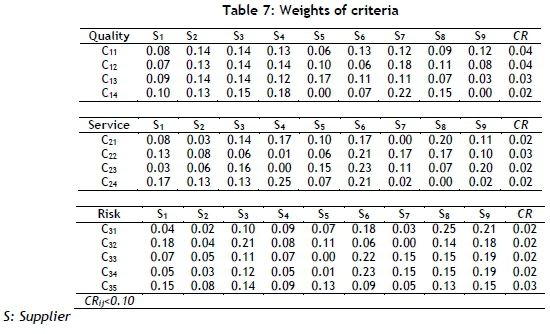
Step 8: Pair-wise comparisons between the suppliers were performed for each sub-criterion, using the linguistic scale (Table 1). The criterion weights and CR are presented in Table 7. The consistency rates were lower than 0.10, and the comparisons made by the decision-maker were consistent.
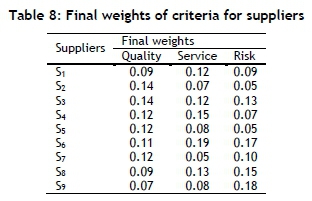
Step 9: The final weights were calculated by multiplying the suppliers' criterion weights by the normalised values of the global weights of the sub-criteria. The final weights are presented in Table 8. In this way, the qualitative data to be used as output in DEA were converted into quantitative data.
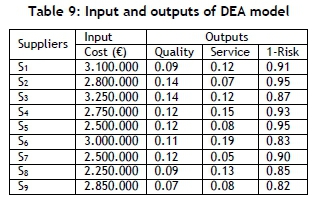
Step 10: The quality, risk, and service factors obtained in FANP were used as outputs, and cost was used as input in dEa analysis. The risk factor was subtracted from "1" and converted into the risklessness variable. The data of the DEA model are presented in Table 9.
In the study, the performances of the suppliers were assessed with the input-oriented CCR-DEA analysis. The EMS Version 1.3 computer program developed by Holger Scheel was used to solve the model and calculate the super-efficiency scores.
Table 10 shows the super-efficiency scores obtained from DEA. In this study nine suppliers were assessed; S2, S4, S5, S6, and S8 were the efficient suppliers. These suppliers were chosen by the company because they produced the maximum amount of output at the lowest cost. It was possible to rank the efficient suppliers using the super-efficiency scores. S8 had the highest performance with 110.38 per cent, followed by S6 with 109.62 per cent and S4 with 104.55 per cent. Suppliers that had an efficiency score greater than '1' could continue to be efficient if they increased their inputs. Therefore, even if S8 increased the cost by 10.385 per cent, it would still be an efficient supplier.
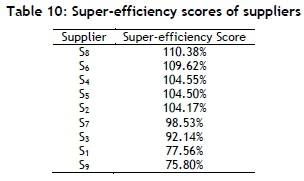
The other suppliers did not operate efficiently. The least-efficient supplier, S9, had an efficiency score of 75.80 per cent. This meant that this supplier could obtain the same output even if its cost were reduced by 24.2 per cent.
5 CONCLUSION
In today's fiercely competitive markets, companies can achieve a substantial competitive advantage if they work with reliable and high-performing suppliers that offer high-quality products and services. A decision-maker should establish a performance evaluation system for the selection of efficient suppliers, and should determine the most effective strategy in choosing suppliers through the proposed model, which allows for the integration of objective values and the uncertainty of human judgements. This study has proposed a model that engineering managers can use to select suppliers efficiently using qualitative and quantitative criteria simultaneously. Additionally, the study offers engineering managers an opportunity to improve the performance of supply chain in respect of supplier selection by interpreting the results of the model.
In this study, a two-stage integrated FANP-super-efficiency DEA was proposed for the effective selection of suppliers. Qualitative and quantitative factors were assessed in an integrated way in this method, which was used to select the most appropriate supplier for a wind turbine project of a company that operates in the renewable energy sector. First, the decision-makers of the company identified the main criteria and sub-criteria for the selection of suppliers for its wind turbine project. At the first stage of the model, the non-linear network structure of the qualitative criteria was created in combination with the sub-criteria, and their weights were calculated through FANP. Due to this network structure, the interactions and feedbacks both between and within the criteria were represented to the model. The uncertainties associated with these qualitative factors, which were derived solely from human judgement, were modelled with fuzzy logic; in this way they were weighted more accurately. By modelling the uncertainty, risk, and variability with the help of FANP in the proposed model, it is possible effectively to convert qualitative factors to quantitative factors. A manager can combine these acquired factors by the quantitative values to choose the best supplier. Thus it is possible to establish an efficient performance system that includes a set of variables instead of only the cost factor.
At the second stage of the model, the efficient and inefficient suppliers were identified through DEA analysis. Service, quality, and absence of risk - the qualitative supplier selection criteria that were transformed into quantitative data using FANP - constituted the outputs of DEA. Cost was taken as the input of DEA as a quantitative datum. In this study, in which nine suppliers were assessed, S2, S4, S5, S6, and S8 were found to be efficient. These suppliers were chosen by the company because they produced the maximum amount of output at the lowest cost. The performances of these suppliers were ranked using their super-efficiency scores. S8 had the highest performance with 110.38 per cent, followed by S6 with 109.62 per cent and S4 with 104.55 per cent.
It is thought that decision-makers who implement this two-stage integrated model in the supplier selection process will choose more efficient suppliers, and the model will allow suppliers to enhance their performances. Engineering managers who are aware of the importance of managing the supply chain effectively should evaluate the performance of their current suppliers, and incorporate the most appropriate ones into their processes. Thus this study presents decision-makers with a road map.
The paper provides valuable insights for decision-makers in that the performance of a supply chain depends on the selection of the most appropriate supplier for the company. This study, which includes decision-making, performance management, and supply chain management issues within the scope of engineering management, introduces a new approach both in terms of the sector referred to and the methodology, and enables companies to select the best suppliers by assessing both qualitative and quantitative factors. It presents a significant contribution to the literature for managers to implement the proposed model effectively.
The model is applied to a wind turbine project of a company operating in the renewable energy sector. It would be useful also to examine different companies in order to make a generalisation about the sector. It is suggested that supplier selection efforts should be undertaken at project-oriented companies in future studies. Moreover, new models and practices that integrate qualitative and quantitative data in supplier selection in all sectors will also have great importance. In addition, this study can be extended by including other sectors as well. To the best of our knowledge, this is the first study that applies the integrated FANP-super-efficiency DEA model to the supplier selection problem.
REFERENCES
[1] Zeydan, M., Çolpan, C. & Çobanoglu, C. 2011. A combined methodology for supplier selection and performance evaluation. Expert Systems with Applications, 38(3), pp. 2741-2751. [ Links ]
[2] Ho, W., Xu, X. & Dey, P.K. 2010. Multi-criteria decision making approaches for supplier evaluation and selection: A literature review. European Journal of Operational Research, 202(1), pp. 16-24. [ Links ]
[3] Chan, F.T.S. 2003. Interactive selection model for supplier selection process: An analytical hierarchyprocess approach. International Journal of Production Research, 41(15), pp. 3549-3579. [ Links ]
[4] Liu, F.H.F. & Hai, H.L. 2005. The voting analytic hierarchy process method for selecting supplier. International Journal of Production Economics, 97(3), pp. 308-317. [ Links ]
[5] Amid, A., Ghodsypour, S.H. & O'Brien, C. 2006. Fuzzy multiobjective linear model for supplier selection in a supply chain. International Journal of Production Economics, 104(2), pp. 394-407. [ Links ]
[6] Anilkumar, H.M., Narkhede, B.E., Rakesh, D.R. & Akshay, S.S. 2013. Supplier selection in supply chain using analytical hierarchy process. International Journal of Productivity and Quality Management, 11(3), pp. 357-369. [ Links ]
[7] Kar, A.K. & Pani, A.K. 2014. Exploring the importance of different supplier selection criteria. Management Research Review, 37(1), pp. 89-105. [ Links ]
[8] Ozfirat, P.M., Tasoglu, G.T. & Memis, G.T. 2014. A fuzzy analytic hierarchy process methodology for the supplier selection problem. Journal of Enterprise Information Management, 27(3), pp. 292-301. [ Links ]
[9] Dweiri, F., Kumar, S., Khan, S.A. & Jain, V. 2016. Designing an integrated AHP based decision support system for supplier selection in automotive industry. Expert Systems with Applications, 62, pp. 273-283. [ Links ]
[10] Lo, S.C. & Sudjatmika, F.V. 2016. Solving multi-criteria supplier segmentation based on the modified FAHP for supply chain management: A case study. Soft Computing, 20(12), pp. 4981-4990. [ Links ]
[11] Amin, S.H. & Razmi, J. 2009. An integrated fuzzy model for supplier management: A case study of ISP selection and evaluation. Expert Systems with Applications, 36(4), pp. 8639-8648. [ Links ]
[12] Razmi, J., Rafiei, H. & Hashemi, M. 2009. Designing a decision support system to evaluate and select suppliers using fuzzy analytic network process. Computers & Industrial Engineering, 57(4), pp. 1282-1290. [ Links ]
[13] Tseng, M., Chiang, J.H. & Lan, L.W. 2009. Selection of optimal supplier in supply chain management strategy with analytic network process and choquet integral. Computers and Industrial Engineering, 57(1), pp. 330-340. [ Links ]
[14] Kang, H.Y., Lee, A.H.I. & Yang, C.Y.A. 2012. Fuzzy ANP model for supplier selection as applied to IC packaging. Journal of Intelligent Manufacturing, 23(5), pp. 1477-1488. [ Links ]
[15] Weber, C.A. & Desai, A. 1996. Determination of paths to vendor market efficiency using parallel coordinates representation: A negotiation tool for buyers. European Journal of Operational Research 90(1), pp. 142-155. [ Links ]
[16] Braglia, M. & Petroni, A. 2000. A quality assurance-oriented methodology for handling trade-offs in supplier selection. International Journal of Physical Distribution and Logistics Management, 30(2), pp. 96111. [ Links ]
[17] Khakbaz, M.H., Ghapanchi, A.H. & Tavana, M. 2010. A multicriteria decision model for supplier selection in portfolios with interactions. International Journal of Services and Operations Management 7(3), pp. 351-371. [ Links ]
[18] Mahdiloo, M., Noorizadeh, A. & Saen, R.F. 2013. A new model for suppliers ranking in the presence of both dual-role factors and undesirable outputs. International Journal of Logistics Systems and Management, 15(1), pp. 93-107. [ Links ]
[19] Boran, F.E., Genç, S., Kurt, M. & Akay, D. 2009. A multi-criteria intuitionistic fuzzy group decision making for supplier selection with TOPSIS method. Expert Systems with Applications, 36(8), pp. 11363-11368. [ Links ]
[20] Roshandel, J., Miri-Nargesi, S.S. & Hatami-Shirkouhi, L. 2013. Evaluating and selecting the supplier in detergent production industry using hierarchical fuzzy TOPSIS. Applied Mathematical Modelling, 37(24), pp. 10170-10181. [ Links ]
[21] Dowlatshahi, S., Karimi-Nasab, M. & Bahrololum, H. 2015. A group decision-making approach for supplier selection in configuration design: A case study. The International Journal of Advanced Manufacturing Technology, 81(5), pp. 1139-1154. [ Links ]
[22] Feng, B., Fan, Z. & Li, Y. 2011. A decision method for supplier selection in multiservice outsourcing. International Journal of Production Economics. 132(2), pp. 240-250. [ Links ]
[23] Arikan, F. 2013. A fuzzy solution approach for multi objective supplier selection. Expert Systems with Applications, 40(3), pp. 947-952. [ Links ]
[24] Lin, Y. & Yeh, C. 2010. Optimal carrier selection based on network reliability criterion for stochastic logistics networks. International Journal of Production Economics, 128(2), pp. 510-517. [ Links ]
[25] Ng, W.L. 2008. An efficient and simple model for multiple criteria supplier selection problem. European Journal of Operational Research, 186(3), pp. 1059-1067. [ Links ]
[26] Singh, R.K., Kumar, P. & Gupta, V. 2010. Fuzzy statistical approach for vendor selection in supply chain.International Journal of Logistics Systems and Management, 7(3), pp. 286-301. [ Links ]
[27] Jadidi, O., Cavalieri, S. & Zolfaghari, S. 2015. An improved multi-choice goal programming approach for supplier selection problems. Applied Mathematical Modelling, 39(14), pp. 4213-4222. [ Links ]
[28] Ding, H., Benyoucef, L. & Xie, X. 2005. A simulation optimization methodology for supplier selection problem. International Journal of Computer Integrated Manufacturing, 18(2-3), pp. 210-224. [ Links ]
[29] Kumar, M., Vrat, P. & Shankar, R. 2004. A fuzzy goal programming approach for vendor selection problem in a supply chain. Computers & Industrial Engineering, 46(1), pp. 69-85. [ Links ]
[30] Bohner, C. & Minner, S. 2017. Supplier selection under failure risk, quantity and business volume discounts. Computers & Industrial Engineering, 104, pp. 145-155. [ Links ]
[31] De Boer, L., Eva, L. & Morlacchi, P. 2001. A review of methods supporting supplier selection. European Journal of Purchasing and Supply Management, 7(2), pp. 75-89. [ Links ]
[32] Jain, V., Wadhwa, S. & Deshmukh, S.G. 2009. Select supplier-related issues in modelling a dynamic supply chain: Potential, challenges and direction for future research. International Journal of Production Research, 47(11), pp. 3013-3039. [ Links ]
[33] Chai, J., Liu, J.N.K. & Ngai, E.W.T. 2013. Application of decision-making techniques in supplier selection: A systematic review of literature. Expert Systems with Applications, 40(10), pp. 3872-3885. [ Links ]
[34] Liu, T.J. & Yang, L.Q. 2016. Selection of supply chain partners for small and medium-sized manufacturing enterprises. In Proceedings of the 2016 5th International Conference on Measurement, Instrumentation and Automotion (ICMIA 2016), 138, pp. 435-444. [ Links ]
[35] Hasan, M.A., Shankar, R. & Sarkis, J. 2008. Supplier selection in an agile manufacturing environment using data envelopment analysis and analytical network process. International Journal of Logistics Systems and Management, 4(5), pp. 523-550. [ Links ]
[36] Kuo, R.J. & Lin, Y.J. 2012. Supplier selection using analytic network process and data envelopment analysis. International Journal of Production Research, 50(11), pp. 2852-2863. [ Links ]
[37] Abdollahi, M., Arvan, M. & Razmi, J. 2015. An integrated approach for supplier portfolio selection: Lean or agile? Expert Systems with Applications, 42(1), pp. 679-690. [ Links ]
[38] Che, Z.H. & Chang, Y.F. 2016. Integrated methodology for supplier selection: The case of a sphygmomanometer manufacturer in Taiwan. Journal of Business Economics and Management, 17(1), pp. 17-34. [ Links ]
[39] Kaya, T. & Kahraman, C. 2010. Multicriteria renewable energy planning using an integrated fuzzy VIKOR & AHP methodology: The case of Istanbul. Energy, 35(6), pp. 2517- 2527. [ Links ]
[40] Cristobal, J.R.S. 2011. Multi-criteria decision-making in the selection of a renewable energy project inSpain: The Vikor method, Renewable Energy, 36(2), pp. 498-502. [ Links ]
[41] Chen, H.H., Kang, H.Y. & Lee, A.H.I. 2010. Strategic selection of suitable projects for hybrid solar-wind power generation systems. Renewable and Sustainable Energy Reviews, 14(1), pp. 413-421. [ Links ]
[42] Lee, A.H.I., Chen, H.H. & Kang, H.Y. 2009. Multi-criteria decision making on strategic selection of wind farms. Renewable Energy, 34(1), pp. 120-126. [ Links ]
[43] Büyüközkan, G. & Güleryüz, S. 2016. An integrated DEMATEL-ANP approach for renewable energy resources selection in Turkey. International Journal of Production Economics, 182, pp. 435-448. [ Links ]
[44] Yazdani-Chamzini, A., Fouladgar, M.M., Zavadskas, E.K. & Moini, S.H.H. 2013. Selecting the optimal renewable energy using multi criteria decision making. Journal of Business Economics and Management, 14(5), pp 957-978. [ Links ]
[45] Pan, H., Zhang, H. & Zhang, X. 2013. China's provincial industrial energy efficiency and its determinants. Mathematical and Computer Modelling, 58(5-6), pp. 1032-1039. [ Links ]
[46] Akbari, N., Irawan, C.A., Jones, D.F. & Menachof, D. 2017. A multi-criteria port suitability assessment for developments in the offshore wind industry. Renewable Energy, 102, pp. 118-133. [ Links ]
[47] Ghosh, S., Chakraborty, T., Saha, S., Majumder, M. and Pal, M. 2016. Development of the location suitability index for wave energy production by ANN and MCDM techniques. Renewable and Sustainable Energy Reviews, 59, pp. 1017-1028. [ Links ]
[48] Kahraman, C., Ertay, T. & Buyukozkan, G. 2006. A fuzzy optimization model for QFD planning process using analytic network approach. European Journal of Operational Research, 171(2), pp. 390-411. [ Links ]
[49] Chang, D.Y. 1992. Extent analysis and synthetic decision. Optimization Techniques and Applications, 1, pp. 352-355. [ Links ]
[50] Chang, D.Y. 1996. Applications of the extent analysis method on fuzzy AHP. European Journal of Operational Research, 95(3), pp. 649-655. [ Links ]
[51] Cheng, E.W.L. & Li, H. 2001. Analytic hierarchy process: An approach to determine measures for business performance. Measuring Business Excellence, 5(3), pp. 30-37. [ Links ]
[52] Saaty, T.L. 1980. The analytic hierarchy process. New York: McGraw-Hill. [ Links ]
[53] Saaty, T.L. 1996. Decision-making with dependence and feedback: The analytic network process. Pittsburgh: RWS Publications. [ Links ]
[54] Zadeh, L.A. 1965. Fuzzy sets. Information and Control, 8(3), pp. 338-353. [ Links ]
[55] Büyüközkan, G. & Çiftçi, G. 2011. A novel fuzzy multi-criteria decision framework for sustainable supplier selection with incomplete information. Computers in Industry, 62(2), pp. 64-174. [ Links ]
[56] Jajimoggala, S., Rao, V.V.S.K. & Beela, S. 2010. A hybrid multiple criteria decision making technique for prioritizing equipments. International Journal of Strategic Decision Sciences, 1(4), pp. 56-75. [ Links ]
[57] Erdogan-Aktan, H. & Kaya-Samut, P. 2013. Agricultural performance evaluation by integrating fuzzy AHP and VIKOR methods. International Journal of Applied Decision Sciences, 6(4), pp. 324-344. [ Links ]
[58] Dagdeviren, M., Yuksel, I. & Kurt, M. 2008. A fuzzy analytic network process (ANP) model to identify faulty behavior risk (FBR) in work system. Safety Science, 46(5), pp. 771-783. [ Links ]
[59] Moalagh, M. & Ravasan, A.Z. 2013. Developing a practical framework for assessing ERP postimplementation success using fuzzy analytic network process. International Journal of Production Research, 51(4), pp. 1236-1257. [ Links ]
[60] Farrell, M.J. 1957. The measurement of productive efficiency. Journal of Royal Statistical Society, Series A (General), 120(3), pp. 253-281. [ Links ]
[61] Charnes, A., Cooper, W.W. & Rhodes, E. 1978. Measuring the efficiency of decision making units. European Journal of Operational Research, 2, pp. 429-444. [ Links ]
[62] Banker, R.D., Charnes, A. & Cooper, W.W. 1984. Some models for estimating technical and scale inefficiencies in data envelopment analysis. Management Science, 30(9), pp. 1078-1092. [ Links ]
[63] Cook, W.D. & Seiford, L.M. 2009. Data envelopment analysis (DEA) - Thirty years on. European Journal of Operational Research, 192(1), pp. 1-17. [ Links ]
[64] Adler, N., Friedman, L. & Stern-Sinuany, Z. 2002. Review of ranking methods in the data envelopment analysis context. European Journal of Operational Research, 140(2), pp. 249-265. [ Links ]
[65] Andersen, P. & Petersen, N.C. 1993. A procedure for ranking efficient units in data envelopment analysis. Management Science, 39(10), pp. 1261-1264. [ Links ]
[66] Fan, J.L., Zhang, X.H., Zhang, J. & Peng, S. 2015. Efficiency evaluation of CO2 utilization technologies in China: A super-efficiency DEA analysis based on expert survey. Journal of CO2 Utilization, 11 pp. 54-62. [ Links ]
[67] Lovell, C.A.K. & Rouse, A.P.B. 2003. Equivalent standard dEa models to provide super-efficiency scores. The Journal of the Operational Research Society, 54(1): pp. 101-108. [ Links ]
Submitted by authors 27 /Mar 2018
Accepted for publication 3 Jul 2019
Available online 30 Aug 2019
* Corresponding author: pinar_kaya2003@yahoo.com

