


Services on Demand
Article
 English (pdf)
 Article in xml format
 Article references
Indicators

Related links
-
 Cited by Google
 -
 Similars in Google
Share

 Permalink
South African Journal of Industrial Engineering
On-line version ISSN 2224-7890
Print version ISSN 1012-277X
S. Afr. J. Ind. Eng. vol.30 n.2 Pretoria Aug. 2019
http://dx.doi.org/10.7166/30-2-2014
GENERAL ARTICLES
Assessing performance of automobile industry using Malmquist productivity index with R
J.D. DayI; M. FandI, II, *
IDept. of Industrial Engineering and Management, National Kaohsiung University of Science and Technology, Taiwan
IIDept. of Automotive Engineering Education, Universitas Negeri Makassar, Indonesia
ABSTRACT
The aim of this study is to measure the performance of the top ten automobile manufacturers for the years 2011 to 2016. After evaluating the data from annual reports, only six manufacturers meet the requirements. The Malmquist productivity index (MPI) is used as the measurement of performance. The MPI consists of two elements: the technical efficiency change index (TECI) and the technological change index (TCI). The 'productivity' package in the open-source programming language known as 'R' is used to estimate the MPI, TCI, and TECI with input and output orientations. The results suggest that the productivity of the automobile industry increased during the period under evaluation. The average productivity scores for the top three manufacturers are as follows: Toyota (1.4844), Volkswagen (1.3382), and Mercedes-Benz (1.4444). However, there are still some industries whose productivity score is less than 1: Ford (0.9846), Honda (0.9925), and Nissan (0.9999). The newness of this study stems from the use of MPI in the global automobile industry, using R language, an open-source application for processing data.
OPSOMMING
Die doel van hierdie studie is om die vertoning van die tien beste motorvervaardigers gedurende die tydperk 2011 tot 2016 te meet. Nadat die data in jaarverslae evalueer is, voldoen net ses vervaardigers aan die vereistes. Die Malmquist Produktiwiteits-indeks (MPI) is gebruik as maatstaf. Die MPI bestaan uit twee elemente, naamlik die indeks vir tegniese doeltreffendheids-verandering (TECI) en die indeks vir tegnologiese verandering (TCI). Die produktiwiteit pakket in die 'R' programmeertaal is gebruik om 'n skatting van die MPI, TCI en TECI te bepaal aan die hand van inset en uitset oriëntasies. Die resultate toon dat die produktiwiteit tydens die oorwegingsperiode toegeneem het. Die gemiddelde produktiwiteitstellings vir die drie beste vervaardigers was soos volg: Toyota (1.4844), Volkswagen (1.3382) en Mercedes-Benz (1.444). Daar is egter steeds sommige vervaardigers wie se produktiwiteitstelling kleiner is as een: Ford (0.9846), Honda (0.9925) en Nissan (0.9999). Die toepassing van MPI in die wêreldwye outomobielindustrie, met die hulp van R programmeertaal, is nog nie voorheen gepubliseer nie.
1 INTRODUCTION
A key part of the economy of any developed country is the global auto industry. A 30 per cent increase over the decade 1995-2005 shows that the industry continues to develop. To produce vehicle parts so that the assembly process achieves a total production of 60 million units needs around nine million workers to be directly involved. This represents around five per cent of the total global manufacturing workforce. More than 50 million jobs are generated by the automotive industry; and it is estimated that each automotive job directly supports at least five other jobs in the community [1].
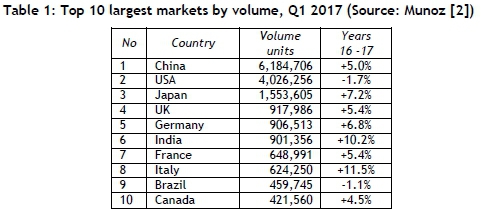
The need for motor vehicles has increased annually. The car sales of the 10 largest producing countries indicate that eight of them experienced increased sales by between 4.5 and 11.5 per cent, with the number of sales ranging between 421,500 and 6,184,706 units. However, sales in two countries decreased by -1.1 and -1.7 per cent respectively (see Table 1). China occupies first position for the volume of units; the lowest ranked is Canada. With respect to sales in the year 2016-2017, Japan occupied the first position with an increase of 7.2 per cent, while the lowest-ranked country, the USA, decreased by -1.7 per cent [2].
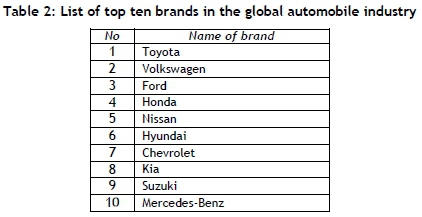
In addition, according to the International Organization of Motor Vehicles Manufacturers (IOCA), the world's ten top-selling automobile brands were Toyota, Volkswagen, Ford, Honda, Nissan, Hyundai, Chevrolet, Kia, Suzuki, and Mercedes-Benz [2]. This reveals the role of automotive manufacturing industries in meeting the needs of consumers while also facing the challenge of competition in offering products with technological advantages and innovation capability.
Innovation capability is required if the industry is to be sustainable in generating and ensuring its competitive advantage [3]. Technological development and innovation are expected in considering the needs of consumers and the environment. Based on the data collected, in 2014 the top 10 innovations in the automobile industry were: automated manual transmission (AMT), Google's driverless cars, vehicle-to-vehicle (V2V) communications, smart cars, pre-collision technology, Ford's aluminum trucks, buses powered by human waste, start-stop technology, Toyota's hovering car, and Land Rover's invisible car [4].
Performance is measured by evaluating the productivity of an industry and comparing it with a similar industry. It is a point of reference for policy-makers and industries to improve their performance and so survive the competitive race to dominate the international market. The industry ratings of various sources refer to several factors. Fortune magazine published a method to characterise the achievements of companies. The measures were defined as follows: revenue, profits, assets, equity, and employees [5]. The Malmquist productivity index (MPI) is a method used to assess technological and technical efficiency changes, which are part of the measurement of productivity.
The measurement of productivity in the automobile industry has been done in several previous studies, including that of Raheman et al. [6], who estimated the growth of eleven major manufacturing industries in Pakistan by measuring their total factor productivity, based on the Karachi Stock Exchange in the period 1998-2007. Two of the industries were automobile industries: an automobile assembly plant and a producer of automobile parts. Raheman et al. [6] used the Malmquist total factor productivity index to calculate the MPI, including efficiency changes and technical changes, by redefining the total assets and the shareholders' equity as input variables. The cost of goods sold and operating expenses, along with the sales revenue of the firm, were output variables.
Xie and Wang [7] studied a sample of nine automobile companies in China to measure purely technical efficiency, scale efficiency, and productivity growth. They estimated that productivity varied between different periods according to the MPI. Zhao and Xia [8] analysed the total factor productivity changes in four main automobile companies during the period from 2003 to 2008. The input indicators they used were the number of workers and total assets, while net and total sales were chosen as output indicators.
Chen [5] measured the MPI of automobile industries between 1991 and 1997, based on Fortune magazine's global 500 data, comprising automakers from Europe, the USA, South Korea, and Japan. They used three input factors - assets, stockholders' equity, and employees - while revenue was an output factor. In addition to doing an analysis of the designs of productivity change, they offered a different perspective on elements of Malmquist. The study also identified the approach of each firm, based on variations in isoquants.
Previous studies used MPI as a model to measure productivity using two reference points: technological change and technical efficiency. In the automobile industry, research has been done by Raheman et al. [6], Xie and Wang [7], and Zhao and Xia [8], who used samples in the automobile industry in a major city or a single country, while Chen [5] used data samples from the global automobile industry.
The choice of input and output variables becomes the level of variation in productivity measurement. Zhao and Xia [8] used the number of employees and total assets as input variables, and net and total sales as output variables. Chen [5] used three input factors: assets, stockholders' equity, and number of employees, but only one output factor: revenue.
The above description shows that, generally, research on measuring productivity in the automobile industry was done in a major city or in a single country; only one study [5] studied the global automobile industry. Furthermore, researchers used the MPI to measure technological change and change in technical efficiency.
This study is expected to provide a wider perspective by taking samples from the global automobile industry, retrieving data directly from the annual reports issued by each company. In addition, we use R, an open-source programming language, to estimate the MPI according to input and output to produce more detailed information.
The present paper aims to measure the productivity of the automobile industry using the Malmquist productivity index (MPI), which has two parts, the technical efficiency change index (TECI) and the technological change index (TCI), and comparing the input and output orientations. The sample used in this study is the global automobile industry, based on the top ten automakers in 2016.
The structure of this paper is as follows: next is a literature review of the automobile industry and the Malmquist productivity index. Then the study's methodology is described and the model is presented, followed by a description of the data collection from the annual report of each company from 2011 to 2016. Finally, the paper introduces the MPI of the automobile industry using the 'productivity' package in R [9] to measure the MPI, the technological change, and the technical efficiency change. In conclusion, the limitations of the study are defined, followed by future recommendations and the final activity in this study.
2 LITERATURE REVIEW
2.1 Automobile industry
One of the major contributors to the world economy by income is the automobile industry. This industry uses many organisational processes, such as development, design, manufacturing, marketing, and selling of vehicles. It is sometimes called the 'automotive industry' or simply 'automakers'.
Generally, the automotive industry is divided into the manufacturing and service industries. The manufacturing industry carries out the process from design, development, and manufacture to marketing and selling. The service industry supports the manufacturing industry by providing after-sales service with a focus on the safety and comfort of motor vehicle users. This service is provided in the form of periodic maintenance or the repair of vehicle system components [10-12].
The automotive industry includes both cars and motorcycles; but the term 'automobile industry' more often refers to the four-wheeled vehicle industry. In this study, the discussion emphasises the automobile manufacturing industry. Currently, this industry produces 55 brands [13]; but this study uses data only from the top ten automakers in 2016: Toyota, Volkswagen, Ford, Honda, Nissan, Hyundai, Chevrolet, Kia, Suzuki, and Mercedes-Benz [2].
2.2 Malmquist productivity index (MPI)
Data envelopment analysis (DEA) is a linear programme, originally recommended by Charnes et al. [14] and known as the Charnes-Cooper-Rhodes (CCR) model. DEA constructed a method for assessing the comparative efficiency of decision-making units (DMUs). Generally, the measurement of efficiency is the ratio of output value to input value, where maximum efficiencies are limited to 1; thus the efficiency of a unit must be less than or equal to 1 [15].
Furthermore, the DEA-based Malmquist productivity index (MPI) developed by Fare et al. [16] aims to estimate the total productivity changes over time. The automobile industry's total productivity change between two adjacent periods [17] is shown in Eq. (2):

where x represents the input vector y, which is used for the production of the output vector y. Furthermore, the output distance is represented by Dt (xt,yt). Measurement of the total productivity change between period t and period t +1 refers to the frontier technology at period t as a result of M; thus M can be defined as the implied geometric during the period of the study. It can be concluded that the total productivity remains unchanged if M = 1, increases if M > 1, and declines if M < 1 [15].
The technological change index (TCI) captures the shift in frontier technology between two periods, while the efficiency change component (TECI) estimates the change in the relative efficiency of the automobile industry between period t and period t +1. Both of them are constituent components of the MPI [18], which can be expressed as below:
The DMUs work to increase their efficiency, and the TECI measures the level of efficiency in an industry. During the research period, the movement of the automobile industry will be evaluated to see whether it is further from or nearer to the frontier technology. The TCI describes that technology improvement as the main contributing factor in measuring the total productivity changes of the automobile industry between two time periods, and the changes in the efficiency limits of the DMUs [17].
The MPI is an option among other productivity indices, for a number a reasons. First, data on input prices is not needed by the MPI. Second, there is no need to specify a way to aggregate the multiple inputs and outputs variables. Third, the assumptions required for the economic units concerned, such as profit optimisation or cost reduction, are also not needed in the MPI. Finally, technological change and efficiency change as components of the MPI indicate the characteristic sources of productivity growth [19].
2.3 R language
R, an open-source solution for data analysis, is similar to the S language, first developed at Bell Labs. It is a language and environment for statistical computing and graphics. The development of this software is supported by a large and active worldwide research community that provides many popular statistical and graphing packages [20].
In R, a 'package' is an essential unit of shareable code. A package bundle is composed of data, code, tests, and documentation, and easily shared with others. As of January 2015 more than 6,000 packages were accessible on the Comprehensive R Archive Network (CRAN), the public clearinghouse for R packages. Many researchers successfully use R, partly because there is a huge variety of packages. The chances are that, if you want to solve a problem, you can use and download packages that have been created and tested by a person or a team in ways, and using research models, that are similar to what you have in mind [21].
Dakpo et al. [9] found the 'productivity' package useful for measuring stages and changes in profitability and productivity that can be evaluated with different indicators. The 'productivity' package consists of the classic Malmquist productivity index (MPI), but also offers another five functions. The MPI can calculate the technological change index, which can be further decomposed into bias technological change components. All computations are implemented with nonparametric data envelopment analysis (DEA), and several assumptions concerning returns to scale are available.
3 METHODOLOGY
This study aims to measure performance, based on previous research conducted by Shao and Lin [22] and Örkcü et aí. [15].
3.1 Data collection procedure
We collect data on the variables of the automobile industries, based on the OICA list. The data is mainly that from OICA and the annual report of each of the top 10 brands in 2016 that were identified earlier (and see Table 2).
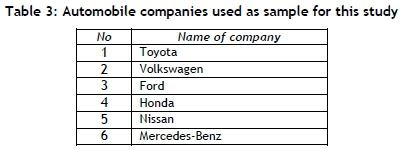
Sixty annual reports were collected as secondary data. Management information is described in the annual reports from 2011 to 2016. In the measurement process, the number of workers and the total assets were the input variables, while the sales of vehicles and the firm's revenue were the output variables. The data was searched by referring to the annual reports, and adjusting the input and output variables that were eligible for advanced entry data processing for six of the brands (Toyota, Volkswagen, Ford, Honda, Nissan, and Mercedes-Benz (Table 3)). Four companies (Hyundai, Chevrolet, Kia, and Suzuki) did not meet the criteria due to incomplete data about the number of workers.
3.2 Model of esti mation
In reference to function theory, Malmquist [23] developed the Malmquist quantity index to describe a range function on the consumption space and the context of production as an extension of this index, and to define the Malmquist productivity index (MPI) [17].
The MPI is defined as:


and

3.3 Variables
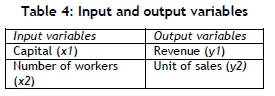
In the literature on measuring changes in the productivity of the automobile manufacturing industry we found many different input and output variables in respect of the data from the annual reports of the automobile industry; so we limited this study to using the two input variables of total assets and number of workers, and using revenue and vehicle sales as the output variables (Table 4).
4 RESULT
4.1 CORRELATION ANALYSIS
The descriptive statistics summary was correlated for the automobile industry according to the input and output variables for the six companies for 2011-2016 (Table 5). The statistics revealed that the input and output levels reflect large differences among the sample of automobile companies.
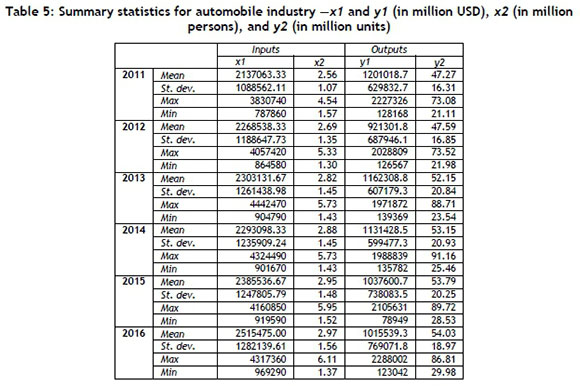
Referring to the input variables, one of them have a high degree of variation in the capital, which fluctuated throughout study period; in 2011 -2013, for example, it increased by nearly 15.8 per cent, but if we compare this with the previous year, it declined in 2014 by -2.02 per cent. In the next two years it continued to increase, so that the capital in the automobile industry increased by 17.7 per cent from 2011 to 2016. The labour output improved during the research period: the number of workers increased on average by nearly 16.01 per cent.
Concerning the output variables, sales grew during the period of study, increasing by an average of nearly 14.3 per cent. In contrast, revenue output decreased during the research period by an average of -15.4 per cent.
4.2 MALMQUIST PRODUCTIVITY INDEX RESULT
The MPI indices for the sample of six companies from the top ten automakers for 2011-2016 are shown below. Two main concerns are indicated in our calculation of the growth in productivity during the period being studied.
After creating the syntax in R Studio, in accordance with the steps in the productivity package [9], we then input the value of the input and output variables for each company. Finally, we wrote the MPI syntax function. If the syntax was true and the data balanced, the results of each score for MPI, TECI, and TEC are clearly visible.
In Table 6 we can see that the MPI score of the six automobile companies increased significantly during the 2011-2016 period. The mean score of 0.9191 in 2011 increased to 2.1056 in 2016 - an increase of 118.65 per cent. If we examine the productivity of each company, Toyota's score rose from 0.9523 to 3.5014 - an increase of 254.91 per cent. Volkswagen's initial score of 0.8312 rose to 2.8358 - an increase of 200.46 per cent - while Ford's productivity score of 0.9231 in 2011 rose to 1.0526 in 2016 - an increase of 12.95 per cent.
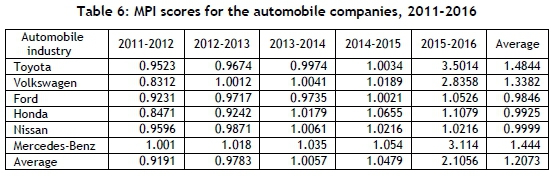
Increases also occurred in the other companies for the same period: Honda rose from 0.8471 to 1.1079 (an increase of 26.08 per cent); Nissan rose from 0.9596 to 1.0216 (an increase of nearly 6.2 per cent); and Mercedes-Benz increased from 1.001 to 3.114 (211.3 per cent).
The result show that Toyota had the highest productivity score of 254.91 per cent, followed by Mercedes-Benz (211.3 per cent), Volkswagen (200.46 per cent), Honda (26.08 per cent), Ford (12.95 per cent), and Nissan (6.2 per cent). The average percentage increase for the six companies over the studied period was 118.65 per cent.
4.3 TECHNICAL EFFICIENCY CHANGE INDEX (TECI)
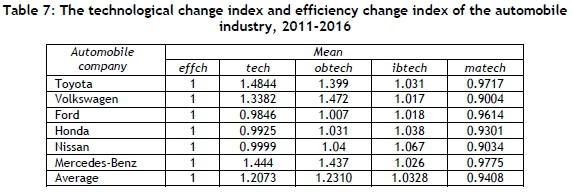
Table 7 shows that, if the technical efficiency change index (TECI) score was 1 across the industry sample at the start of the period, then over the period of 2011-2016 the automobile industry achieved greater efficiency.
4.4 TECHNOLOGICAL CHANGE INDEX (TCI)
As shown in Table 7, if the TECI score was = 1, then the TCI score of the six automobile companies was equal to the MPI score. The average TCI score of each company was as follows: Toyota 1.4844, Volkswagen 1.3382, Ford 0.9846, Honda 0.9925, Nissan 0.9999, and Mercedes-Benz 1.444. The highest TCI score was achieved by Toyota, and the lowest by Ford.
The results show that three companies - Toyota, Volkswagen, and Mercedes-Benz - had TCI scores >1. This indicates a positive shift, or technical progress. In contrast, three companies - Ford, Honda and Nissan - had TCI scores <1, indicating a negative shift or technical regression.
The output-biased technological change (obtech) scores for each company were as follow: Toyota 1.399, Volkswagen 1.472, Ford 1.007, Honda 1.031, Nissan 1.04, and Mercedes-Benz 1.437. The input-biased technological change (ibtech) scores for each company were as follow: Toyota 1.031, Volkswagen 1.017, Ford 1.018, Honda 1.038, Nissan 1.067, and Mercedes-Benz 1.026. Their average score was 1.0328.
5 DISCUSSION
The results of the MPI analysis indicate that there were still productivity scores of <1 in the period 2011-2013. However, these increased significantly to an average score of 1.2073, with an average percentage increase of nearly 118.65 per cent. The measurement of productivity is influenced by the two input variables of labour and capital, with sales and revenue as the two output variables. The productivity score of the automobile industry was <1 in 2011-2013, due to fluctuations in the input variable of capital and the output variable of revenue.
The results for the technical efficiency of all of the automobile companies show that they achieved a TCI score equal to 1. This indicates an increase in their sales performance during the period being studied. Furthermore, supporting factors such as fuel consumption, engineering quality, safety, durability, and aesthetics approved across all their products [24].
The allocation of resources in each unit avoided waste to meet the demands of technical efficiency. This suggests a movement towards best practices in the production of frontier activities. Movement of this kind indicates an improvement in production; but instead it shows a decrease. So it is expected that the companies will make continuous efforts to improve in order to achieve their technical efficiency targets [25].
The analysis of technological change indicates that half of the automobile companies attained a TCI score >1, and the other half had a TCI score <1. The consequences of research and development and innovation have an effect on technological change (TCI), which captures the effect of a shift in the productivity change frontier of the individual automobile company. This helps to clarify the effect of technical change on productivity change using production functions [26].
Technological change (innovation) is about any investment that develops the total productivity of a productive unit. The adoption of technology in line with best practice in the automobile industry will arise when supported by capital accumulation, thus switching the boundary of technology. Providing capital for procedures, techniques, and new methods with the purpose of increasing outcome: all of these result in technological change [25].
6 CONCLUSION
This study has analysed the performance of the automobile industry during the period 2011 -2016, based on the top ten automakers in 2016. After evaluating the data from annual their reports, only six manufacturers met the requirements. The study showed how to use the Malmquist productivity index (MPI) to identify productivity for each automobile company per year. We used two input variables, labour and capital, and two output variables, sale of units and revenue.
The measurements of technological change and technical efficiency change are parts of the MPI. We used the 'productivity' package in R language to calculate the technological change index (TCI), the technical efficiency change index (TECI), and the Malmquist productivity index (MPI). We used the syntax for the procedure, entering the input and output variables with the Malmquist function to show the values of MPI, TECI, and TCI.
The results show that the automobile industry's productivity scored an average of 1.2073. Toyota ranked first with a score of 1.4844. However, there are still companies with a productivity score <1: Ford (0.9846), Honda (0.9925), and Nissan (0.9999). The value of TECI = 1 indicates that every company has been efficient in implementing its business. Because the value of TECI = 1, the TCI score of the automobile companies was equal to the value of MPI.
The ability of the automobile industry to maintain and improve its productivity score by maintaining the input and output factors that translate into productivity depends on variables such as the ability to manage and synergise capital and labour in order to be able to compete in the market, selling their products according their planned targets and thus generating the expected revenue.
The use of the 'productivity' package in R to measure productivity in the automobile industry will allow researchers to develop research on productivity in other industries. As open-source software, researchers can freely access it, and receive package development updates related to productivity.
The weakness of this research is due to the limitations of the data from the sample, which was only 10 companies. However, after carrying out the data search by looking at their annual reports for the 2011-2016 period, four of these companies did not qualify because their data on the number of workers was not complete.
In future research, the approach might be applied to the automobile manufacturing or service industries using more extensive data, such as adding to the sample over a longer period, including more variables, and comparing the productivity of the global industry with those in each country or region.
REFERENCES
[1] OICA. 2018. Economic contributions. http://www.oica.net/category/economic-contributions/ (accessed 21.02.2018). [ Links ]
[2] Munoz, F. 2017. Global vehicle sales up by 4.7% in Q1-17 with Renault-Nissan hitting top 3. http://www.jato.com/global-vehicle-sales-up-by-4-7-in-q1-17-with-renault-nissan-hitting-top-3/ (accessed 10.09.2017). [ Links ]
[3] Louw, L., Schutte, C.S.L., Seidel, C. & Imser, C. 2018. Towards a flexible innovation process model assuring quality and customer needs. South African Journal of Industrial Engineering, 29(1), pp. 155-168. [ Links ]
[4] Taumar, D. 2015. Top 10 Innovations in automobile industry in 2014. The Economic Times. 8 January 2015. http://economictimes.indiatimes.com/industry/auto/news/auto-technology/top-10-innovations-in-automobile-industry-in-2014/articleshow/45688058.cms (accessed 20.01.2018). [ Links ]
[5] Chen, Y. 2011. Productivity of automobile industries using the Malmquist index: Evidence from the last economic recession. Journal of Centrum Cathedra, 4(2), pp. 165-181. [ Links ]
[6] Raheman, A., Afza, T., Qayyum, A. & Bodla, M.A. 2008. Estimating total factor productivity and its components: Evidence from major manufacturing industries of Pakistan. The Pakistan Development Review, 47(4), pp. 677-694. [ Links ]
[7] Xie, B-C. & Wang, J-X. 2009. DEA Malmquist productivity measure with an application to special automobile industry. International Conference on Service Systems and Service Management, Xiamen, China. [ Links ]
[8] Zhoa, L. & Xia, Y. 2010. An analysis of total factor productivity of Beijing automobile industry based on Malmquist index. International Conference on Computer Application and System Modelling, Taiyuan, China. [ Links ]
[9] Dakpo, K.H., Desjeux, Y. & Latruffe, L. 2017. Package productivity. Repository, CRAN. [ Links ]
[10] Farid, M. 2010. Pengembangan model service quality pada industri otomotif. Thesis, Bandung Institute of Technology. Bandung. [ Links ]
[11] Farid, M. & Wiratmadja, I.I. 2011. Pengembangan model service quality industry jasa otomotif. Proceedings of Seminar Nasional Teknik Industry & Kongres BKSTI. Medan, Indonesia, 10-11 October 2011, pp. IIA-148-156. [ Links ]
[12] Wang, C-N., Day, J-D. & Farid, M. 2019. Service innovation model of the automobile service industry. Appl. Sci., 9(12), 2403. [ Links ]
[13] Zhang, B., Nudelman, M. & Gould, S. 2015. These 14 giant corporations dominate the global auto industry. http://www.businessinsider.com/car-companies-of-the-world-2015-2 (accessed 19.12.2017). [ Links ]
[14] Charnes, A., Cooper, W.W. & Rhodes, E. 1978. Measuring efficiency of decision making unit. European Journal of Operational Research, 2, pp. 429-444. [ Links ]
[15] Örkcü, H.H., Balikçi, C., Dogan, M.I. & Genç, A. 2016. An evaluation of the operational efficiency of Turkish airports using data envelopment analysis and the Malmquist productivity index: 2009-2014 case. Transport Policy, 48, pp. 92-104. [ Links ]
[16] Färe, R., Grosskopf, S., Norris, M. & Zhang, Z. 1994. Productivity growth, technical progress, and efficiency change in industrialized countries. Am.Econ.Rev. 84(1), pp. 66-83. [ Links ]
[17] Caves, D.W., Christensen, L.R. & Diewert, W.E. 1982. The economic theory of index numbers and the measurement of input, output, and productivity. Econometrica, 50(6), pp. 1393-1414. [ Links ]
[18] Fung, M.K.Y., Wan, K.K.H., Hui, Y.V. & Law, J.S. 2008. Productivity changes in Chinese airports 19952004. Transp. Rest. Part E, 44(3), pp. 521-524. [ Links ]
[19] Chou, Y-C. & Shao, B.B.M. 2014. Total factor productivity growth in information technology services industries: A multi-theoretical perspective. Decision Support Systems, 62, pp. 106-118. [ Links ]
[20] Kabacoff, R.l. 2011. R in action: Data analysis and graphics with R. New York: Manning Publication Co. [ Links ]
[21] Wichham, H. 2015. Rpackage, 1st edition. Sebastopol, California: O'Reilly Media. [ Links ]
[22] Shao, B.B.M. & Lin, W.T. 2016. Assessing output performance of information technology service industries: Productivity, innovation and catch-up. Int. J. Production Economics, 172, pp. 43-53. [ Links ]
[23] Malmquist, S. 1953. Index numbers and indifference surfaces. Trabajos de Estatística, 4, pp. 209-242. [ Links ]
[24] Tsai, H-H., Cheng, M-J., Hung, S-W., He, D-S. & Hu, L-W. 2015. A study on the sales performance of automobiles: A case study of the US market. Proceedings of PICMET' 15: Management and the Technology Age, pp. 2522-2530. [ Links ]
[25] Barros, C.P., Managi, S. & Yoshida, Y. 2010. Productivity growth and biased technological change in Japan airport. Transport Policy, 17, pp. 259-265. [ Links ]
[26] Tsui, W.H.K., Balli, H.O., Gilbey, A. and Gow, H. 2014. Operational efficiency of Asia-Pacific airports. Journal of Air Transport Management, 40, pp. 16-24. [ Links ]
Submitted by authors 1 Jul 2018
Accepted for publication 2 May 2019
Available online 30 Aug 2019
* Corresponding author: muhammadfarid@unm.ac.id

