


Servicios Personalizados
Articulo
 Inglés (pdf)
 Articulo en XML
 Referencias del artículo
Indicadores

Links relacionados
-
 Citado por Google
 -
 Similares en Google
Compartir

 Permalink
South African Journal of Industrial Engineering
versión On-line ISSN 2224-7890
versión impresa ISSN 1012-277X
S. Afr. J. Ind. Eng. vol.30 no.2 Pretoria ago. 2019
http://dx.doi.org/10.7166/30-2-1977
GENERAL ARTICLES
Medical device innovation in South Africa: Evolution of collaboration networks (2001-2013)
K. de Jager; C. Chimhundu; T. Saidi; T.S. Douglas*
Division of Biomedical Enginering, Faculty of Health Sciences, University of Cape Town, South Africa
ABSTRACT
The evolution of medical device development in South Africa was investigated for the period 2001-2013. Collaboration networks for four sectors - academia, healthcare, industry, and science and support - were derived from a bibliometric study. Centrality measures identified dominant institutions. New actors entering the networks either exhibited preferential attachment to these institutions, or joined the network as part of an isolated cluster. Of the new institutions, foreign collaborators seldom stayed beyond five years, while local institutions seldom left after entering the field. Over the 13-year period, local collaboration activity persisted, while local-foreign collaborations were seen to decline. Over time, the network topology became more akin to that of a small-world network. The findings of the study may support innovation management by guiding institutional strategies for effective collaboration.
OPSOMMING
Die ontwikkeling van mediese toestelle in Suid-Afrika is ondersoek vir die periode 2001 tot 2013. Samewerkingsnetwerke vir vier sektore, naamlik die akademici, gesondheidsorg, die industrie en wetenskap en ondersteuning, is afgelei vanuit 'n literatuurstudie. Sentraliteitmaatstawwe het die leidende instansies identifiseer. Nuwe rolspelers wat die netwerke betree het, het 'n voorkeur getoon om saam met hierdie instansies te werk of het by die netwerk aangesluit as 'n geïsoleerde groep. Onder die nuwe rolspelers het buitelandse medewerkers selde vir langer as vyf jaar betrokke gebly. Daarteenoor het plaaslike medewerkers selde die veld verlaat. Plaaslike samewerking het oor die verloop van die 13 jaar volgehou, maar internasionale samewerking het afgeneem in die tydperk. Met die verloop van tyd het die netwerk-topologie tot 'n netwerk soortgelyk aan 'n klein-wêreld netwerk ontwikkel. Die bevindinge van hierdie studie mag die bestuur van innovasie ondersteun deur institusionele strategieë vir effektiewe samewerking te begelei.
1 INTRODUCTION
Developing countries such as South Africa rely heavily on the importation of medical devices [1]. However, many of their citizens lack access to these devices due to various environmental, financial, and societal barriers [2]. Local development and production of context-appropriate medical devices, based on identified needs, is considered a way to overcome these challenges, increase access to devices, and ultimately, to improve health [3, 4, 5].
Medical device innovation is a cross-disciplinary endeavour, often involving collaboration across different sectors. The World Health Organization [5] has suggested that the development of health products for local needs relies on the combination of identifying health needs, providing a research base, and gaining support from industry. This aligns with the findings of Hicks and Katz [6], in which three sectors are shown to be involved in medical device innovation: academia (A), in the form of higher education institutions; healthcare (H), comprising clinics, hospitals, and other medical facilities; and industry (I), companies, firms, organisations and individuals involved in the commercialisation of medical devices. Collaboration across these sectors is essential for medical device development due to the different resources offered by each sector: academia provides research insights and specialist equipment; healthcare identifies patient needs; and industry has R&D expertise and the ability to supply the devices to the public. Such multi-sector collaborations have been shown to offer collective benefits to the health and wealth of the United Kingdom [7].
The benefits of collaboration and knowledge networks, for health innovation broadly, have been recognised; collaboration is essential for addressing complex health problems involving multiple stakeholders through innovation that draws on multiple disciplines [8]. Collaboration networks have been proposed and studied as tools to support strategic planning for, and implementation and management of, developing countries' efforts to address neglected diseases [8, 9, 10]. Analysis of such networks can form a basis for monitoring and evaluation of research productivity and the outcomes of decision-making and interventions, as well as for tracking institutional development [9]. The status and contributions of collaborative science and innovation networks can inform science and technology policy and management [9, 11, 12, 13].
Bibliometric analysis has been used to investigate the influence of collaboration on biomedical innovation. Lander [12] investigated the role of sectors in Canada's infection and immunity network, while Chinchilla-Rodríguez et al. [14] examined collaboration patterns in medical research as a way to establish the scientific capacity of countries in South America. Fonseca et al. [9] assessed the evolution of a tuberculosis research and innovation network in Brazil, focusing on the activities of a large and geographically distributed public health institution, and with a view to generating evidence to support its science and technology management. McKelvey and Rake [15] found that companies' links to biotechnology companies and academic institutions within their co-publication network supported product innovation in pharmaceutical cancer research. Chimhundu, de Jager & Douglas. [16] characterised the South African cardiovascular medical device innovation landscape, identifying the main actors within the field, investigating the extent of collaboration between sectors, and identifying the types of cardiovascular devices that have been produced. De Jager et al. [17] took a broader view than that of Chimhundu et al. [16] by considering the development of medical devices of all categories in South Africa in aggregate, over the period (2000-2013).
Several of these studies applied social network analysis to bibliometric data to characterise the collaboration between authors and organisations. Social network analysis examines networks of individuals, teams, or organisations through their relationships, which are often defined as 'co-authorship' on publications [18]. The methodology provides a set of metrics that are used to characterise and quantify these relationships.
This paper examines the evolution of the collaborative network for medical device innovation in South Africa. Social network analysis was applied to bibliometric data, particularly co-authorship, in order to assess the development of institutional and sectoral contributions over the period 20012013.
2 THE EVOLUTION OF SCIENTIFIC NETWORKS
Scientific collaborations provide a convenient way to study the dynamics of knowledge diffusion through networks that provide a route for information dissemination and knowledge production among scientists and inventors [19]. The structure of the network over which the transmission of information takes place has a significant effect on the production of knowledge and innovation [20]. In particular, small-world structures, which consist of "sparsely connected regions, with dense pockets of highly cohesive ties" [21], are thought to enhance information propagation [22] and knowledge and innovation production [19].
In scientific collaborations, co-authorship is an indicator of knowledge sharing [23, 24], presenting an example of how networks, as dynamic entities, evolve and adapt over time [25, 26]. Actors tend to join, participate, attract, compete, and disappear, which affects the strength of the collaboration [27].
As networks evolve and expand, the number of actors increases. The total number of links also increases through connections being formed between new and old actors, as well as new connections being formed between old actors [24, 25]. New links appear between old actors as the network evolves, representing papers written by actors who were part of the network but had not previously collaborated [25]. Such internal links are known to affect both the topology and the dynamics of the network, and are subject to preferential attachment [28] - the tendency of actors to link with higher probability to those that already have a larger number of links [29]. Actors with many collaborators and high scientific prestige gain connections from actors who are newly entering the network [30].
Authorship based on collaboration usually takes place over a period of time, with five years typically considered the life-span of network links [19, 31, 32]. A five-year window period provides a relatively stable picture of collaboration, as it is long enough to smooth out yearly variation in publication rates by specific actors [12]. As it usually takes time to publish an article, a five-year window period caters for the delays and other factors that may interfere with publication. As networks are not fixed in time and place, but constantly evolve, a longitudinal view provides a more detailed analysis of the overall period than a cross-sectional one [33].
3 METHODOLOGY
Bibliometric studies have been used to generate collaboration networks based on the co-authorship of journal publications [12, 14]. A similar approach is used here, in which collaboration activity for medical device development in South Africa is investigated with the aid of scientific publications. The dataset used in this paper is the same as that of de Jager et al. [17], which provided a static and aggregate overview of the medical device development landscape and where a more detailed description of the data acquisition methodology can be found. A summary of the data acquisition methodology is presented here.
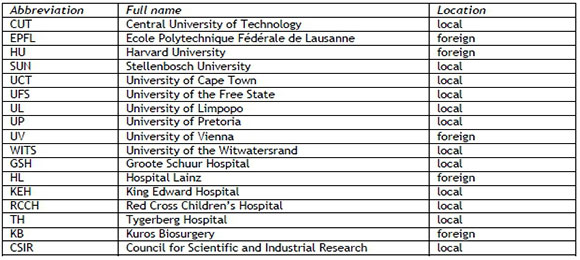
The term 'medical device' covers a broad range of technologies; consequently, a publication search based on the devices themselves is difficult to define. An alternative approach was used in which an exploratory publication search was structured around the three main sectors involved in biomedical innovation [6]. The South African institutions potentially involved in the field, from each sector, were identified: 23 universities in existence in South Africa at the end of 2013; 10 academic hospitals; and 32 companies known to be active in the medical device field through their registration with either the Medical Device Manufacturers South Africa (MDMSA), or the South African Medical Device Industry Association (SAMED). The institutions' names, and the phrase 'medical devices South Africa', were used as search terms in online databases (Google Scholar and PubMed). The institutions' websites were also searched for lists of research outputs.
The search results were manually filtered to ensure that the publications retained had at least one co-author affiliated with a South African institution, and that the publication date fell within the period of interest (2001-2013). The publications were also required to discuss medical device development, in accordance with the medical device definition provided by the Global Harmonization Task Force (GHTF) of the World Health Organization [34]. The affiliations of the coauthors were extracted and used to generate a collaboration network in which nodes represented institutions. These institutions were categorised as belonging to one of four sectors: the A-, H-, and I-sectors previously mentioned, and a fourth, science and support (S-sector), consisting of nongovernment organisations, non-profit organisations, science councils, other research facilities, and designated special interest groups.
The growth of the medical device landscape over time was investigated using a five-year moving window over the 13-year period to produce a set of nine networks. The window length of five years was selected to correspond with the expected life-span of an 'edge' in a collaboration network [19, 31]. An edge is the tie between nodes within a network (institutions in this case) that exists if the institutions have collaborated on a publication. The thickness of the edge is weighted according to the number of such publications. The networks were generated and further analysed using UCINET (version 6.474) [35] and NetDraw (version 2.131) [36].
3.1 Centrality measures
Dominant institutions within each five-year network were identified by calculating centrality measures [37, 38] for each of the nodes. The centrality measures were normalised, as indicated in equations 1 to 3, to allow comparison across networks of different size [39].
3.1.1 Degree centrality
The nodal degree, Co(n), represents the number of edges through which node n is linked to other nodes. Normalised degree centrality, CD(ni) (Eq. 1), is found through dividing by one less than the total number of nodes, n, in the network [40]. All degree values presented in this paper were calculated for non-weighted edges, as such degree values represent the number of institutions to which an actor is connected, or the extent to which a node is interconnected [41, 42]; nodes with a high degree are considered to have more favoured positions (more access to network resources, less dependence on other nodes).

3.1.2 Closeness centrality
'Closeness' is typically defined as the inverse sum of the shortest distance between a focal node and all other nodes in the network [39]. However, Opsahl et al. [43] pointed to a limitation of this approach: that all nodes are to be found within the same network component, as the distance between two nodes from different components is not finite. They went on to suggest summing the inverse distances as a way to overcome this limitation while maintaining the original idea behind the measure - that is, to quantify how long it takes for information to spread from a given node to others in the network [44, 45]. Equation 2 gives the normalised version of the alternate closeness measure [46], where d(ni, nj) represents the shortest path (i.e., the lowest total number of edges) linking nodes n and nj [40].
By using the approach of Opsahl et al. [46], we can rank all the nodes for the network as a whole, as opposed to the Freeman [39] method, where nodes can only be ranked within each component.

3.1.3 Betweenness centrality
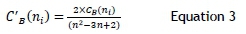
'Betweenness', Cs(n), is the number of times node n falls on the shortest path between all other pairs of nodes in the network, divided by the total number of node pairs [39]. It measures the influence a node has on information flow within the network [43]. The measure is normalised in Equation 3 through division by the maximum possible number of shortest paths, excluding the node under consideration [47].
3.1.4 Group density
The extent of collaboration between local and foreign institutions was evaluated through the use of group densities, a network analysis metric that quantifies interconnectedness between groups of nodes within the network by dividing the sum of edges between the nodes by the maximum possible number of edges that could exist. Group densities provide a measure of the speed with which information exchange occurs within and between the groups [38].
3.2 Preferential attachment
Abbasi, Hossain, & Leydesdorff [48] presented a methodology for quantifying preferential attachment within networks. First they characterised the frequency with which nodes move in and out of networks by considering: (i) the total number of nodes in each window period; (ii) the number of old nodes remaining in the network that were also present in the previous window period; (iii) the number of new nodes joining the network that were not present in the previous window period; and (iv) the number of old nodes leaving the network (i.e., nodes that were present in the previous window period that are no longer present in the current window period). This was further expanded by counting the number of new nodes that formed attachments to another new node or an old node. Note that it is possible for a single new node to form attachments to both a new and an old node when entering the network. A similar analysis was carried out in which the number of old nodes forming attachments to new nodes or other old nodes was counted. The number of old nodes that terminated an edge connection with at least one remaining node were also counted (i.e., an edge existed between the nodes in the previous window period; in the current window period the edge no longer existed, even though both nodes were still present in the network).
Next, Abbasi et al. [48] investigated how the position of old nodes within the network impacted on the number of new nodes attaching to them by comparing the centrality measures of the old nodes with the average number of new nodes forming attachments. This was achieved using the mean of each centrality measure as a threshold for dividing old nodes into two categories, high or low, according to the centrality measure of each individual old node. The number of new nodes falling within each category, as a percentage of all new nodes, could then be calculated.
In this paper, the analysis of Abbasi et al. [48] was applied to local and foreign institutions (nodes) separately, allowing the movement of local and foreign entities to be investigated independently.
3.3 Small-world networks
The clustering coefficient is a measure of local network structure [22, 49] and quantifies the tendency of nodes to form densely connected neighbourhoods or clusters within the network [19, 38]. It is typically calculated by finding the density of all nodes directly connected to an actor (i.e., the actor's local neighbourhood), repeating this calculation for all nodes within the network and taking the average as the clustering coefficient for the entire network [38].
Global network structure is measured using average path length, defined as the shortest path (number of edges traversed) between any two nodes within a network, averaged over all pairs of nodes [22]. It is considered a global measure, as the topology of the entire network must be known in order to calculate it [49]. Average path length quantifies how close together nodes are [38], with high values indicating that, for two nodes to communicate, information must pass through a large number of intermediaries [49].
A small-world network is characterised by a high clustering coefficient and short average path length [22]; however there are no threshold clustering coefficient or path length values for which a network is considered to be small-world. Typically, the expected clustering coefficient and average path length for a random-network of a given size (number of nodes) is found. These expected values are then compared against the actual-network values.
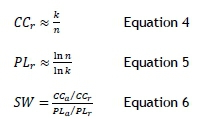
The expected random-network clustering coefficient (CCr) and random-network average path length (PLr) can be found using equations 4 and 5 respectively [50]; n represents the size of the network (number of nodes), while k represents the average degree (average number of edges per node). A small-world measure (SW) can then be calculated (Eq. 6) using the random-network values as well as the actual-network clustering coefficient (CCa) and average path length (PLa). This SW measure has frequently been used in the literature [19, 49, 51, 52], although it is only found for the largest component in the network.
Small-world networks tend to have CCa > CCr and PLa = PLr [49]. However, as the SW measure typically increases in value as network size increases, there is no critical SW index at which networks are defined as being small-world. Consequently, the SW measure needs to be assessed through comparison with existing small-world studies, from which it can be inferred whether or not a network has small-world tendencies.
4 RESULTS AND DISCUSSION
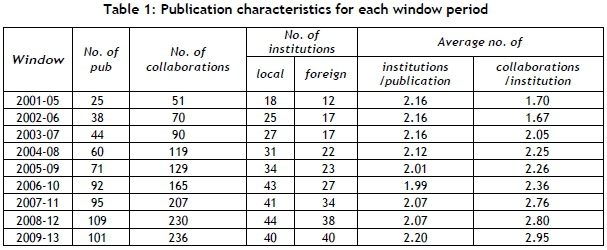
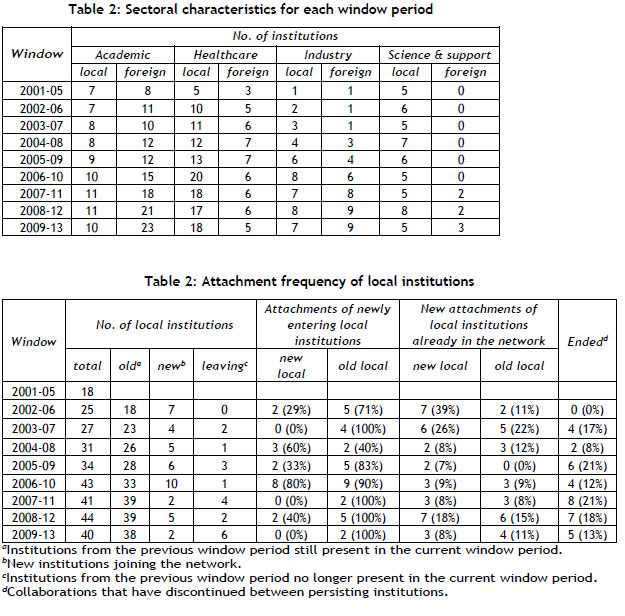
The search results over the 13-year period consisted of 171 publications, from which 116 institutions were identified through co-author affiliations. The publications were sorted, according to their publication dates, into the nine overlapping window periods generated using the five-year moving window. Table 1 lists the number of publications found for each window period, as well as the number of collaborations and institutions, both local and foreign, that were associated with the relevant publications. Table 2 shows the number of institutions, broken down by sector.
The number of publications, collaborations, and institutions (both local and foreign) tended to increase with time, suggesting that the medical device innovation network in South Africa is evolving and expanding. However, the ratio of local to foreign institutions decreased: a ratio of 1.5:1 was seen in the first window period (2001-2005); but the ratio had dropped to 1:1 by the last window period (2009-2013). The average number of institutions per publication remained fairly constant across all window periods.
In the A-sector, the number of both local and foreign institutions was seen to increase with time, although the rate at which they increased differed. The number of local academic institutions was only slightly lower than that of foreign institutions in 2001-2005, but by 2009-2013 the number of foreign institutions was more than double the number of local ones. The large number of foreign universities is possibly due to universities being encouraged to engage in international collaborations [53]. This is a global trend that has become particularly noticeable in scientific collaborations over the last decade [54]. The A-sector was also the largest of the four across all window periods. This could in part be due to the inherent bias of the data set (discussed later), but it may also be a consequence of the prominent role played by universities in the type of collaboration being examined.
The second-largest sector overall was the H-sector. However, this was the largest sector by the 2009-2013 period, when considering only local institutions. The large increase in local H-sector actors over time may indicate that hospitals are steadily becoming more involved in the medical device innovation process. The number of companies from the I-sector, both local and foreign, increased over time, while the number of local S-sector institutions stayed more or less constant - possibly an indication of a small and fairly stable sector. Foreign S-sector institutions only featured in the last three window periods.
4.1 Visualising network evolution
For each window period, a network was generated using the publications falling within the five-year window (nodes = institutions; edges = co-authored publications). Figure 1 shows the nine networks, representing the evolution of the medical device innovation landscape over the entire period 20012013. The shape of the nodes represents the sectors to which the institutions belong; node colour distinguishes local and foreign institutions; node size is scaled according to node degree.
The size of the collaboration networks tends to increase with time. This increase may be attributed to two factors:
1. An increase in the number of nodes. As new institutions become active in medical device innovation, they appear as new nodes entering the network. This would be indicative of an increase in medical device development capacity. Local nodes would directly increase the local capacity, while foreign nodes would potentially increase the knowledge base and resources available for local development.
2. An increase in the number of edges in the network can occur in two ways: first, institutions already within the network that have not previously collaborated produce a publication together; and second, an increase in the number of publications produced by institutions with a previously established collaborative relationship results in an increase in the weighting of the edges. Both of these instances are indicative of an increase in collaborative activity.
The average number of institutions per publication remaining fairly constant over the 13-year period (see Table 1) implies that the increase in network size can be attributed to an increase in the number of publications, with the introduction of new institutions into the network and new ties within the network. The networks therefore show an increase in collaborative activity, as confirmed by the increase seen in the average number of collaborations per institution.
4.2 Identifying dominant institutions
The dominant institutions were identified by calculating centrality measures for each of the nodes. Figures 2 to 4 show scatter plots of the normalised centrality measures for all nine window periods. Marker shape and colour are used to distinguish between node sector and location (local or foreign). The top five ranking nodes within each window period are listed at the top of the figures.
The degree centrality (Figure 2) was calculated using non-weighted edges, so that the dominance of the node was attributed to the number of different institutions to which it was connected and not the number of times the node has produced publications with the same institutions. The values did not vary greatly between window periods, indicating that the average number of connections a node has, relative to the size of the network, remained consistent with time. Local institutions, predominantly from the A and H-sectors, were seen to have the highest degree centralities (> 0.1), indicative of local institutions tending to create numerous connections, compared with the foreign institutions, which tended to have low degree centralities (< 0.1). Most likely foreign institutions work on a single publication with a local collaborator, while local institutions have many publications and consequently many collaborators.
All nine networks consisted of multiple components (see Figure 1). Consequently, closeness was calculated for the entire network using the method presented by Opsahl et al. [43] to find the sum of inverse distances. Figure 3 shows that the closeness values tended to increase with time, as closeness is a measure of how much a node affects the speed of propagation of information; this would imply that the nodes became ever more interconnected. This conclusion is further supported by considering the nine networks in Figure 1, where it is seen that the size of the largest component tended to increase with time due to the formation of connections with several of the nodes from previously isolated clusters. By 2009-2013, the nodes within the largest component had become far more interconnected, resulting in an increase in the rate of information flow (closeness metric). These observations indicate that the establishment of pathways in a network for efficient information exchange takes time. Figure 3 also shows that the local actors tended to have the highest closeness centralities, and to be dominated by the top five ranked actors. However, outside of the top five, there seemed to be an even mix of local and foreign actors, suggesting that, on average, the position of the local actors within the network, in terms of their closeness to other actors, is no better than that of the foreign actors.
Two observations can be made for the betweenness measures shown in Figure 4. First, the betweenness measure of the top-ranking nodes tended to increase with time. Second, across all window periods, many of the same institutions were seen to feature within the top-ranking nodes. These observations indicate stronger brokerage roles developing over time for specific nodes, which can also be observed in Figure 1, with high-ranked nodes remaining at the centre of ever bigger clusters. Figure 4 also shows that the number of nodes with a non-zero betweenness value increased with time - an indication of more actors establishing themselves in the field and having a direct effect on the flow of information.
Over the 13-year period, some variation was seen in the top-ranked institutions for all centrality measures. However, a few institutions featured consistently - specifically, the University of Cape Town (UCT), Stellenbosch University (SUN), and the University of the Witwatersrand (WITS) from the local A-sector, and Groote Schuur Hospital (GSH) from the local H-sector. The foreign Kuros Biosurgery (KB) was the only actor from the I-sector to feature, and then only in the degree and closeness measures for the early window periods. Similarly, only one actor featured from the S-sector -the local Council for Scientific and Industrial Research (CSIR) - and then only in the betweenness measure. The number of dominant foreign institutions decreased with time, while more local institutions became dominant. This is particularly evident when comparing the first and last window periods: eight of the 17 top-ranked positions were occupied by foreign institutions in the first period (2001-2005), compared with no foreign occupied positions (out of 15) in the last period (2009-2013).
4.3 Local versus foreign collaboration
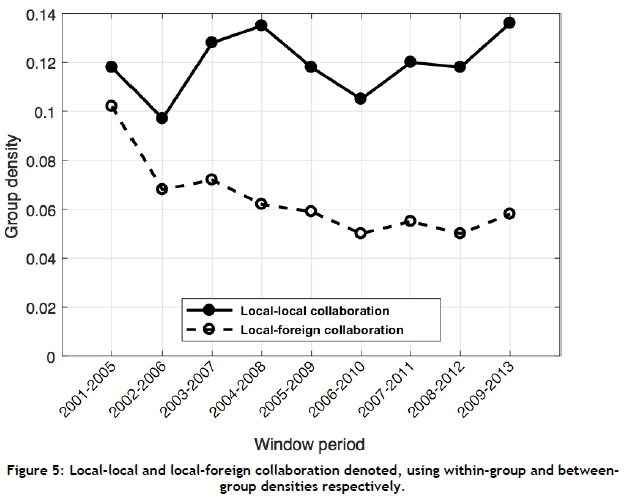
Group densities were calculated for local and foreign nodes for each window period. Two collaboration types were of interest: within-group density for local nodes, and between-group density for local-foreign collaboration. Figure 5 shows the trend lines across the entire 13-year period for both collaboration types.
Local institutions were seen to collaborate more readily with each other than with foreign institutions. Generally, the local-local collaborations remained consistent over the 13-year period, while local-foreign collaborations declined. Thus the local influence is more dominant within the South African landscape than the foreign influence, despite the overall number of foreign institutions increasing with time.
4.4 Movement of nodes
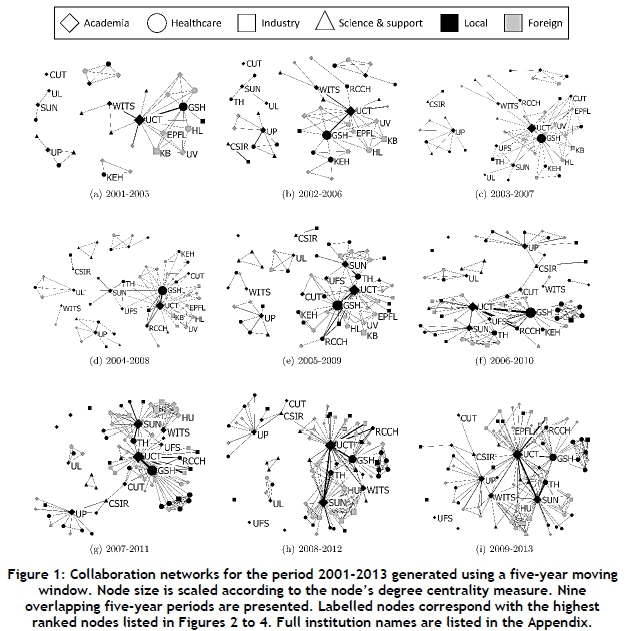
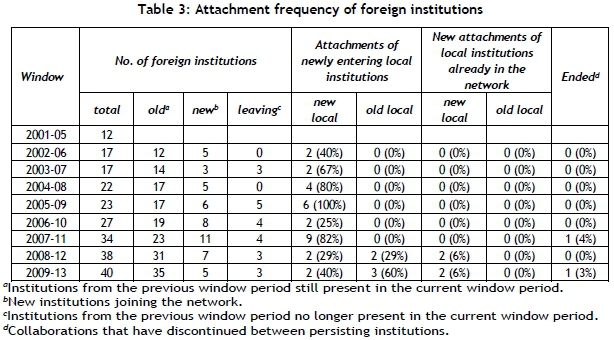
Table 2 shows the number of local institutions joining, remaining within, or leaving the network, for each window period. The number of new local institutions joining the network by forming attachments to either new or old local institutions is also shown. Similarly, the attachment frequency for old local institutions is presented, along with the number of such institutions that discontinued an attachment (collaboration) without the institution having left the network. Table 3 shows a similar analysis for foreign institutions.
Local institutions tend to enter the network at a higher rate than that at which they leave, while foreign institutions tend to enter and leave the network at about the same rate. This accounts for the mostly zero attachment frequencies for old foreign nodes, and the low discontinued collaboration rates. Collaborations are only considered to be discontinued if both nodes are still present in the network but are no longer attached. If the nodes left the network, the collaboration (although no longer existent) is not included in the discontinued count. Old local institutions were also seen to continue making new attachments over time, while old foreign institutions did not.
Overall there was substantial movement in and out of the network for both local and foreign nodes, suggesting that the network is dynamic [27]. The result is a continual change of resources and knowledge over time. In any given window period, some of the new nodes entering the network formed connections with nodes already established within the network.
Figure 6 shows the percentage of all new institutions found to form attachments to old institutions with high or low centrality measures. The analysis differentiates between local and foreign institutions being the new nodes entering the network, as well as being the old nodes to which new attachments are formed. Echoing the results of Tables 2 and 3, we see that the new institutions (both local and foreign) tend to attach to old local institutions more readily than to old foreign institutions. (Figures 6(a) and 6(c) show a higher percentage of new nodes forming attachments than do Figures 6(b) and 6(d).)
Figures 6(a) and 6(c) also show that, in the earlier periods (2002-2006; 2003-2007), more new institutions (local and foreign) attached to local institutions with low centrality measures, while in the later years (2004-2008 onwards) the opposite was true. This may be attributed to the infancy of the medical device development field in South Africa during the earlier periods. During this time, when new entities entered the network, they were just as likely to form collaborations with low-ranking nodes as they were to high-ranking nodes. However, after the field matured and the dominant institutions had started to establish themselves, most new entities joining the network displayed tendencies of preferential attachment. All three centrality measures (degree, betweenness, closeness) showed similar trends for both the high and low categories.
Also, through visual inspection of Figure 1, some of the new nodes appear to have entered the network as isolated clusters, thus not exhibiting preferential attachment. For the local institutions in the 2001-2005 isolated clusters, two trends were noted with time: the institutions either disappeared from the network, or established new links and were absorbed into the largest component of the network. In the case of the foreign institutions in the isolated clusters, all the nodes fell away.
For the first four window periods (2001-2005 to 2004-2008), nodes remaining in the network for longer than five years (indicative of actors co-authoring more than one publication) were identified; 20 out of 34 (59%) local institutions and 5 out of 25 (20%) foreign institutions were found to remain in the network. Once again, these results show that local collaborators tended to become more established in the innovation landscape over time, engaging in new collaborations, while foreign collaborators tended to engage in a single collaboration and then disappear. This observation further adds to our understanding of the trends seen in Figure 5.
Typically, the foreign collaborators that were present for longer than five years were seen to exhibit preferential attachment, as opposed to entering the landscape in an isolated cluster. This corresponds with the findings of Owen-Smith & Powell [55], that both geographic proximity and the formation of ties to a dense regional network influence the establishment of formal linkages.
4.5 Changing network structure
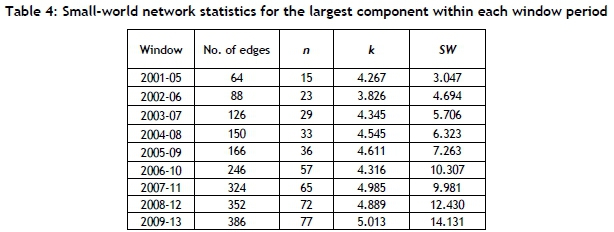
Table 4 shows the small-world measure found for the largest component in each of the nine networks (Figure 1). Montoya & Solé [56] showed that a small network with n = 134 and k = 8.70 exhibited small-world patterns. Eslami, Ebadi & Schiffauerova [19] found the SW measure of this network to be 3.4. Considering that the sizes (n) of the nine networks are all less than 134, and that SW > 3.4 for all but the 2001-2005 network, we can infer that the SW measures obtained are indicative of small-world behaviour within the medical device innovation field in South Africa. This tendency is also seen to increase as the network evolves, which typically indicates more efficient knowledge transfer within the network over time. Further case study analysis would be required to ascertain what the implications would be for the quality of medical devices developed.
4.6 Bias and other limitations of the data set
The data set presented has an inherent bias in that scientific publications are highly relevant for only one of the four sectors considered - academia. Furthermore, Laudel [57] points out that not all collaborations are formally acknowledged through co-authorship, and it should thus only be considered as a partial indicator of collaboration at the micro-level (i.e., individual collaborators). Finally, due to the nature of medical devices, it was not possible to conduct an exhaustive search of relevant publications, which resulted in the exploratory search methodology used; thus not all relevant publications would have been found.
Laudel [57] does point out, however, that at the macro-level (i.e., the institutional level), the co-authorship bias does not seem to influence comparisons between national and international collaborations. Therefore, the current data set, although not complete, has value in providing initial insights into the evolution of medical device development activity in South Africa, about which very little is currently known. The shortcomings of the present study may be addressed in future research with a more robust data set in which hidden collaborations are made more visible, possibly through analysis of the acknowledgements in scientific publications, and by introducing other data sources (e.g., patents).
4.7 Implications for innovation management
The results of social network analysis may assist in the management of health innovation activities, as suggested by Fonseca et al. [9] for research and innovation related to tuberculosis, and by Morel et al. [10] for neglected disease research, both in Brazil. For example, the network might enable decision-makers to identify organisations playing central roles, or located at critical network positions, and to identify collaborative groups [10]. In the collaborative network for medical device innovation in South Africa that has been presented, central institutions have been identified that play a role in grounding the network, enabling knowledge diffusion and attracting new actors to the network. Pathways for new institutions entering the network and becoming established have been examined, and these provide opportunities for new actors to enter the network. The role of foreign institutions has also been considered; their short-term presence in the network may have a stimulating effect on local innovation activity, and decision-makers may therefore consider ways in which organisations might encourage foreign collaboration.
5 CONCLUSIONS
The results presented here give insight into the collaborative activities that have occurred over a 13-year period by identifying the key actors and presenting trends seen in the development of the medical device field. New institutions were seen to enter the field in multiple ways, exhibiting preferential attachment, as well as entering in isolation. Most of the foreign actors joining the field left after a single collaborative contribution, while local actors endured. The evolution of the network was such that the small-world tendencies increased with time, indicating that knowledge was ever more efficiently diffused as the field matured.
The continued growth and establishment of an innovation field within a developing setting such as South Africa is encouraging to see. The knowledge derived from this network analysis may support medical device innovation management in South Africa by guiding institutional strategies for effective collaboration. The knowledge base on medical device innovation could also be harnessed and used to advance the WHO goal of locally developed, accessible medical devices, provided that appropriate policy intervention is introduced. Such policy intervention might be guided in terms of the kind of collaboration that is supported by the analysis presented here, and by the further studies that have been recommended.
ACKNOWLEDGMENTS
The authors wish to thank Mr Mohammed Esmail (Cape Peninsula University of Technology), Ms Katharina Hauprich (University of Applied Sciences Hamm-Lippstadt), and Dr Robyn May (University of Cape Town) for contributions towards collection, filtering, and exploration of data.
The work was supported by the Community Engagement Programme [grant no. 105548] and the South African Research Chairs Initiative [grant no. 98788] of the Department of Science and Technology and the National Research Foundation.
REFERENCES
[1] DST. 2013. The bio-economy strategy. Pretoria: Department of Science and Technology (DST). [ Links ]
[2] WHO. 2010. Future public health needs: Commonalities and differences between high- and low-resource settings. Geneva: World Health Organization (WHO). [ Links ]
[3] Abbas, J., Sarvastani, A.S., Poluta, M., Si, P. & Velazquez-Berumen, A. 2013. Improving access to medical devices in low-resource settings through local production and technology transfer: WHO 2013 survey results. In: Second WHO Global Forum on Medical Devices: Priority medical devices for universal health coverage. Geneva, Switzerland: World Health Organization, p. 131. [ Links ]
[4] Palamountain, K.M., Stewart, K.A., Krauss, A., Kelso, D. & Diermeier, D. 2010. University leadership for innovation in global health and HIV/AIDS diagnostics. Global Public Health, 5(2), pp. 189-196. doi:10.1080/17441690903456274. [ Links ]
[5] WHO. 2012. Local production for access to medical products: Addressing the barriers and challenges in low- and middle-income countries. Geneva: World Health Organization. [ Links ]
[6] Hicks, D. & Katz, J.S. 1996. Hospitals: The hidden research system. Science and Public Policy, 23(5), pp. 297-304. doi:10.1093/spp/23.5.297. [ Links ]
[7] ACMEDSCI. 2010. Academia, industry and the NHS: Collaboration and innovation - Meeting report. London: The Academy of Medical Sciences. [ Links ]
[8] Fonseca, B., Sampaio, R., Fonseca, M. & Zicker, F. 2016. Co-authorship network analysis in health research: Method and potential use. Health Research Policy and Systems, 14(1), 34. doi: 10.1186/s12961 - 016-0104-5. [ Links ]
[9] Fonseca, B., da Silva, M., de Araújo, K., Sampaio, R. & Moraes, M. 2017. Network analysis for science and technology management: Evidence from tuberculosis research in Fiocruz, Brazil. PLoS ONE, 12(8), pp. 1-17. doi:10.1371/journal.pone.0181870. [ Links ]
[10] Morel, C.M., Serruya, S.J., Penna, G.O. & Guimaraes, R. 2009. Co-authorship network analysis: A powerful tool for strategic planning of research, development and capacity building programs on neglected diseases. PLoS Neglected Tropical Diseases, 3(8), e501. doi:10.1371/journal.pntd.0000501. [ Links ]
[11] Bender, M.E., Edwards, S., von Philipsborn, P., Steinbeis, F., Keil, T. & Tinnemann, P. 2015. Using co-authorship networks to map and analyse global neglected tropical disease research with an affiliation to Germany. PLoS Neglected Tropical Diseases, 9(12), e0004182. doi:10.1371/journal.pntd.0004182. [ Links ]
[12] Lander, B. 2013. Sectoral collaboration in biomedical research and development. Scientometrics, 94(1), pp. 343-357. doi:10.1007/s11192-012-0776-8. [ Links ]
[13] Vanderelst, D. 2015. Social network analysis as a tool for research policy. PLoS Neglected Tropical Diseases, 9(12), pp. 3-5. doi:10.1371/journal.pntd.0004266. [ Links ]
[14] Chinchilla-Rodríguez, Z., Benavent-Perez, M., de Moya-Anegon, F. & Miguel, S. 2012. International collaboration in medical research in Latin America and the Caribbean (2003-2007). Journal of the American Society for Information Science and Technology, 63(11), pp. 2223-2238. doi:10.1002/asi.22669. [ Links ]
[15] McKelvey, M. & Rake, B. 2016. Product innovation success based on cancer research in the pharmaceutical industry: Co-publication networks and the effects of partners. Industry and Innovation, 23(5), pp. 383-406. doi: 10.1080/13662716.2016.1150157. [ Links ]
[16] Chimhundu. C,, de Jager, K. & Douglas, T. 2015. Sectoral collaboration networks for cardiovascular medical device development in South Africa. Scientometrics, 105(3), pp. 1721-1741. doi: 10.1007/s11192-015-1743-y. [ Links ]
[17] De Jager, K., Chimhundu, C., Saidi, T. & Douglas, T.S. 2017. The medical device development landscape in South Africa: Institutions, sectors and collaboration. South African Journal of Science, 113(5/6), #20160259. doi:10.17159/sajs.2017/20160259. [ Links ]
[18] Newman, M.E.J. 2004. Coauthorship networks and patterns of scientific collaboration. Proceedings of the National Academy of Sciences of the United States of America, 101 Suppl(1), pp. 5200-5205. doi:10.1073/pnas.0307545100. [ Links ]
[19] Eslami, H., Ebadi, A. & Schiffauerova, A. 2013. Effect of collaboration network structure on knowledge creation and technological performance: The case of biotechnology in Canada. Scientometrics, 97(1), pp. 99-119. doi:10.1007/s11192-013-1069-6. [ Links ]
[20] Cowan, R. & Jonard, N. 2003. The dynamics of collective invention. Journal of Economic Behavior & Organization, 52(4), pp. 513-532. doi:10.1016/S0167-2681(03)00091-X. [ Links ]
[21] Funk, R.J. 2014. Making the most of where you are: Geography, networks, and innovation in organizations. Academy of Management Journal, 57(1), pp. 193-222. doi:10.5465/amj.2012.0585. [ Links ]
[22] Watts, D.J. & Strogatz, S.H. 1998. Collective dynamics of 'small-world' networks. Nature, 393(6684), pp. 440-442. doi:10.1038/30918. [ Links ]
[23] Acedo, F.J., Barroso, C., Casanueva, C. & Galan, J.L. 2006. Co-authorship in management and organizational studies: An empirical and network analysis. Journal of Management Studies, 43(5), pp. 957983. doi:10.1111/j.1467-6486.2006.00625.x. [ Links ]
[24] Glänzel, W. & Schubert, A. 2005. Analysing scientific networks through co-authorship. In: Moed, H.F., Glänzel, W. & Schmoch, U., editors. Handbook of Quantitative Science and Technology Research. Dordrecht: Springer Netherlands, pp. 257-276. [ Links ]
[25] Barabasi, A.L., Jeong, H., Neda, Z., Ravasz, E., Schubert, A. & Vicsek, T. 2002. Evolution of the social network of scientific collaborations. Physica A: Statistical Mechanics and its Applications, 311(3), pp. 590614. doi: 10.1016/S0378-4371 (02)00736-7. [ Links ]
[26] Boccaletti, S., Latora, V., Moreno, Y., Chavez, M. & Hwang, D. 2006. Complex networks: Structure and dynamics. Physics Reports, 424(4-5), pp. 175-308. doi:10.1016/j.physrep.2005.10.009. [ Links ]
[27] Amblard, F., Casteigts, A., Flocchini, P., Quattrociocchi, W. & Santoro, N. 2011. On the temporal analysis of scientific network evolution. In: 2011 International Conference on Computational Aspects of Social Networks (CASoN). IEEE, pp. 169-174. [ Links ]
[28] Dorogovtsev, S.N. & Mendes, J.F.F. 2000. Scaling behaviour of developing and decaying networks. Europhysics Letters (EPL), 52(1), pp. 33-39. doi:10.1209/epl/i2000-00400-0. [ Links ]
[29] Barabasi, A.L. & Albert, R. 1999. Emergence of scaling in random networks. Science, 286(5439), pp. 509512. doi: 10.1126/science.286.5439.509. [ Links ]
[30] Moody, J. 2004. The structure of a social science collaboration network: Disciplinary cohesion from 1963 to 1999. American Sociological Review, 69(2), pp. 213-238. doi:10.1177/000312240406900204. [ Links ]
[31] Fleming, L., King, C. & Juda, A.I. 2007. Small worlds and regional innovation. Organization Science, 18(6), pp. 938-954. doi:10.1287/orsc.1070.0289. [ Links ]
[32] He, J. & Hosein Fallah, M. 2009. Is inventor network structure a predictor of cluster evolution? Technological Forecasting and Social Change, 76(1), pp. 91-106. doi:10.1016/j.techfore.2008.03.020. [ Links ]
[33] Schutjens, V. & Stam E. 2003. The evolution and nature of young firm networks: A longitudinal perspective. Small Business Economics, 21(2), pp. 115-134. doi:10.1023/A:1025093611364. [ Links ]
[34] WHO. 2010. Medical devices: Managing the mismatch: An outcome of the priority medical devices project. Geneva: World Health Organization. [ Links ]
[35] Borgatti, S.P., Everett, M.G. & Freeman, L.C. 2002. UCINET 6 for Windows: Software for social network analysis. Harvard: Analytic Technologies. [ Links ]
[36] Borgatti, S.P. 2002. NetDraw Software for network visualization. Lexington: Analytic Technologies. [ Links ]
[37] De Prato, G. & Nepelski, D. 2014. Global technological collaboration network: Network analysis of international co-inventions. The Journal of Technology Transfer, 39(3), pp. 358-375. doi:10.1007/s10961-012-9285-4. [ Links ]
[38] Hanneman, R.A. & Riddle, M. 2005. Introduction to social network methods. Riverside: University of California. [ Links ]
[39] Freeman, L.C. 1978. Centrality in social networks conceptual clarification. Social Networks, 1 (3), pp. 215239. doi: 10.1016/0378-8733(78)90021 -7. [ Links ]
[40] Rodriguez Miramontes, J. & Gonzalez-Brambila, C.N. 2016. The effects of external collaboration on research output in engineering. Scientometrics, 109(2), pp. 661-665. doi:10.1007/s11192-016-2054-7. [ Links ]
[41] Landherr, A., Friedl, B. & Heidemann, J. 2010. A critical review of centrality measures in social networks. Business & Information Systems Engineering, 2(6), pp. 371-385. doi:10.1007/s12599-010-0127-3. [ Links ]
[42] Valente, T.W., Coronges, K., Lakon, C. & Costenbader, E. 2008. How correlated are network centrality measures? Connections, 28(1), pp. 16-26. [ Links ]
[43] Opsahl, T., Agneessens, F. & Skvoretz, J. 2010. Node centrality in weighted networks: Generalizing degree and shortest paths. Social Networks, 32(3), pp. 245-251. doi:10.1016/j.socnet.2010.03.006. [ Links ]
[44] Okamoto, K., Chen, W. & Li, X.Y. 2008. Ranking of closeness centrality for large-scale social networks. In: Preparata, F.P., Wu, X. & Yin, J., editors. Frontiers in algorithmics. Vol. 5059 of lecture notes in computer science. Berlin, Heidelberg: Springer, pp 186-195. [ Links ]
[45] Wehmuth, K. & Ziviani, A. 2013. DACCER: Distributed assessment of the closeness centrality ranking in complex networks. Computer Networks, 57(13), pp. 2536-2548. doi:10.1016/j.comnet.2013.05.001. [ Links ]
[46] Opsahl, T. 2010. Closeness centrality in networks with disconnected components. https://toreopsahl.com/2010/03/20/closeness-centrality-in-networks-with-disconnected-components/ [accessed 20 April 2017]. [ Links ]
[47] Abbasi, A., Altmann, J. & Hossain, L. 2011. Identifying the effects of co-authorship networks on the performance of scholars: A correlation and regression analysis of performance measures and social network analysis measures. Journal of Informetrics, 5(4), pp. 594-607. doi: 10.1016/j.joi.2011.05.007. [ Links ]
[48] Abbasi, A., Hossain, L. & Leydesdorff, L. 2012. Betweenness centrality as a driver of preferential attachment in the evolution of research collaboration networks. Journal of Informetrics, 6(3), pp. 403412. doi:10.1016/j.joi.2012.01.002. [ Links ]
[49] Baum, J.A.C., Shipilov, A.V. & Rowley, T.J. 2003. Where do small worlds come from? Industrial and Corporate Change, 12(4), pp. 697-725. doi:10.1093/icc/12.4.697. [ Links ]
[50] Watts, D.J. 1999. Networks, dynamics, and the small world phenomenon. American Journal of Sociology, 105(2), pp. 493-527. doi:10.1086/210318. [ Links ]
[51] Davis, G.F., Yoo, M. & Baker, W.E. 2003. The small world of the American corporate elite, 1982-2001. Strategic Organization, 1(3), pp. 301-326. doi:10.1177/14761270030013002. [ Links ]
[52] Kogut, B. & Walker, G. 2001. The small world of Germany and the durability of national networks. American Sociological Review, 66(3), pp. 317-335. [ Links ]
[53] Guerrero Bote, V.P., Olmeda-Gomez, C. & de Moya-Anegon, F. 2013. Quantifying the benefits of international scientific collaboration. Journal of the American Society for Information Science and Technology, 64(2), pp. 392-404. doi:10.1002/asi.22754. [ Links ]
[54] Gazni, A., Sugimoto, C.R. & Didegah, F. 2012. Mapping world scientific collaboration: Authors, institutions, and countries. Journal of the American Society for Information Science and Technology, 63(2), pp. 323-335. doi:10.1002/asi.21688. [ Links ]
[55] Owen-Smith, J. & Powell, W.W. 2004. Knowledge networks as channels and conduits: The effects of spillovers in the Boston biotechnology community. Organization Science, 15(1), pp. 5-21. doi: 10.1287/orsc. 1030.0054. [ Links ]
[56] Montoya, J.M. & Sole, R.V. 2002. Small world patterns in food webs. Journal of Theoretical Biology. 214(3), pp. 405-412. doi:10.1006/jtbi.2001.2460. [ Links ]
[57] Laudel, G. 2002. What do we measure by co-authorships? Research Evaluation, 11(1), pp. 3-15. doi:10.3152/147154402781776961. [ Links ]
Submitted by authors 20 Apr 2018
Accepted for publication 3 Jul 2019
Available online 30 Aug 2019
* Corresponding author: tania.douglas@uct.ac.za
Appendix

