


Services on Demand
Article
 English (pdf)
 Article in xml format
 Article references
Indicators

Related links
-
 Cited by Google
 -
 Similars in Google
Share

 Permalink
South African Journal of Industrial Engineering
On-line version ISSN 2224-7890
Print version ISSN 1012-277X
S. Afr. J. Ind. Eng. vol.30 n.1 Pretoria May. 2019
http://dx.doi.org/10.7166/30-1-2086
CASE STUDIES
Effect of scope readiness on capital projects in mining: a Namibian case study
T.S. Kagogo; H. Steyn*
Department of Engineering and Technology Management, University of Pretoria, South Africa
ABSTRACT
Although project scope definition is regarded as a key element in successful project management, research on the subject is sparse. This paper investigates the relationship between project scope readiness and project performance in the Namibian mining industry. A survey was done on ten projects from seven Namibian mining companies, using the project definition readiness index (PDRI) tool as a scope definition indicator, while cost and schedule performance were used as performance indicators. Support was found for the proposition that readiness of project scope definition improves schedule performance, but the relationship between the PDRI score and cost performance was less conclusive.
OPSOMMING
Alhoewel die bestek-beskrywing van 'n projek algemeen beskou word as 'n sleutelelement in die suksesvolle bestuur van 'n projek, is baie min navorsing hieroor gedoen. Hierdie artikel ondersoek die verwantskap tussen die gereedheid van bestek-beskrywings en die sukses van projekte in die Namibiese mynbou-industrie. 'n Opname is gedoen op tien projekte in sewe Namibiese mynbou maatskappye. Die Projek Definisie Gereedheid Indeks (PDRI) instrument is gebruik as aanwyser van die gereedheid van die bestekdefinisie, terwyl kosteprestasie en skedule-prestasie as aanduiding van projeksukses gebruik is. Ondersteuning is gevind vir die stelling dat die gereedheid van 'n projek se bestekomskrywing skedule-prestasie bevorder, maar die verwantskap tussen PDRI telling en kosteprestasie was minder oortuigend.
1 INTRODUCTION
The Namibian mining industry is a major contributor to the national economy and, according to the Chamber of Mines of Namibia 2016 annual report [1], the industry made a direct contribution of 11.1 per cent to the GDP, which is a 4.9 per cent reduction from 2015. Mining companies are constantly engaged in capital projects in an effort to increase productivity, efficiency, safety and, ultimately, return on investment. In 2016 a N$2.2 billion-dollar project of the SS Nujoma vessel for Debmarine Namibia was completed. In addition to the SS Nujoma vessel, a number of operations, 'Navachab gold mine, Swakop Uranium, and B2Gold Otjikoto mine' are in the phase of acquiring new equipment, which is an exercise with a capital budget in excess of N$ 1 billion. Due to low commodity prices (especially of uranium), fixed investment in the industry has decreased from N$5.48 billion in 2015 to N$3.46 billion in 2016 [1]. With capital projects playing a big role in the success of mining operations and, ultimately, their contribution to the economy, the success of the projects is of paramount importance to the survival of the Namibian mining industry.
According to Padalkar and Gopinath [2], who investigated the evolution of the different themes in project management research, the scope management theme ranked last, in terms of both influence and article counts. Although they reviewed 189 articles, none of them covered scope management as a research theme; thus a clear gap exists in the project scope management literature. They indicated that the knowledge areas of risk, success, time, and performance are rated high, which is an indication of comprehensive research done on these themes. However, the importance of scope management is emphasised by Jergeas [3], who interviewed 87 project professionals and identified incomplete scope definition as a major contributor to project failure. Also, according to the results of the Pulse of The Profession survey [4], scope control was identified as one of the top drivers of project success; and scope control starts with scope definition and scope readiness. This paper contributes to research in project scope management by investigating the impact of scope readiness on mining projects. The objective of the study was to understand the extent to which scope readiness impacts the project performance of capital projects in Namibian mining.
2 THEORY REVIEW
2.1 The project definition rating index
According to Dumont, Gibson and Fish [5], the project definition readiness index (PDRI) can be described as a weighted checklist of scope definition elements that allow the user to measure and manage scope definition throughout the project. The PDRI was developed by a research team constituted by the Construction Industry Institute (CII) to meet the need for an easy-to-use tool that can quantify the level of project scope definition. The PDRI tool is flexible enough to be tailored to different kinds of projects. A number of PDRI tools are available, with the most commonly used ones being the PDRI for industrial projects and the one for construction projects.
The benefits of a PDRI tool [6] are that it provides:
• A complete checklist that gives guidance on the steps to follow during a scope definition process.
• Standardised scope definition terminology within the industry.
• An industry standard for rating the level of scope readiness, which assists in making decisions on project elements such as risk, budget, and schedule.
• A monitoring tool to track project progress.
• Assistance with communication between owner and contractors by identifying poorly defined scope elements.
• A common base for project evaluation.
• A benchmarking tool to evaluate project performance against project scope definition.
The PDRI tool is applied by giving a score to the weighted elements of the different scope categories and sections. The score is then totalled to give an indication of the project definition. The maximum score on the tools is 1000, and the lowest achievable score is zero. The latter value means that not all the categories are applicable. The categories that are not applicable to the specific project are scored zero, so they do not have an impact on the index score. A low PDRI score is an indication of a well-defined project scope, while a higher score indicates a poorly defined scope.
Dumont, Gibson and Fish [5] state that the PDRI can be easily integrated into the Project Management Institute's scope management process of initiation, planning, definition, verification, and change control. The PDRI can help improve the effectiveness of the scope management process on the project.
Scope management and PDRI assist with the following [5]:
• Initiation: helps in developing overall project requirements, helping stakeholders to understand scope definition, and developing the baseline for the current project. All of the elements can lead to a healthy project charter.
• Planning: the PDRI can assist in identifying areas of concern that can help with risk planning. The different categories can form part of the work breakdown structure, and can be used as a base for project costing and scheduling.
• Definition: provides a structured approach to scope definition, which ensures that no important scope elements are omitted; this helps to achieve a well-defined scope.
• Verification: analysis of the score facilitates the scope verification process, as any score with which the team is not satisfied can be verified with the inputs and changed.
• Change control: a well-defined scope in terms of PDRI can assist in easily identifying the implication of a scope change.
A PDRI score was applied to give an indication of the scope readiness of the projects to be surveyed. The rationale for applying the PDRI for scope readiness was to have an unbiased standardised basis of comparison for all the projects. This will give a fair reflection of the scope readiness of all the projects. Two main PDRI tools exist: the PDRI for building projects and the PDRI for industrial projects. The PDRI for building projects is more suited to infrastructure projects, and was applied by Banda and Pretorius [7] in quantifying the scope readiness of infrastructure projects in Malawi.
The PDRI tool for industrial projects has been applied in this study due to the nature of mining capital projects. The PDRI for industrial projects was more aligned to the type of mining capital projects explored by Fessehaie [8] on the South African and Zambian mining industries. To assess the scope readiness of each project, an assessment was done by rating each element of the PDRI tool. Each element was rated with a score between 0 and 5; where the element was not applicable it was rated with a score of 0. A rating of 1 represents a complete scope definition, and 5 an incomplete scope definition. As mentioned earlier, the lower the PDRI score, the more complete the scope definition. A cut-off score of 200 or higher is an indicator of an incomplete scope definition.
Recent work by Banda and Pretorius [7] on the impact of scope readiness on infrastructure projects in Malawi showed a correlation between scope readiness and project performance. Their work showed a correlation coefficient (r) of 0.81, with a p value of 0.008 at a confidence level of 95 per cent between the scope readiness indicator PDRI score and the project cost performance. A correlation was also found between scope readiness and schedule performance. A correlation between mining capital projects in Namibia and the results of Banda and Pretorius [7] was explored.
2.2 Performance indicators
A number of indicators can be applied to assess project performance; but their application is dependent on the nature of the project. Mirza and Pourzolfaghar [9] identified project success factors such as time, cost, quality, scope, and stakeholder satisfaction as key project performance indicators. The research applied cost, time, and scope as project performance indicators.
According to Flyvbjerg [10], 90 per cent of megaprojects have cost overruns, and cost overruns of up to 50 per cent are not uncommon. Cost overruns are not unique to specific countries, as megaprojects from all over the world experience them. Deliverable shortfalls of up to 50 per cent occur frequently, as well as cost overruns.
Examples of megaprojects cost overruns [10]:
• Channel Tunnel - 80 per cent in real terms
• Denver International Airport - 200 per cent
• Boston's Big Dig - 220 per cent
• Sydney Opera House - 1 400 per cent
As applied by Banda and Pretorius [7], the schedule performance indicator was measured by presenting schedule overruns as a percentage of the planned schedule. Each project surveyed provided a planned schedule and an actual schedule to present the performance as a percentage.
The project cost performance indicator was measured by presenting cost overruns as a percentage of the planned cost. Each project surveyed provided a planned budget as well as the actual budget achieved to present the performance as a percentage [7].
The project completion performance indicator was measured by presenting a percentage completion (in terms of objectives) at the initially set completion date. Each project surveyed gave a percentage completion of the project at the initially-planned completion date [7].
2.3 Project scope changes
Hwang and Low [11] state that additions and deletions of any sort to the scope baseline are considered to be changes, irrespective of the impact on the cost, schedule, and deliverables. According to Khan [12], project management practitioners have realised that scope changes are part and parcel of the process, and a system should be designed to ensure that the impact of the change is as low as possible.
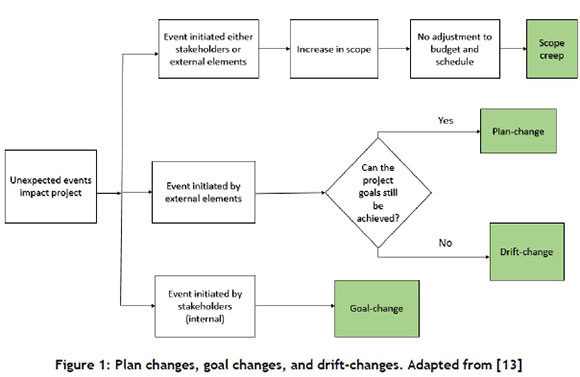
A number of factors can be a source of project change, and can be classified into internal and external factors, depending on where the change originates [11]. An exercise to identify the potential sources of scope change should be done in the project-planning phase and their potential risk included in the risk management process. Usher and Whitty [13] define 'drift changes' as changes that result from external factors and require a change in project goals. The external factors can be market change, new legislation, inclement weather, etc. Figure 1 shows the difference between goal-change, plan-change, and drift-change, as well as the impact on the stakeholders. It should be noted that external factors only cause drift-change if they result in a change to the project goal; if the project goal does not change, then it becomes a plan-change.
Corrective actions [13]:
• ' Fine-tuning' is the process of making minor changes in the project to ensure that project progress aligns with the initial plan and goal. No change to the project plan or goal occurs.
• ' Revision' is the process of re-evaluating and changing the project goal due to a major change in the project. The changes can be the re-assignment of resources within the project. The project plan changes, but the project goals stay intact.
• ' Re-opening' is a corrective action initiated by stakeholders who want the project goal to change; thus it addresses goal-change. It leads to a new definition of the scope, which leads to new project goals.
Scope creep
According to Hussain [14], scope creep can be defined as additions to the scope of the project without approval, and no changes to the cost, specifications, or schedule of the project are done to accommodate the change. Unauthorised project additions 'creep' into the project scope because of e-mailed and verbal instructions from people of authority, or because of written instructions given without evaluating the impact of the instruction. Scope creep has a negative impact on project cost and schedule, and a change management system should protect the project from scope creep.
Reasons for scope creep [15]:
• Inadequate requirements document, lack of clarity and depth.
• Direct contact between client and team member.
• Client's attempt to get extra requirements cheaply.
• Commencement of work before completion of analysis of requirements.
• Poorly defined initial requirements.
• Poor stakeholder analysis.
• Unrealistic promises to client.
Strategies to restrain scope creep [16, 17]:
• Have a well-defined scope statement that captures all the requirements of the different stakeholders.
• Have a change management system that ensures that all the changes are evaluated and approved.
• Acknowledge the need for a change, and propose another project to address it.
• Use phased planning: only plan in depth for the phase ahead, and leave room for changes to the overall project.
• Carry out a fast execution of the project, which leaves less room for change.
• Do proper planning of contingency resources (buffers).
3 RESEARCH METHODOLOGY
3.1 Research approach
The research method applied to address the research objective of exploring the relationship between scope readiness and project performance of mining capital projects was a mixed research method that included a survey and a qualitative method.
Survey method
The survey portion of the research included collecting and analysing data for the projects. The data was collected from the different mines in Namibia using a questionnaire, and was done using convenience sampling.
Qualitative research method
The qualitative approach was done for the case study portion of the research, where a more in-depth analysis was completed on one of the projects to obtain clearer insight into the research topic. The case study was done in the form of an interview with the different stakeholders of the chosen project, and by investigating the different project documents that were made available.
3.2 Data collection
The research data was collected using an informal interview for the case study and a fixed format questionnaire for the survey. A PDRI for industrial projects was used to assess the scope readiness.
Main data collected:
• PDRI score
• Initial planned and actual project budget
• Initial planned and actual project schedule
• Percentage completion
The data collected for the survey portion of the research was acquired from seven mining operations in Namibia on their recently-completed mining capital projects. A minimum of two projects from each mine were required, but the collected data was based on responses over which the researcher had no control. The case study involved informal interviews with more than one stakeholder from the chosen project, and an analysis of the different project documents made available.
3.3 Data analysis
Parametric analysis for correlation, using Pearson's correlation formula, was applied. The collected data was analysed with guidance from the approach applied by Banda and Pretorius [7] during a similar study on infrastructure projects in Malawi. A Pearson correlation formula was applied to give an indication of the degree of association between the two variables of PDRI score and performance indicator - that is, of the cost/schedule over/underrun and the project percentage completion.
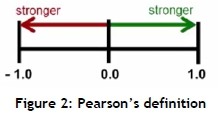
It should be noted that correlation does not indicate causation, but is merely an indicator of a relationship between two variables. A correlation coefficient (Pearson r) ranges between -1 and 1, with a positive correlation being indicated by an r value close to 1, while a negative correlation has a value close to -1, as shown in Figure 2. A Pearson r close to 0 indicates that there is no relationship between the two variables
4 RESULTS
4.1 Introduction
The data collection was based on three sources: (a) results from the filled-in questionnaires, (b) interviews, and (c) project documents for the case study interpretation. The data collection process was a challenging exercise, as not all mines were forthcoming in providing the required data; hence the small samples that were analysed.
The interviews and interactions with the different project managers gave an opportunity to gain a greater insight beyond the questionnaire answers for the selected projects. The results to be presented in the interview section are therefore based on the interpretation of the researcher during the different interactions with the project managers. The main aim of the interviews and interactions was to gain insight into planning practices across the different mines, and to do an informed comparison beyond the filled-in questionnaire.
The core analysis of the research is based on the data collected through the questionnaire. The aim of the questionnaire was to give an indication of the relationship between a PDRI score and the three chosen project performance indicators. The collected data has been presented in the form of scatter plots for visualisation purposes. The raw data was analysed using Pearson's correlation formula to get the correlation coefficient, which is an indicator of the degree of correlation between the PDRI score and the project performance indicators.
The case study is based on one project for which the researchers had access to data beyond the questionnaire and the interview interactions. The case study investigated four main areas: scope definition practices, PDRI categories, stakeholder engagement, and scope changes. One project was identified and was presented, based on the four areas discussed above, which are in line with the case study objectives.
4.2 Key findings from interviews
The findings from the interviews were based on conversations between the researchers and the different project managers, focusing on the PDRI tool and the project success factors. Of the 10 respondents, none currently applies the PDRI as a planning tool, since it is not commonly used in the Namibian mining industry. Two project managers indicated a slight knowledge of the PDRI tool, but only from a personal knowledge perspective. There was a common acknowledgement of the importance of the three PDRI sections, with most of the project managers pointing out that section 1 (basis of project decision) is vitally important in the early phases of the project as, when not completed well, it can destroy a potential project. Although all the different project managers have the common goal of delivering projects according to the initial project scope, they apply a different planning process that is mainly guided by the company's project management methodology.
Key findings on the PDRI and planning process:
• The PDRI tool is not a recognised tool in the planning process.
• PDRI tools are acknowledged to have potential areas of application.
• Section 1 of the PDRI tool is perceived to be the most important section of a project in the early phase.
• The execution phase of a project is deemed least important due to the level of uncertainty at the early stage of project planning. The execution scope is thus carried out with a 30 per cent accuracy.
Another key finding from the interviews - apart from the planning - is the definition of 'project success' by the different project managers. It is clear that project success is self-defined, and the three indicators chosen in the research, although good, are not necessarily ultimate indicators, as success can be both perceived and real; hence the variation from project to project. Four of the project managers indicated that the definition of project success for a specific project should be based on the stakeholder requirements and the degree to which those requirements were met; hence the importance of a stakeholder engagement workshop for each project before agreeing on scope.
4.3 Key findings from questionnaire data
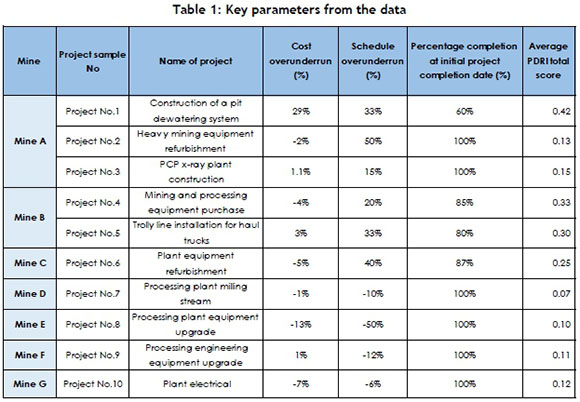
The data collection of the questionnaire was based on quantifying project scope readiness through the PDRI score and the project performance indicators. The research population was the Namibian mining industry (11 mines), but challenges experienced in acquiring the data meant that only seven mines replied. The sample therefore includes only 10 projects that were collected from the seven mines. Mine A was able to provide three projects, while Mine B provided two, with the rest of the mines providing one project each. Table 1 shows the data that was collected using the questionnaire; the cost/schedule over/underrun was calculated as a percentage variance between planned and actual. The PDRI score is the sum of the 64 elements, which were then divided by 1 000 for easier data presentation.
4.3.1 PDRI score vs cost over/underrun relationship
For the purpose of data visualisation and correlation observation, the general layout of the coordinates has been plotted using the scatter plot shown in Figure 3. The plot indicates whether a clear correlation exists, and acts as visual support of the outcomes of the correlation coefficient calculations.
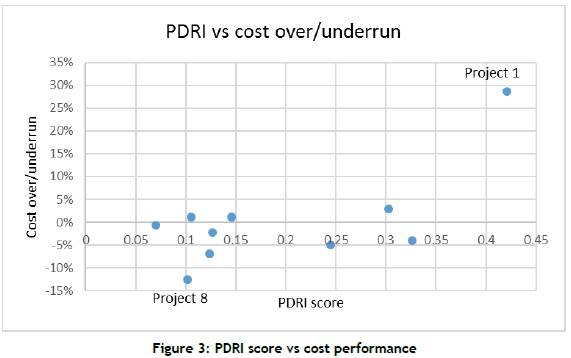
The scatter plot does not indicate a clear relationship between the PDRI score and the cost performance, with the exception of Projects 8 and 1. The other eight projects' cost performances are around the budget, irrespective of the PDRI score. The two projects that indicate a certain level of relationship are Project 8, with a low PDRI score of 0.1 and cost underrun of 13 per cent, while Project 1 has a PDRI score of 0.42 and cost overrun of 30 per cent.
A correlation coefficient of 0.64 has been calculated, which indicates a positive correlation between the PDRI score and cost performance of the projects investigated. No clear conclusion can be made about the relationship between cost performance and the PDRI score, as the data is inconclusive. It can be inferred that, with more data, a relationship could be present, considering the two projects that support it, and the calculated correlation coefficient.
4.3.2 PDRI score vs schedule over/underrun relationship
The scatter plot in Figure 4 illustrates the relationship between the PDRI score and schedule performance, with low PDRI scores associated with low schedule overruns, and three projects with underruns. Project 2 seems to stand out as an anomaly, as it has a low PDRI score but a 50 per cent overrun, which can be attributed to the project having a short total duration; hence any overruns in terms of months have a huge impact on the variance calculation. Four projects with a PDRI score below 0.15 all have a schedule underrun ranging from -13 per cent to -6 per cent, while four projects with a PDRI score above 0.2 have schedule overruns ranging from 20 per cent to 40 per cent.
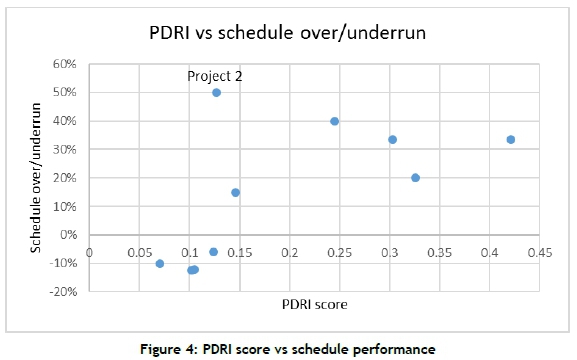
A correlation coefficient of 0.57 has been calculated, which indicates a positive correlation between the PDRI score and the schedule performance of the projects investigated. It can be said that - based on the data - a relationship does exist, although it cannot be conclusively stated due to the limited amount of data available.
4.3.3 PDRI score vs percentage completion relationship
Visual inspection of the scatter plot in Figure 5 shows a clear relationship between the PDRI score and completion performance, even though the amount of data is not sufficient to draw a definite conclusion. Five projects with a low PDRI score (below 0.15) all achieved 100 per cent completion, while the projects with a PDRI score above 0.2 did not achieve 100 per cent completion at initial completion date. A correlation coefficient of -0.95 has been calculated, which shows a strong negative relationship between the PDRI score and percentage completion, which supports the visual observation of the relationship in the scatter plot.
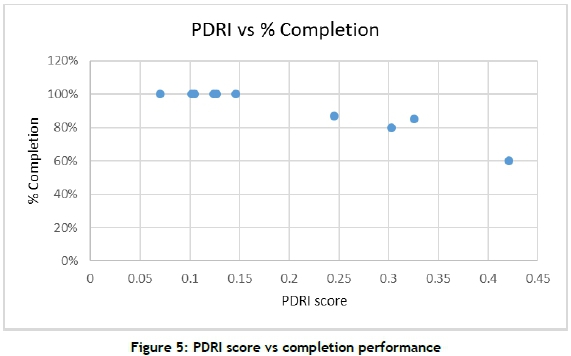
With a strongly negative correlation coefficient and relationship from the scatter plot, it can be concluded that (based on the projects investigated) the more clearly defined the project scope, the less likely the project is to fail to achieve 100 per cent completion in terms of deliverables at the initially planned completion date.
4.3.4 Case study
The project analysed in depth was chosen based on the data available. Only one project team was willing to participate in a more in-depth analysis. The project analysed is Project 3 from Mine A (in Table 1), which was the construction of an x-ray processing plant. The project had a PDRI score of 0.15, with 1.1 per cent cost overrun and 15 per cent schedule overrun, while it achieved 100 per cent completion.
Scope definition process applied
An internal mine procedure on scope definition was applied to define the scope of the project. Scope definition was done in consultation with the project sponsors, the external consultants, and the contractors. All the workshops aimed to cover different stakeholder requirements that needed to be addressed in the scope.
A feasibility study, procurement workshop, contractor workshop, sponsor and management workshop, and project team workshop formed the major components of the scope definition process.
Importance of PDRI categories
The project managers had no prior knowledge of the PDRI tools, and had to familiarise themselves with the different categories: basis of decision, front end, and execution. The two project managers believed that all the categories were vital and important, although they also believed that a special category on stakeholder engagement and requirements should be included, as that was the main driver in the project scope-definition process. From the data collected, all three categories had a PDRI score below 0.2 for the project. The project managers agreed that the execution phase did need to be defined in detail, as there were too many dynamic factors that could change the execution approach.
Impact of stakeholders on scope
The internal scope definition process was driven by the stakeholders, who had a huge impact on the project. The scope is mainly a compilation of stakeholder requirements and actions on how to meet them. The requirements were collected through different workshops and resultant trade-offs; the outcome was thus a compromise among the different stakeholders. The project was driven by the three main stakeholders - the project sponsors, the execution team, and the operation team. The sponsors had a major impact, as they were the source of the capital; the operation team had an influence on the design.
Scope changes
The project managers believed that scope changes in a mining project are inevitable due to the complex nature of the mining environment. The project experienced a 15 per cent scope change that was driven by production factors on the mine.
The mine has the following internal scope change process:
• Written scope change request
• Evaluation by project lead
• Sent out to affected stakeholders for approval
• Approval and implementation
The internal process can be tedious, depending on the number of stakeholders; but it works well, as it completes the loop between the execution team and the different stakeholders.
4.4 Relationship between mining capital and infrastructure projects
Visual inspection of Figure 6 shows that both research projects indicate a relationship between the PDRI score and cost performance, with a low PDRI score having a better cost performance, while the high PDRI score has the worst cost performance. The correlation coefficient calculated for both research projects validates the visual inspection relationship. The Namibian projects indicate a correlation coefficient of 0.64, and the Malawian projects a coefficient of 0.81. Both coefficients indicate a positive correlation, with the Malawian infrastructure showing a stronger correlation. The mining projects have a less visible relationship than infrastructure projects, which could be due to the complex nature of mining projects; thus factors other than scope readiness play a role in the delivery of projects. Dynamic mining factors, such as safety and production pressures, also influence project performance.
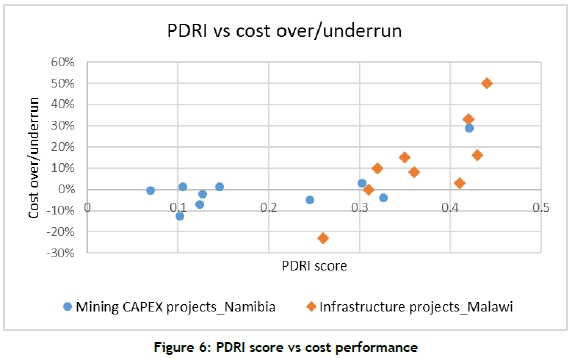
Figure 7 illustrates the relationship between PDRI score and schedule performance for both the Namibian and the Malawian projects. Apart from the outliers, a visual inspection indicates a clear relationship between scope definition and schedule performance. The projects in Malawi have a correlation coefficient of 0.63, and the Namibian projects 0.57. Both correlations indicate a positive relationship, which is also evident from visual inspection of the scatter plot.
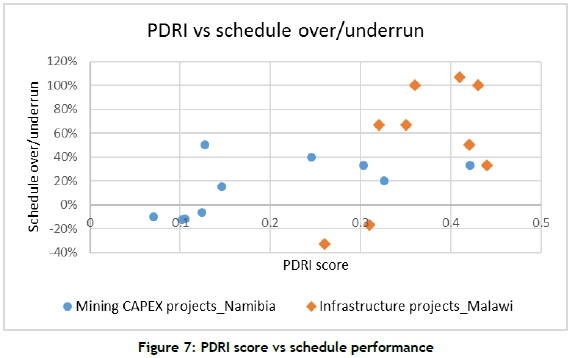
A positive correlation can be interpreted to mean that the better the project scope is defined, the higher the chances that the project will perform well in terms of schedule, for both projects in Namibia and Malawi. The Malawian projects have a stronger correlation than the mining projects in Namibia. This can be attributed to the complex nature of the mining environment, which brings in other dynamic factors such as production pressures, safety, and a pronounced influence from different stakeholders.
The outcomes of the two research projects validate each other: they both reach the same conclusion for the initial objectives of investigating the relationship between scope definition and project performance. The same relationship was observed for the two investigations, even though they were based in two different countries with different industries and stakeholders. The cost and schedule relationship showed a stronger correlation in the infrastructure projects, which can be attributed to the complex nature of mining projects. The outcomes have the potential to be generalised, but will need more validation with a bigger project sample; both the Namibian and the Malawian research had challenges with their projects sample sizes.
5 CONCLUSIONS AND RECOMMENDATIONS
The study was aimed at investigating the relationship between scope readiness and project performance in the Namibian mining industry. The key objective was to determine whether project scope definition has an impact on the key project performance measures of cost, schedule, and percentage completion. The relationship was investigated only for mining projects that consisted mainly of mining and processing projects. The study had challenges with the sample numbers, as only 10 projects were analysed.
The information gathered from the interviews shows that the PDRI tool is not applied in the Namibian mining industry, although some managers did acknowledge the importance of such a tool. Most mines apply internal tools in defining their project scope, and the internal tools are often tailored to meet the needs of the company. Project success is regarded as self-defined, with stakeholder requirements being a fundamental element of the project success definition. Scatter plots and Pearson's correlation formula were applied to analyse the results, which gave an indication of the different relationships observed. No conclusive relationship could be observed between the PDRI score and cost performance, except for two projects. The data, however, showed a relationship between the PDRI score and percentage completion, as well as schedule performance. Our proposition that the better defined the project scope, the better the performance in terms of percentage completion and schedule performance, has been supported by the data.
The case study showed that the PDRI categories are important, but that the project managers believe they need to address stakeholder requirements as a category on its own. The project applied an internal scope definition process that was driven by stakeholder workshops that addressed the different stakeholder requirements. The project experienced a scope change of 15 per cent, which was addressed through a scope change process that involved stakeholder approval.
The Namibian mining and Malawian infrastructure sectors showed a correlation of the project success factors against the PDRI score, with the Malawian projects showing a stronger correlation for cost and schedule performance. The weaker correlation of the mining projects, relative to the infrastructure projects, could be due to the complex nature of the mining environment and the dynamic factors that affect project performance.
The study recommends further research in the following areas:
• Similar research with a larger sample, with the current study forming the basis. This would allow validation of the current findings.
• Research into the different factors that drive project complexity in mining projects, and their impact on project performance.
• Research focusing on the application of in-house procedures in scope definition.
• Investigating the strength and weakness of different scope definition procedures for different mining companies.
REFERENCES
[1] Chamber of Mines of Namibia. 2016. Chamber of Mines of Namibia Annual Review. Windhoek. [ Links ]
[2] Padalkar, M. & Gopinath, S. 2016. Six decades of project management research: Thematic trends and future opportunities. International Journal of Project Management, 34(7), pp. 1305-1321. [ Links ]
[3] Jergeas, G. 2008. Analysis of the front-end loading of Alberta mega oil sands projects. Project Management Journal, 39(4), pp. 95-104. [ Links ]
[4] Pulse of The Profession. 2018. Success in disruptive times. Project Management Institute. [ Links ]
[5] Dumont, P.R.M.A., Gibson, G.E.M.A. & Fish, J.R. 1997. Scope management using project definition rating index. Journal of Management in Engineering. 13(5), pp 54-60. [ Links ]
[6] Cho, C.S. & Gibson, G.E. Building project scope definition using project definition rating index. Journal of Architectural Engineering, 7(4), pp 115-125. [ Links ]
[7] Banda, R.K. Pretorius, L. The effect of scope definition on infrastructure projects: A case in Malawi's public and private implementing agencies. South African Journal of Industrial Engineering, 27(4), pp. 203214. [ Links ]
[8] Fessehaie, J. 2015. Regional industrialisation research project: Case study on the mining capital equipment value chain in South Africa and Zambia. Available from [Accessed 27 May 2019]: https://static1.squarespace.com/static/52246331e4b0a46e5f1b8ce5/t/559bdbcbe4b0b28022672d50/1436277707121/CCRED+Working+Paper+1_2015_Capital+equipment+Fessehaie.pdf [ Links ]
[9] Mirza, M.N., Pourzolfaghar, Z. & Shahnazari, M. 2013. Significance of scope in project success. Procedia Technology, 9, pp. 722-729. [ Links ]
[10] Flyvbjerg, B. 2014. What you should know about megaprojects and why: An overview. Project Management Journal, 45(2), pp. 6-19. [ Links ]
[11] Hwang, B.G. & Low, L.K. 2012. Construction project change management in Singapore: Status, importance and impact. International Journal of Project Management, 30(7), pp. 817-826. [ Links ]
[12] Khan, A. 2006. Project scope management. Cost Engineering, 48(6), pp. 12-16. [ Links ]
[13] Usher, G. & Whitty, S.J. 2017. Identifying and managing drift-changes. International Journal of Project Management, 35(4), pp. 586-603. [ Links ]
[14] Hussain, O.A. 2012. Direct cost of scope creep in governmental construction projects in Qatar. Global Journal of Management and Business Research, 12(14). [ Links ]
[15] PMI. 2017. Top five causes of scope creep [cited 2017 02 April]; Available from: https://www.pmi.org/learning/library/top-five-causes-scope-creep-6675. [ Links ]
[16] Steyn, H. (ed.). 2016. Project management: A multi-disciplinary approach. : FPM Publishing.Pretoria [ Links ]
[17] Nicholas, J.M. Steyn, H. 2008. Project management for Business, Engineering, and Technology. Oxford: Butterworth-Heinemann. [ Links ]
Submitted by authors 12 Nov 2018
Accepted for publication 3 Apr 2019
Available online 29 /May 2019
* Corresponding author. herman.steyn@up.ac.za
# The author was enrolled for an MEng. (Project Management) degree in the Department of Engineering and Technology Management, University of Pretoria, South Africa

