Servicios Personalizados
Articulo
Indicadores
Links relacionados
-
 Citado por Google
 -
 Similares en Google
Compartir
South African Journal of Industrial Engineering
versión On-line ISSN 2224-7890
versión impresa ISSN 1012-277X
S. Afr. J. Ind. Eng. vol.30 no.1 Pretoria may. 2019
http://dx.doi.org/10.7166/30-1-1909
CASE STUDIES
Improving the response time for the corrective maintenance of rail infrastructure: a case study of the Western Cape Passenger Rail Network
A. du Toit; J.L. Jooste*; P.D.F. Conradie
Department of Industrial Engineering, Stellenbosch University, South Africa
ABSTRACT
Response time for repairing rail infrastructure failures remains a challenge in the South African rail industry. The 'mean time to return' metric consists of mean time to respond and mean time to repair. This article investigates the mean time to respond for signalling infrastructure at the Passenger Rail Agency of South Africa (PRASA) in the Western Cape, and introduces a strategy to reduce downtime. The results show that the time of occurrence, the location, and the nature of incidents, as well as the location of maintenance personnel, influence the time to respond. A model is developed to assist with improved decision-making.
OPSOMMING
Reageertyd vir die herstel van onvoorsiene falings bly 'n realiteit in die Suid-Afrikaanse spoorwegindustrie. Die 'gemiddelde tyd tot terugkeer' meting bestaan uit die gemiddelde tyd om te reageer en die gemiddelde tyd om te herstel. Hierdie artikel ondersoek die gemiddelde tyd om te reageer vir sinjaalinfrastruktuur by die Passasierspooragentskap van Suid-Afrika (PRASA) in die Wes-Kaap, en stel 'n reaksiestrategie voor om staantyd te verminder. Die resultate toon dat die tyd van voorkoms, die ligging en die aard van voorvalle, asook die ligging van instandhoudingspersoneel, die tyd om te reageer beïnvloed. 'n Model is ontwikkel om te help met verbeterde besluitneming.
1 INTRODUCTION
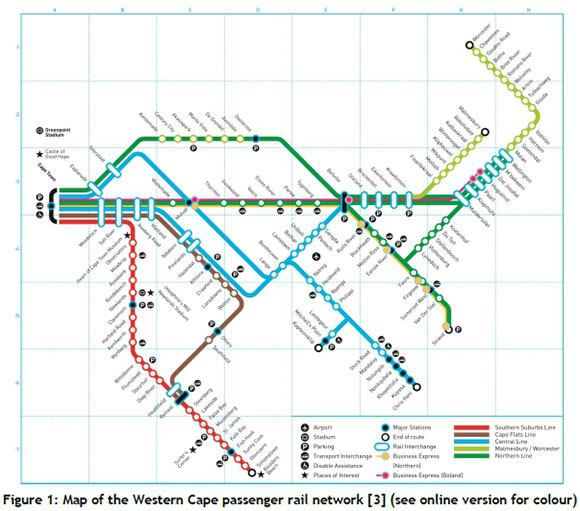
In 2013, the TomTom global traffic index revealed that Cape Town was the most congested city in South Africa, ranked 55th globally [1]. Travelling by train alleviates traffic congestion. Railway transport therefore plays a significant role in the lives of the working class, who must commute to work in and around the Cape Town city centre from surrounding suburbs, as illustrated by the rail network in Figure 1. However, train delays may result in the journey taking longer than by road, even during peak hours. Transport by train is one of the most cost-effective modes of transport in the Western Cape. Consequently, it is vital for poor communities that require effective public transport to gain access to better opportunities [2].
Currently, the Operations Division of the Passenger Rail Agency of South Africa (PRASA) is hampered by a decline in performance due to ageing rolling stock and obsolete technology, compounded by the time required to upgrade infrastructure. The open nature of the system also makes it susceptible to vandalism, theft, and operational incidents. The scarcity of spare parts and equipment due to the age of the system exacerbates the performance challenges. Consequently, there are increased levels of community unrest and dissatisfaction with the slow speed of service delivery [4].
Currently, about 10 per cent of peak-hour trains in the Western Cape rail network are cancelled, resulting in the loss of 2.6 million seats per month. The average train delay by the end of the third quarter of 2016/17 had reached 21 minutes. Infrastructure failure has been responsible for about one-third of these delays [4].
In the rail environment, effective operation is not possible without proper rail maintenance. Rail organisations apply various tactics to minimise the downtime of their rail infrastructure. The two main maintenance strategies employed are preventive maintenance and corrective maintenance. Corrective maintenance is typically in the form of minimal repair actions to bring the failed system back to its operational state as soon as possible. By contrast, preventive maintenance focuses on reducing the possibility of unexpected failures [5]. When performing corrective maintenance on rail infrastructure, the system, or some of its parts, are usually non-operational [6]. System downtime can cause passengers inconvenience; thus response time is of the essence.
PRASA manages four types of infrastructure: permanent-way, electrical, telecommunications, and signalling. The response procedure for each infrastructure type differs. However, signalling infrastructure has the greatest impact on train delays because its failure is detrimental to the safety of passengers [2]. In the absence of signals, trains are manually authorised, causing the system to perform below capacity, and increasing the likelihood of an accident.
Due to budget limitations, it will take years for the railway network to reach a state in which corrective maintenance becomes a rarity. Considering the current state of the railway network, unexpected failures are inevitable. To manage the current situation more effectively, a new corrective maintenance response strategy is required. The aim of the research presented in this paper is to improve the response time for the corrective maintenance of rail signalling infrastructure.
One of PRASA's key performance indicators (KPIs) is minimising the number of maintenance jobs taking longer than the target mean time to return [7]. The mean time to return is the time it takes to return failed infrastructure to its functional state from the moment the infrastructure failure is reported. The mean time to return can be divided into two components: the mean time to repair and the mean time to respond. The mean time to repair is the time that technicians spend repairing the infrastructure system. The mean time to respond is the time it takes the assigned maintenance team to respond and travel to the location of the failed infrastructure [7].
Currently, maintenance workers work in teams on a certain infrastructure type. They are assigned to work in predetermined sections of the railway network. When an incident is detected, the Metro Technical Servers are informed, and the apparently most appropriate maintenance team is assigned to the job. This assignment depends on the severity and nature of the incident and the location of the incident. Usually a maintenance team with the appropriate skill set that is working in or near the section where the incident occurred will be assigned to the incident [8]. Although this approach may seem logical, it becomes difficult to respond effectively when the predetermined sections become outdated and the maintenance workers are no longer situated in optimal locations.
2 LITERATURE REVIEW
There are many elements to be considered when making maintenance decisions, such as management, operations, logistics support, and the technology involved [9]. One of the important underlining factors, however, is the cost of maintenance. In most scenarios, corrective maintenance is the most expensive method of maintenance, due to high spare parts inventory costs, overtime labour costs, machine downtime, and low production availability [10]. Nonetheless, corrective maintenance remains a reality, especially in PRASA's context, where vandalism and theft are a regular occurrence, together with the wear of ageing equipment.
Rail organisations have limited resources, and therefore the most critical failures need to be managed first, at a reasonable cost, while optimising system availability [11]. Maintenance planning is fundamental to improving maintenance efficiency. Implementing proper planning and scheduling procedures can double an organisation's ability to perform maintenance work [12].
The mean time to respond, which is the focus of this study, is put in context by O'Connor, O'Connor and Kleyner [13], who quantify corrective maintenance by the mean time to repair (MTTR) measure. Figure 2 illustrates a time line of the MTTR, by demonstrating the activities that occur during a typical repair job. The MTTR consists of responding to the failure and repairing the failure. The mean time to respond consists of identifying the right skilled person for the job, travelling requirements, job briefing, obtaining tools, and testing equipment [13]. The duration of the response is often longer than that of the actual repair of a failure, thus emphasising the importance of this study.
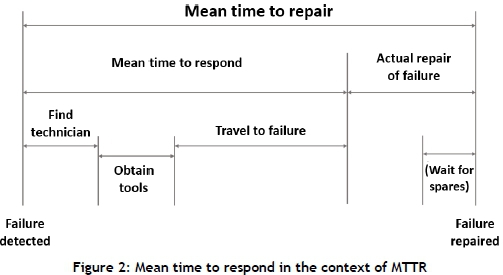
The optional 'wait for spares' time shown in Figure 2 is an example of time spent waiting once the job has already started. This causes the system to be left unavailable for an even longer period [13]. Effective planning can reduce the occurrence of these types of delays.
The literature about response strategies for corrective maintenance in the rail industry is sparse. However, there are other fields in which similar response strategies apply. These include emergency traffic response, first-aid response, and fire and rescue response. A brief overview of the characteristics of these response strategies is presented; these characteristics inform the improvements of response time in the rail environment presented in the latter sections of the paper.
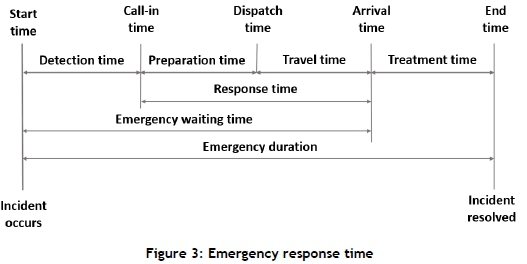
Emergency response time is illustrated in Figure 3, and consists of four phases: detection time, preparation time, travel time, and treatment time [14].
According to Zhu et al. [15], most incident response strategies proposed in the literature can be classified into dispatching and patrolling systems. For a free-way service patrol programme, the key questions are: how to divide a traffic network into dependent patrol segments, and how to assign response units to them [15]. It has been argued that it might be more efficient to deploy response units strategically, and dispatch them after an incident has been detected. However, this system is more suited to areas where surveillance and incident detection are available. The key question for such strategies is how to deploy and dispatch available response units to minimise the response time [15].
Repede and Bernardo [16] designed a model to solve the maximum expected coverage location problem with time variation. The model makes use of integrating a simulation into a decision support system. The procedure provides emergency medical service planners with a tool that estimates service levels and allows the reallocation of a changing active fleet size to respond to variable demand and to maximise service levels [16].
When real-time traffic information is available, it is desirable to provide route guidance to avoid congested areas when travelling to an incident. Naturally, sending the nearest available vehicle to the emergency is preferred. However, the system becomes loaded when the number of incidents requiring attention grows with a limited number of vehicles available. This makes it necessary to prioritise. Vehicles already sent to an emergency can be redirected to another [14].
Another challenge when designing and deploying incident management systems is the stochastic nature of incidents. In practice, two incidents may happen concurrently, and the response unit at the nearest depot location may not be available [15]. Therefore a back-up strategy must be provided, and the associated cost must be implemented in the system design. This can be done by including the opportunity cost related to the loss of coverage when a response team is unavailable [15].
The variance in incident rates provides another kind of uncertainty. Many existing models, which are based on historical data and are designed to minimise response time as an objective, perform well most of the time, but can occasionally generate excessively long response times. In practice, traffic management agencies may constrain the total response time for worst cases to an acceptable range, but then the mean time to respond will sustain a slight increase [15].
Yang et al. [14] explain that gaps in the service area will be created when emergency response vehicles leave their post to respond to an incident. This can best be resolved by adjusting the placement of the available vehicles in the system, or by displacing another vehicle to take the previous vehicle's post [14].
Kim et al. [17] presents an integer programming model for optimising the deployment locations of emergency response units. The objective is to minimise the total delay time rather than the response time. The model also places more weight on locations that have a higher probability of severe incidents occurring, and it accounts for the variance in incident duration.
These response strategies have many similar characteristics to those involved in the response to corrective maintenance for a railway network. Repairing failures on the rail also involves travelling to remote locations, and having to travel on routes that may be heavily congested by traffic, especially during peak service hours. Corrective maintenance may not be as urgent as a medical response, but it still requires immediate attention to prevent consequential interruptions to service delivery.
The maintenance of rail systems consumes substantial budgets, is complicated to organise, and poses several challenges for planning and preparation. The Western Cape rail network, like others, is divided into different sections to manage the railway network. Each section is assigned to a depot for maintenance [18].
There are usually several different lines in a track section, and track maintenance activities may cause the entire section to be unavailable due to the size of the maintenance equipment. Preventive maintenance activities can be scheduled during the intervals between train operations to reduce the effect on the system's operation [18]. This is not always an option in the case of corrective maintenance. Equipment and maintenance teams must often be transported to remote locations to perform maintenance. Some of these transportation activities must be done on the infrastructure itself, and so may also reduce system availability [18].
The railway network is a typical deteriorating system, with components ranging from perfect functioning to complete failure. Generally, railway tracks do not fail suddenly, but deteriorate over time, with the track only scheduled for maintenance when it becomes a priority [18].
According to Lidén [19], the coordination of maintenance with train traffic operations is challenging and of crucial importance. Corrective maintenance normally disrupts scheduled preventive maintenance due to its urgency. Scheduled preventive maintenance often needs to be rescheduled after the occurrence of corrective maintenance.
Different depots are responsible for the maintenance of different regions in the rail network. Thus the location of the failure determines who is responsible for maintaining it. A maintenance team working in that region will immediately be contacted to repair the failure if it is urgent. However, the maintenance team first requires secure access to the railway infrastructure in the form of a work order [19].
A substantial proportion of reported failures of electronic and signalling systems are not confirmed when inspected. These occurrences are referred to as 'no fault found' (NFF). The proportion of reported failures that result in NFFs can be as high as 50 to 80 per cent [13]. This results in excessive costs in relation to warranty, spares, travel, support, and test facilities. Effective management of the design in relation to in-service tests, diagnosis, and repair operations can assist to minimise NFF rates. Stress screening of repaired items can also decrease the proportion of NFFs [13].
In the case of an NFF, the tacit knowledge of the maintainer is relied on to assess the probable cause of the intermittent failure. Due to the nature of the rail industry (i.e., the high cost of delaying trains), the maintainer usually decides not to investigate the issue further. In these circumstances, the component is left to operate until the fault re-occurs, or some form of preventive maintenance is performed [20].
3 CURRENT STATE ANALYSIS
Interviews with planning personal from PRASA's Western Cape region, and secondary data provided by PRASA, form the basis of the current state analysis of maintenance team response times.
Maintenance teams are distributed throughout the Western Cape rail network. Each team is assigned to a predetermined section and is scheduled to perform preventive maintenance work in that section [8]. The teams usually travel by road in service vehicles, starting from their designated depots [2].
When a critical failure is detected, the Metro Technical Servers contact the relevant depot, which then contacts a team to repair the failure as soon as possible. If a failure is not critical, the planner is informed; the planner then determines the priority of the failure and schedules a repair. Higher priority maintenance will be scheduled first [2]. Incident severity is determined by a standard based on the safety risk and the effect on service [8]. When an incident requiring immediate corrective maintenance occurs, a team is contacted by phone and requested to respond to the incident. The team typically postpone their scheduled maintenance work, which is rescheduled, and travel to the more critical incident. Usually, a team working near or within the section in which the incident occurred will be called to respond. Preventive maintenance is scheduled with the knowledge that the schedule can be disrupted by corrective maintenance; thus the schedule does provide for corrective maintenance contingencies [8].
There are maintenance teams on a standby schedule for after-hour incidents. Safety is a key consideration in maintenance decision-making. Scheduled maintenance is only done during the daytime for the safety of maintenance personnel [2]. Incidents of anti-social behaviour can put the lives of employees and passengers at risk, may damage equipment, and may cause infrastructure to become non-operational. For this reason, PRASA contracts security to help minimise the risk. Maintenance personnel may request a security force escort whenever they feel unsafe in performing their duties. This influences the time it takes to respond, since the maintenance technician typically waits for the security force at the depot [8].
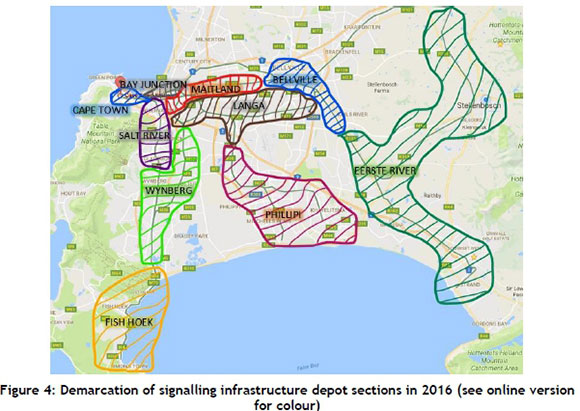
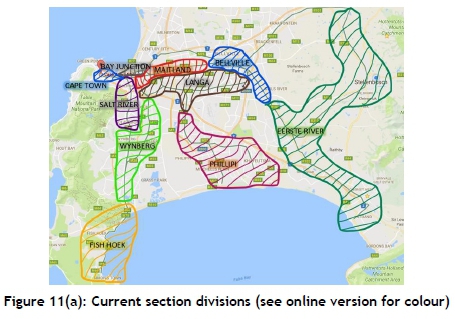
To assign maintenance responsibility for signalling infrastructure, PRASA's Western Cape rail network is divided into the ten sections illustrated in Figure 4. In the past, these sections were determined through rigorous planning, but current data and response time inefficiencies suggest that these sections are no longer optimal and may be outdated [8]. Maintenance personnel are assigned to each section. However, the Bay Junction, Phillipi, and Fish Hoek sections are currently vacant with no personnel assigned to these areas. At Bay Junction and Fish Hoek, there used to be maintenance teams, but due to skills that have been lost and not replaced, these sections are vacant. Maintenance teams from adjacent sections currently perform maintenance in these sections. The Phillipi depot was closed and demolished in about 2002. As a result, the Phillipi teams were moved to the Langa depot, but still perform maintenance in the Phillipi section [8]. Skills shortages in railway maintenance further exacerbate the current understaffing of sections [21]. The effectiveness of incident responses for each of the different sections is further investigated in the next section.
3.1 Data analysis
Through investigating PRASA's signalling incident data, it was found that the mean time to respond (refer to Figure 2) contributes to more than 30 per cent of the total outage time of the average incident. Therefore improving the mean time to respond would decrease the total outage time.
In this section, failure and response time data from 2015 and 2016 is analysed for the different signalling sections. The analysis considers the number of incidents reported, the number of vandalism incidents, the mean time to respond, train delays, and time and seasonality trends.
3.1.1 Number of incidents
The percentage of incidents per section for 2015 and 2016 is displayed in Figure 5. It is evident that the number of incidents that occurred in both 2015 and 2016 was highest in the Langa section, followed by Maitland and Phillipi. These sections are in socio-economically poor regions that are known for anti-social activities, such as theft and vandalism [2].
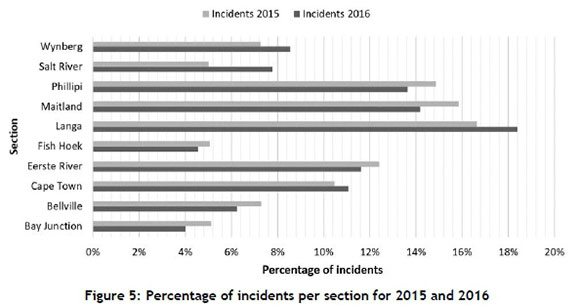
Many incidents occur in the Eerste River section, mostly because of its relative size compared with the other sections. Although the Cape Town section is geographically small, as the central terminal of the network it carries heavy traffic, and so also reports many incidents [21]. Salt River has the fewest incidents for 2015, and Bay Junction has the fewest for 2016. Both sections cover small areas, and are relatively secure and less affected by anti-social behaviour [21].
3.1.2 Number of vandalism incidents
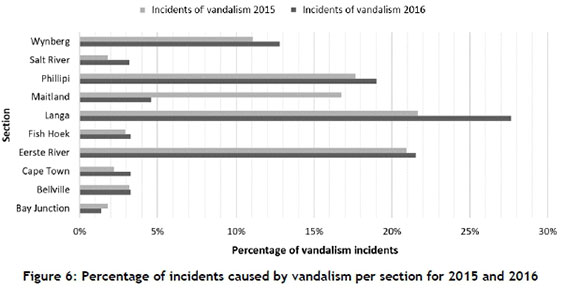
The number of incidents due to vandalism is compared across the sections in Figure 6. The sections that experience the most vandalism are, in decreasing order: Langa, Eerste River, and Phillipi. It is evident from the comparison between Figures 5 and 6 that the sections with more incidents of vandalism generally also have significantly more incidents overall. This emphasises the adverse effect of acts of vandalism on the availability of signalling infrastructure.
3.1.3 Mean time to respond
The mean time to respond as a percentage per station for 2016 is depicted in Figure 7. Sections such as Phillipi, Langa, and Fish Hoek have the worst mean times to respond. Further investigation with PRASA personnel revealed that this is due to bad road conditions and the dangers related to gangsterism in the areas of Phillipi and Langa. Access to the railway is difficult, and in most cases armed security forces are required to accompany maintenance teams [21]. Fish Hoek is located at the far south end of the railway network. The effect of not having a maintenance team stationed in the Fish Hoek section is evident from the excessive mean time to respond. Roads in this section do not have a high traffic capacity, which makes this section especially prone to traffic delays that affect the response times.
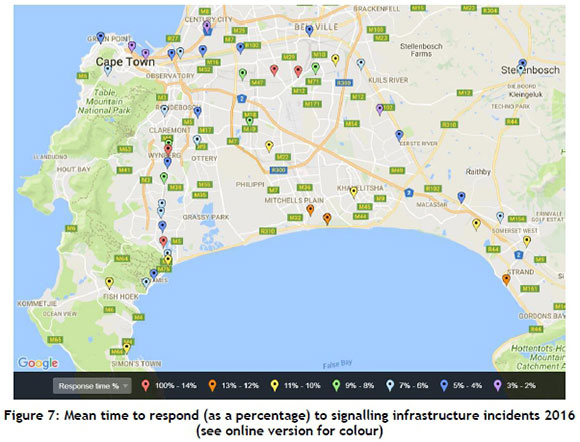
The Cape Town section has the best mean time to respond. Being the central terminal of the rail network, the best skilled maintenance personnel are currently stationed in this section. The geographical size of the section further allows maintenance teams to walk from one job to the next, and so the responses are not affected as much as in other sections [8, 21].
3.1.4 Number of train delays
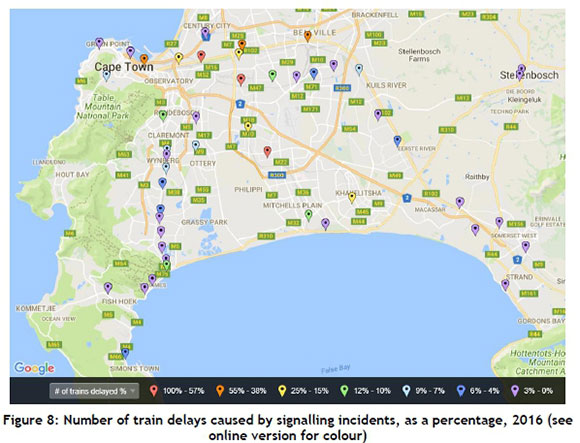
Figure 8 illustrates the number of train delays caused by signalling infrastructure incidents, as a percentage. It is evident that the central, busy sections of the network, such as the Cape Town and Maitland sections, usually experience a higher frequency of delays. Sections with a high frequency of vandalism incidents, such as Langa and Phillipi, experience delays of longer durations. These types of incident normally take longer to repair due to the level of damage to the signalling infrastructure.
The data was further analysed to determine whether seasonal or time trends are present. The analysis suggested that responses usually take longer during peak traffic hours because of increased traffic congestion. However, no seasonality was found in the response times.
3.1.5 Conclusion: Data analysis
Based on the results from the data analysis and on validation from PRASA [21], the type of fault determines the duration of the repair, while the time of the day during which the incident occurs has an impact on the number of trains it will delay and the time to respond to the incident. The locality of the incident determines how close resources are, and the nature of the incident determines which workers can respond to the incident. The technical skills of the workers repairing the incident also influence the repair time, while the size of the section influences the response time. It is evident that each section has different characteristics, and that some sections perform better than others. Factors directly influencing the response time are the size of the section, the number of maintenance teams assigned to the section, the performance of the maintenance teams, and the safety of the area.
Because of the dated layout of the current section boundaries and the performance variance across the sections, a decision support model is developed to assist PRASA with new section layouts and the positioning of maintenance teams to allow for faster incident response.
4 IMPROVED FUTURE STATE
The developed decision support model provides for decision-making based on the latest historical data trends that PRASA collects about signalling infrastructure. It gives the user the ability to view the entire rail network, and provides a summary of the critical areas, based on recent data that the user can update as new data becomes available.
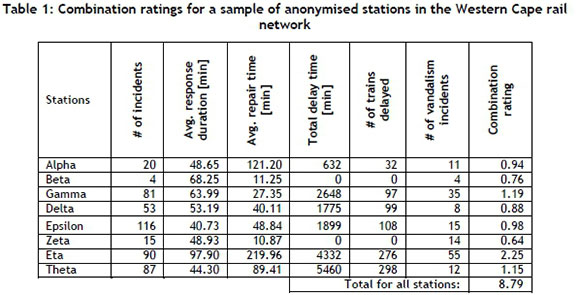
The model is Microsoft Excel-based, and makes use of pivot tables and macros to summarise incident data and to determine a weighted combination rating for each station. The combination rating is a weighted rating based on the number of incident occurrences, the mean time to respond to an incident, the average repair duration, the total time delay for trains, the number of train delays, and the number of vandalism incidents. These factors were established with PRASA as the most important factors influencing incident response strategies. Each factor is normalised relative to the maximum value of that factor, weighted and summated with the other factors. Table 1 illustrates the combination ratings for a sample of anonymised stations based on 2015 and 2016 incident data, where equal weights are assumed. In this case, the maximum theoretical combination rating can be six and the least zero.
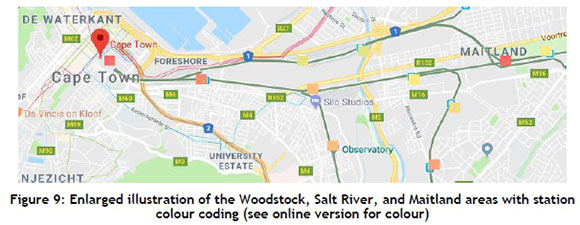
The model provides a user interface that consists of a map of the rail network that is covered by a grid. Each station is represented by a cell on the grid that corresponds with the station's location on the map. The objective of the model is to allow a user to re-divide the rail network into new sections based on the historical incident data, and to give the user an overview of the performance of the corrective maintenance of signalling infrastructure across the network. The combination rating of each station is associated with its location on the network map. Stations' locations are colour coded according to a green-to-yellow-to-red spectrum that is indicative of its combination rating. Red indicates critically important stations based on past corrective maintenance history, and green stations indicate low ratings. If a station does not appear in the data it has a combination rating of zero, and so it remains colourless. Figure 9 is an enlarged area of the model's rail network with the colour coding for the station locations being shown.
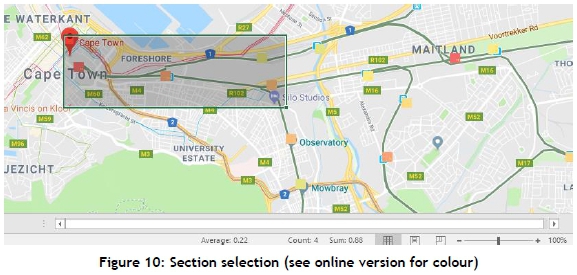
To establish new sections using the model, the user specifies the number of sections required in accordance with maintenance resource availability. Based on the required number of sections and combination ratings for all stations across the network, an equal combination rating for sections can be determined. For example, in Table 1 the total combination rating for the sample is 8.79. If PRASA plans to continue with the current ten sections, the model shows that each section should aim to include stations with a total combination rating of 0.879. New sections are determined by selecting areas on the map interface that contain stations that can be logically grouped together, as illustrated in Figure 10. As soon as the total combination rating for the selected section is approximately equal to the section rating calculated (0.879), the new section has been established. For the highlighted section shown in Figure 10, the total selected section rating is 0.88, as seen in the status bar. It follows that sections with a high density of higher rated stations will result in the sections being smaller because of the higher resource requirement. Consequently, sections with a higher density of lower rated stations will tend to be larger geographical areas.
Maintenance workers should be positioned throughout the network in such a way that sufficient resources are always available to respond to an incident within every section. Using this model should result in maintenance teams being within a closer range to most incidents, leading to a shorter travelling distance and thus to a faster response time. The model must be updated regularly with new data to see whether changes in the sections need to be made.
The model assumes that all the maintenance workers are trained and capable of repairing any part of the system, and that the data collected is of good quality. Furthermore, it is assumed that future incidents will follow a similar pattern to that of incidents in the past, and that the user is well-informed about the maintenance procedures used at PRASA and has a good understanding of the network beyond the model.
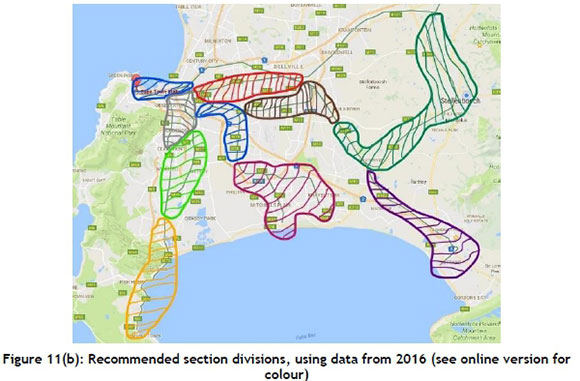
With the input from PRASA, the model was used for the re-sectioning of the current sections of the entire Western Cape rail network. Presented in Figures 11(a) and 11(b) is the comparison between the existing section classifications and the results of the re-sectioning based on the model's results with incident data from 2016. Comparing the existing section classifications with the model's recommended sections, the major changes are that the Eerste River section should be divided into two sections, and that the Cape Town and Bay Junction sections should be merged. Minor changes can also be seen where some stations, based on their incident data, have been reclassified to other sections.
5 CONCLUSION AND RECOMMENDATIONS
Having trains that are consistently on time will increase the quality of customer service and, therefore, the quality of life, especially for those who commute daily. This will result in more people using the trains, thus increasing funds and providing the railway network with the means to improve further.
The decision support model developed in this project has the potential to improve not only response times for incidents, but also the ability of managers to see where problems are occurring and to assist them to identify the root cause of a problem sooner. This could assist in reducing train delays, which currently have an adverse effect on service delivery. The model may also contribute to informing security where and when there have been occurrences of vandalism throughout the network, so that these areas can be made more secure. This could potentially decrease the number of vandalism incidents. Although the model is developed for signals, it can easily be adapted for use in the other three types of infrastructure.
A current limitation of the model is that it needs to be supported by other decision-making considerations, such as the train operation schedule, the availability of resources, and the training of maintenance technicians to benefit the overall rail system.
Opportunities for future improvement are to implement the new sections with allocated maintenance personnel, to measure the effectiveness of the model, based on reclassifying the sections as annual incident data becomes available, and to compare it with the response times of previously classified sections.
REFERENCES
[1] City of Cape Town. 2017. Cape Town Municipal Spatial Development Framework. URL: http://resource.capetown.gov.za/documentcentre/Documents/City%20strategies%2C%20plans%20and%20frameworks/HYS_Draft_Municpal_Spatial_Development_Framework%202017%20-%202022.pdf. Accessed: 11/12/2017. [ Links ]
[2] Cupido, J. 2017. Rail infrastructure failure data. Interview, 13/06/2017. [ Links ]
[3] Metrorail. 2007. Metrorail. URL: http://www.metrorail.co.za/maps/CT_RailMap.pdf. Accessed: 29/03/2017. [ Links ]
[4] PRASA. 2016. Corporate plan mtef 2017-2020. Passenger Rail Agency Of South Africa. Pretoria, South Africa. [ Links ]
[5] Xia, T., Xi, L., Pan, E., Fang, X. and Gebraeel, N. 2017. Lease-oriented opportunistic maintenance for multi-unit leased systems under product-service paradigm. Journal of Manufacturing Science and Engineering, 139(7):071005. [ Links ]
[6] Raouf, A., Duffuaa, S., Ben-Daya, M., Pongpech, J., Murthy, D. and Boondiskulchock, R. 2006. Maintenance strategies for used equipment under lease. Journal of Quality in Maintenance Engineering, 12(1):52-67. [ Links ]
[7] Van Zyl, G., Ackermann, L., Fourie, K. and Dreyer, C. 2012. Motor Coach National Training Manual: Train Driver. PRASA. Pretoria, South Africa. [ Links ]
[8] Davids, S. 2017. Signal infrastructure maintenance. Interview, 15/08/2017. [ Links ]
[9] Kobbacy, K.A.H. and Murthy, D.P. 2008. Complex system maintenance handbook. Springer Science & Business Media. London, UK. [ Links ]
[10] Mobley, R.K. 2002. An introduction to predictive maintenance. Butterworth-Heinemann. USA. [ Links ]
[11] Moore, D. 2017. Interview. April, Cape Town. [ Links ]
[12] Palmer, R.D. 1999. Maintenance planning and scheduling handbook. McGraw-Hill Professional Publishing, USA. [ Links ]
[13] O'Connor, P.D., O'Connor, P., and Kleyner, A. 2012. Practical reliability engineering. John Wiley & Sons. Chichester, UK. [ Links ]
[14] Yang, S., Hamedi, M. and Haghani, A. 2005. Online dispatching and routing model for emergency vehicles with area coverage constraints. Transportation Research Record: Journal of the Transportation Research Board, (1923):1-8. [ Links ]
[15] Zhu, S., Kim, W., Chang, G. and Rochon, S. 2014. Design and evaluation of operational strategies for deploying emergency response teams: Dispatching or patrolling. Journal of Transportation Engineering, 140(6):04014021. [ Links ]
[16] Repede, J.F. and Bernardo, J.J. 1994. Developing and validating a decision support system for locating emergency medical vehicles in Louisville, Kentucky. European Journal of Operational Research, 75(3):567-581. [ Links ]
[17] Kim,H., Kim, W., Chang, G.L. and Rochon, S. 2014. Design of emergency response system to minimize incident impacts: Case study for Maryland District 7 network. Transportation Research Record: Journal of the Transportation Research Board, (2470):65-77. [ Links ]
[18] Zhang, T., Andrews, J. and Wang, R. 2013. Optimal scheduling of track maintenance on a railway network. Quality and Reliability Engineering International, 29(2):285-297. [ Links ]
[19] Lidén, T. 2015. Railway infrastructure maintenance - A survey of planning problems and conducted research. Transportation Research Procedia, 10:574-583. [ Links ]
[20] Lewis, R. and Roberts, C. 2010. Using non-monotonic reasoning to manage uncertainty in railway asset diagnostics. Expert Systems with Applications, 37(5):3616-3623. [ Links ]
[21] Ward, E. 2017. Resource allocation and validation of Excel model. Interview. 15/09/2017. [ Links ]
Submitted by authors 26Jan 2018
Accepted for publication 26 Feb 2019
Available online 29 May 2019
* Corresponding author wyhan@sun.ac.za
# The author was enrolled for a B.Eng (Industrial) degree in the Department of Industrial Engineering, Stellenbosch University, South Africa


