Servicios Personalizados
Articulo
 Inglés (pdf)
 Articulo en XML
 Referencias del artículo
Indicadores

Links relacionados
-
 Citado por Google
 -
 Similares en Google
Compartir

 Permalink
South African Journal of Industrial Engineering
versión On-line ISSN 2224-7890
versión impresa ISSN 1012-277X
S. Afr. J. Ind. Eng. vol.30 no.1 Pretoria may. 2019
http://dx.doi.org/10.7166/30-1-1988
CASE STUDIES
A framework for lean readiness evaluation using a hierarchical fuzzy system
S.M. BaskaranI, *; A.R. LakshmananII
IDepartment of Mechanical Engineering, AMET University, Chennai-603112, India
IIDepartment of Mechanical Engineering, PSG College of Technology, Coimbatore-641004, India
ABSTRACT
Lean manufacturing is becoming the frontrunner in solving manufacturing-related problems. To sustain the lean journey, assessing lean readiness is the appropriate way to implement it in any industry. In this research, lean readiness is evaluated in a case study industry using a framework model. It consists of two dimensions: the critical success factors, and the barriers. Using force field analysis, the conflicting nature of these dimensions was portrayed. With the help of fuzzy logic, a hierarchical fuzzy system was developed to evaluate lean readiness. The result of this method opens up a new direction for managers to identify lean readiness.
OPSOMMING
Lenige vervaardiging is die voorloper om vervaardiging verwante uitdagings aan te spreek. Dit is egter belangrik vir volhoubaarheid om die gereedheid om van lenige vervaardiging gebruik te maak, te bepaal. Lenige gereedheid word deur middel van 'n gevallestudie beoordeel met die gebruik van 'n raamwerk model. Dit bestaan uit twee dimensies, naamlik die kritiese suksesfaktore en die hindernisse. Die teenstrydige aard van hierdie twee faktore is uitgebeeld deur kragveldanalise. Met die hulp van die wasigheidsleer is 'n wasige hiërargiese stelsel ontwikkel om lenige gereedheid te evalueer. Die resultaat van hierdie metode skep n nuwe metode vir bestuurders om lenige gereedheid te identifiseer.
1 INTRODUCTION
The term 'lean' is defined as a system that takes less input to create the same outputs as those of a traditional mass production system, while contributing more varieties for the customer [1]. Lean is a method and philosophy of eliminating waste [2]. Lean brings the cultural transformation that the entire business world embraces to make it lean for the sake of survival. Lean manufacturing is a paradigm meant to create more for the customers with fewer resources. Voss [3] pointed out that lean manufacturing has been accepted by many industries for improving their businesses. There is a growing interest in implementing lean among firms [4]. The firms that implement lean manufacturing aim to eliminate waste or non-value-adding activities, and to reduce lead times without compromising higher quality and customer satisfaction. According to Womack and Jones [5], any business activity that does not create value is considered wasteful; so it must be identified and eliminated.
Lean assessment helps to develop a gap analysis to find the places needing improvement and to map the overall success in lean transformation. To determine the relative score of each lean activity, a questionnaire was prepared with the aid of the literature to explain the quantitative measures of organisational leanness [5]. Many quantitative lean metrics were employed in the analysis of multiple aspects of lean manufacturing. However, the quantitative lean metrics that can be quantified are limited to some aspects of lean manufacturing performance [6].
The organisation of this paper is as follows: Following this introduction, the literature reviews on lean readiness and its factors are discussed. Then change management and force field analysis and the lean framework are addressed. A survey on fuzzy logic is followed by the membership functions of input and output variables. The data collection, results, and conclusion about lean readiness are also explained.
2 LITERATURE REVIEW
Lean readiness is all about getting started with lean practices in any industry. The readiness of an organisation for change depends mainly on handling conflicting ideas. Whenever a conflict of interest occurs between two or more people in the decision-making process, then bringing in changes is put at risk. The people in the industry, the stakeholders, are often involved in decision-making. Personal differences in their views can have a greater impact on the activities intended to bring improvement. So it is appropriate to resolve the conflicting views before taking any decisions on change management.
It is change that management looks for when it adopts lean practices. Hayes [7] discussed the requirement of proper planning before implementing changes such as lean six sigma. For management, handling conflicts becomes a tedious task. While getting ready, there are factors that support it and there are factors that oppose it. Finding them in the first place heads us in the right direction towards the change. For successful lean implementation, discovering the organisation's readiness for lean is the first step on a lean journey. The significance of drivers and barriers in implementing lean was assessed by Salonitis and Tsinopoulos [8] in Greek manufacturing industries. A framework model was developed by Al-Najem et al. [9] to evaluate the lean readiness and lean systems of Kuwait-based small and medium scale industries. A study was conducted empirically by Shokri, Waring & Nabhani[10] to find the effects of people's competence and organisational culture on the readiness for lean six sigma projects in small & medium sized enterprises(SMEs). From the reviews, it was found that not many papers contributed towards lean readiness. By grasping this opportunity, this paper offers a framework for evaluating the lean readiness of an organisation.
2.1 Critical success factors
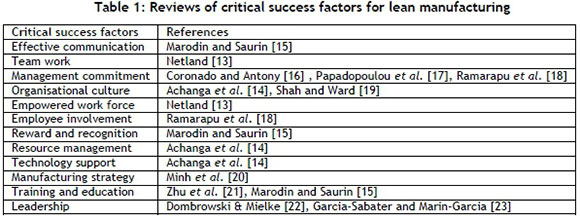
Critical success factors (CSFs) are key to the success of any organisation. CSFs are vital to any business activity that promotes change. Twenty-one CSFs were identified for bringing modularisation to engineering procurement and the construction industry [11]. In spite of several attempts at lean implementation, many firms failed to succeed in lean practices [12]. To overcome costly failures in implementing lean, many researchers and consultants recommended several CSFs. Netland [13] proposed twenty-two CSFs from 14 structured reviews, and investigated the effect of contingency variables on the success factors of lean implementation. From studies of the literature, the three most important CSFs are management commitment and involvement, training and education, and employee participation and empowerment. Achanga et al. [14] suggested some of the CSFs: leadership, management, finance, organisational culture, skills, and expertise. The CSFs for lean manufacturing proposed by several researchers can be seen in Table 1.
2.2 Barriers
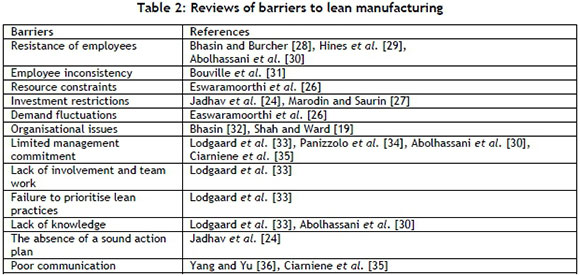
Barriers are obstacles to growth and change. Barriers are the reason for low lean adoption by many firms. Twelve barriers to just-in-time (JIT) production implementation were identified and analysed by Jadhav, Mantha & Rane[24] using the interpretive structural modelling approach. Likewise, successful lean practices are driven by the CSFs, and challenged by several barriers. These barriers hamper CSFs to an extent when CSFs are not taken seriously by management. Barriers are the opposite of those CSFs for lean implementation [25]. Some of the barriers to lean, as acknowledged by Easwaramoorthi et al. [26], are lower volume of demand, frequent design changes, not addressing the needs in the machine tool industry, relying on purchased items, and difficulty handling the machine tool components. The factors concerning the CSFs and the barriers to organisational change are case-specific - i.e., they are unique to each implementation of lean [27]. The reviews of barriers are shown in Table 2.
3 CHANGE MANAGEMENT
According to Burnes [37], change is an ever-present feature of an organisation's existence at strategic and operational levels. Organisational change is the result of its strategic management. The successful management of change is necessary for an organisation's survival [38]. There is no consensus on a framework for change management. Lean manufacturing is a continuous improvement process of implementation, bringing never-ending change to an organisation. An industry should overcome any divergence among its people to move towards a new manufacturing paradigm. Before getting ready for a change such as lean manufacturing on a large scale, it should be discussed to find any differences of opinion among the stakeholders through brainstorming. In this research, using a brainstorming session, the details of lean readiness were discussed and recorded with the help of 10 experts. Five were from manager level, and the other five were from engineer level. All of them were part of the case study industry, with vast knowledge on lean implementation through their previous experience and training. This kind of session was very helpful in identifying the factors affecting readiness. Readiness for change is often affected by conflicting views. The force field analysis was used to document and analyse the factors affecting lean readiness.
3.1 Force field analysis
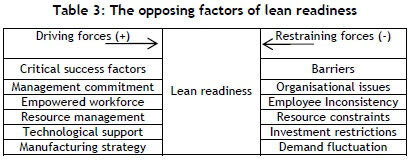
Force field analysis was developed by Kurt Lewin in 1951 to represent mathematically the factors influencing social situations. The factors are the forces that can both drive and obstruct changes in any organisation. It is a technique adopted worldwide for planning and implementing change to understand the forces that affect it. Swanson and Creed [39] explained the significance of this tool and its relevance to modern management. In this work, the force field analysis was carried out between the critical success factors for and barriers to lean manufacturing. The CSFs are considered the driving forces, and the barriers are the restraining forces. The sub-factors of the CSFs and the barriers (listed in Table 3) were identified during the brainstorming session with the experts. These sub-factors of opposing forces can affect the change towards lean readiness. Knowing the state of these factors can help in identifying lean readiness. In this work, to overcome the subjectivity of qualitative data, a hierarchical fuzzy system was proposed to evaluate lean readiness. The opposing forces of lean readiness are shown in Table 3.
4 LEAN READINESS FRAMEWORK
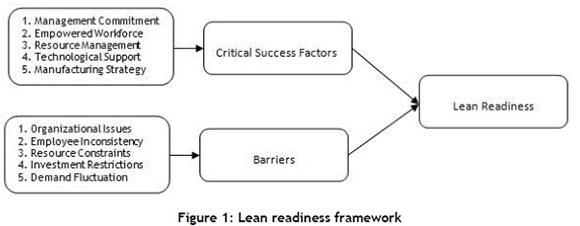
A framework model is used to show how to implement a new strategy in a hierarchical way. Change management is all about bringing about transformation from the existing system of practice. To find lean readiness in this work, a framework was developed from the concept of change management, which identifies the opposing factors of the CSFs and barriers, as shown in Figure 1. It consists of three stages. The first stage is the sub-factors of the critical success factors and the barriers. The five sub-factors of the CSFs and the barriers are the driving forces and restraining forces towards lean readiness respectively. The second stage is the CSFs and the barriers. The third and final stage reveals the lean readiness of an industry. The path to lean readiness lies in finding the weightings of the sub-factors and the factors of the first and the second stage respectively. This helps to decide whether or not a firm is ready to implement lean.
Mathematical model
Mathematically, this framework can be represented as:

Lean readiness in the mathematical model is the function of the ten variables that make up the sub-factors of the CSFs and the barriers.
Input and output factors
Lean readiness is the final result of this framework, and is considered as an output factor, depending on two factors: the critical success factors, and the barriers. Lean readiness = f(critical success factors, barriers)
The critical success factors in the second stage are the function of the five input sub-factors in the first stage.

Similarly,
The barriers in the second stage are the function of the five input sub-factors in the first stage.

From the above equations, the CSFs and the barriers were identified. Then these values were given to equation (1) to evaluate the lean readiness of an industry.
The details of the selected sub-factors of the CSFs and the barriers to lean manufacturing are given below.
Management commitment (x1) is the dedication of the management to bringing about change. The change that the management seeks is lean implementation. It is the most critical factor in implementing lean successfully. If management is greatly involved in development activities such as lean, then changes within the industry can easily be achieved.
An empowered work force (x2) is an asset in any organisation. This leads to self-governance and positive growth towards the success of any activities. The empowered workforce is the result of well-trained professionals who become experts in their field. They can contribute much to the growth of an organisation.
Resource management (x3) is the method of managing various resources effectively and efficiently. The resources include finance, equipment, materials, people, and time. It gives the organisation a clear direction towards change.
Technology support (x4) is the aid of new technology in doing the required task. With the support of technology, management can reduce the lead time and cost, and improve the quality of the product.
Manufacturing strategy (x5) is the method of doing the task in manufacturing a product. If it follows a highly successful manufacturing paradigm, then it can achieve good results.
These five sub-factors are inputs to the critical success factors; they are essential factors for lean implementation. The sub-factors of the barriers are detailed below.
Organisational issues (x6) are the obstacles relating to management. If there are issues such as financial problems, strikes, mismanagement, etc., then the industry cannot undertake any change initiatives. The commitment to such change must then be seriously questioned.
Employee inconsistency (x7) is the failure of an employee to perform consistently. This may be due to frequent absenteeism caused by repetitive work, tiredness, health issues, psychological problems such as stress, etc. This may also be due to lack of knowledge, training, participation, or motivation. These problems must be addressed and acted on by management at the earliest opportunity. This barrier affects the very basis for change - i.e., an empowered workforce.
Resource constraints (x8) refer to the lack of resources, such as employees, machines, materials, finance, etc. In such a situation, management cannot proceed with new paradigms. These constraints can influence resource management.
Investment restrictions (x9) are limitations on the amount invested by management, which may not have sufficient funds to invest in changes such as lean manufacturing, new technology, etc. If the management is not ready to invest in change, then growth is not possible.
Demand fluctuations (x10) are the variations in the ordering of products by customers over time. Demand for a product changes, depending on market requirements. This plays a significant role in change management. It affects the manufacturing strategy in producing the number of products.
5 FUZZY LOGIC
Fuzzy logic evolved from fuzzy set theory. This idea was first developed by Lotfi Zadeh in 1965. It is a method of managing human perceptions in decision-making. Ragin [38] emphasised that fuzzy sets permit the scaling of membership scores for partial or full fuzzy membership. Generally speaking, fuzzy logic is a technique to overcome uncertainty and ambiguity in decision-making. Mamdani was used as a fuzzy inference system in this study because of its simple structure and ease of producing results. In this work, the trapezoidal membership function was applied to measure the input and output variables. A fuzzy model is expressed as a block diagram in Figure 2.
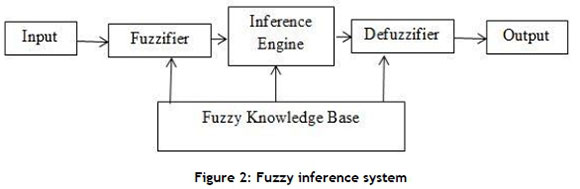
The block diagram consists of the fuzzifier, inference engine, fuzzy knowledge base, and defuzzifier. The fuzzifier converts the crisp input values into fuzzy values. The fuzzy values are then processed by the inference engine, based on the rule base from the fuzzy knowledge base. The defuzzifier, using the centroid method, converts the fuzzy value into the crisp value of outputs in MATLAB. In this way, the fuzzy inference system produces the output by following human reasoning as the rule base. Fuzzy logic is widely applied to solve problems that contain subjectivity. Moreover, fuzzy logic was mentioned in many studies of literature about its application in evaluating the performance of a person or a system. A performance evaluation system was developed for employees, considering 20 performance evaluation criteria using fuzzy logic [41]. In a conventional fuzzy-based system, the number of rules increases exponentially, and handling them creates a lot of complexity. In order to overcome the complications due to the number of inputs and membership functions, a hierarchical fuzzy system has been proposed in this work. The hierarchical fuzzy system corresponds to the hierarchical form of low-dimensional fuzzy systems [42]. The advantage of this system was identified by Lee, Chung & Yu [43] as the total number of linear rule increases. The final solution of the model depends on the size of the hierarchical fuzzy logic, which is specified by different stages of computation. Kouikolglou and Phillis [44] provided the necessary conditions to prove the monotonicity of hierarchical fuzzy systems - i.e., the rule base is non-decreasing. A model was proposed using the fuzzy inference system to evaluate SMEs' manufacturing sustainability [45]. At first, the output variables are computed from the input variables at the lower stage of the hierarchical fuzzy system. Then the output variables from the lower stage can be applied as input variables to the upper stage for the final solution.
Rule formulation
The total number of rules in the hierarchical fuzzy system can be defined using Equation (4) by referring to the model proposed by Fayaz et al. [46].

where
fi = no. of factors in each stage,
M = no. of membership functions in each stage,
ni = no. of sub-factors in each stage,
i = 1 to L no. of stages.
The number of rules proposed for the first stage = 2*35 = 2*243 = 486
The number of rules in the second stage = 1*42 = 16
Therefore the total number of rules in both the stages = 502
The third stage is the result of the second stage
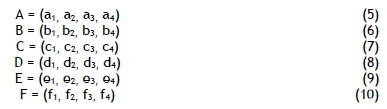
The first stage of the lean readiness framework has five-sub factors each for the critical success factors and the barriers. So the determination of output variables was the same for both elements. In the first stage of the hierarchical fuzzy system, the average of the fuzzy sets was performed between the five trapezoidal fuzzy numbers. The average fuzzy operation was inspired by the literature proposed by Vinodh et al. [47] . Let A, B, C, D, and E be the five trapezoidal fuzzy numbers, where F is the output or the average of these five numbers. In the second stage, the average was performed between two trapezoidal fuzzy numbers and they were the critical success factors and the barriers.
then,

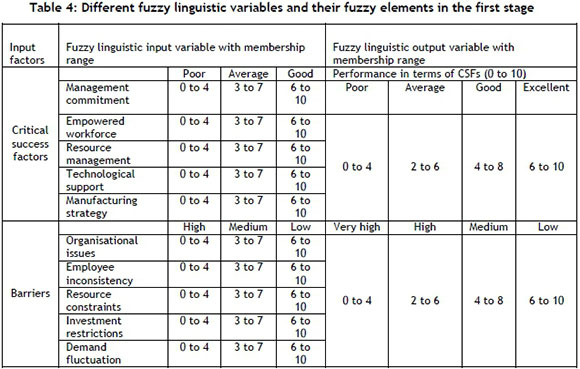
In the first stage of the hierarchical fuzzy system, there are three trapezoidal membership functions as inputs, and four trapezoidal membership functions as outputs, as shown in Table 4. In the second stage, there are four trapezoidal membership functions each for the critical success factors and the barriers used as inputs, and five trapezoidal membership functions of lean readiness used as outputs, which are tabulated in Table 5.
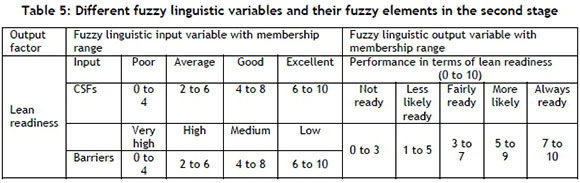
For instance:
'If then' rules for the critical success factors:
If management commitment is poor, the empowered workforce is poor, the resource management is poor, the technology support is poor, and the manufacturing strategy is poor, then the critical success factors are poor.
'If then' rules for the barriers:
If organisational issues are high, employee inconsistency is high, resource constraints are high, investment constraints are high, and demand fluctuation is high, then the barrier is high.
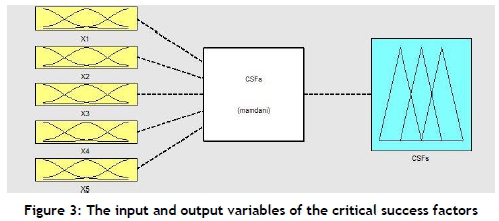
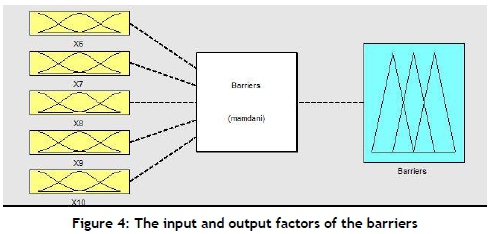
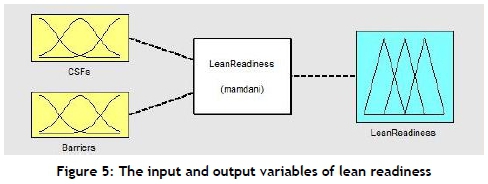
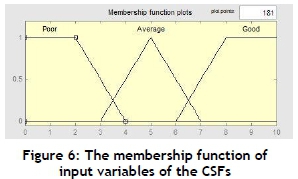
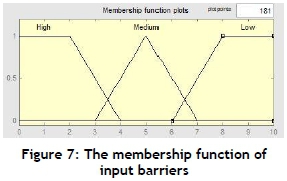
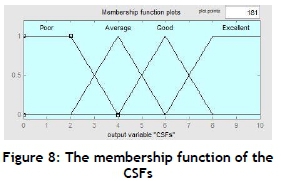
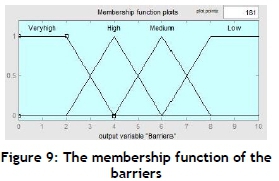
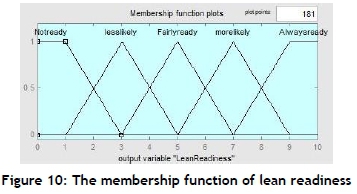
Figures 3 to 5 were employed to show the input and output variables of the CSFs and barriers in the first stage, and lean readiness in the second stage. The membership functions were the same for all the input variables of the CSFs and the barriers, as mentioned in Figures 6 and 7 respectively. Figures 8 and 9 denote the output variables of the CSFs and the barriers in the first stage, which were the same as the input variables in the second stage. The output membership function of lean readiness is shown in Figure 10.
6 DATA COLLECTION
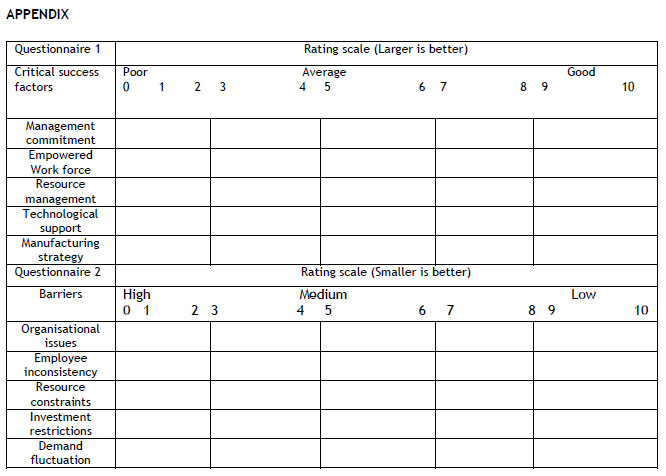
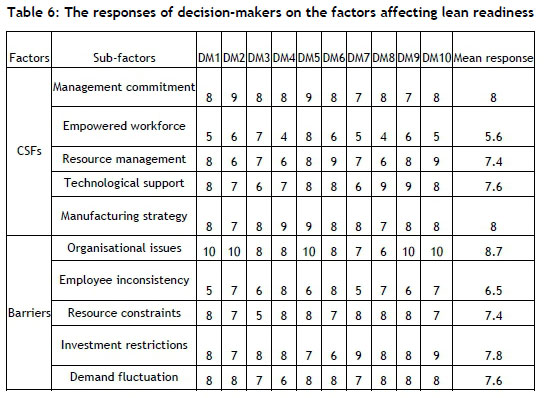
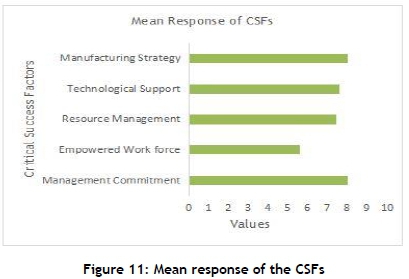
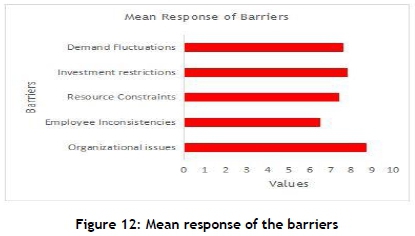
The case study industry is a leading automotive parts manufacturer in Tamil Nadu. It supplies auto parts, such as steering knuckles, brake drums, hubs, calipers, adjusters, differential casings, and axle housings to prominent automobile industries around the world. It is an ISO-certified industry that is planning for lean implementation. Since this industry sought to know its lean readiness, its decision-makers, who were also experts in lean, participated actively in the brainstorming session and helped us to prepare the questionnaire. They also gave valuable input to the survey. The input data given by the ten decision-makers from the case study industry was in the form of a Likert scale in the range of 0-10, using the questionnaire given in the appendix. Since the CSFs and the barriers are opposing forces, two different Likert scales were developed. The CSFs were rated using an increasing scale - i.e., larger is better. The barriers were rated using a decreasing scale - i.e., smaller is better. The opinion of the decision-makers about the sub-factors of lean readiness is tabulated in Table 6. The mean value of the data was used as input in the first stage of the fuzzy inference system of MATLAB. The mean response was determined by taking the average value of the 10 respondents on each of the sub-factors of the critical success factors and the barriers. Among the mean values, the minimum value of the empowered workforce is 5.6, and employee inconsistency is 6.5. This implies that the traits of the employees could be improved, along with other sub-factors, in order to make the implementation of lean much easier. The outputs from the first stage of the fuzzy inference system (FIS) were taken and entered as the inputs to the second stage of the FIS. Thus the fuzzy inference system of MATLAB produces the results of lean readiness in the form of a crisp value. The graphs in Figures 11 and 12 illustrate the mean response of the CSFs and the barriers.
7 RESULTS AND DISCUSSION
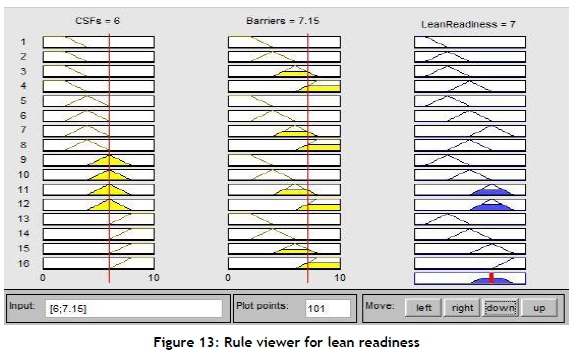
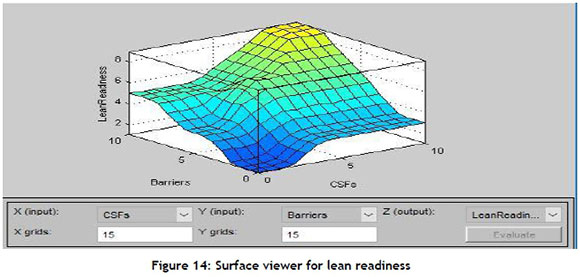
In this work, the lean readiness of a case study industry was evaluated using the hierarchical fuzzy system. The total number of rules was 502. The rules were framed using the average method. The data was taken from the opinions of the ten decision-makers in the brainstorming session. The obtained data was given as input to the first stage of the fuzzy inference system to find the values of the critical success factors and the barriers. The output of these two factors was given as input to the second stage of lean readiness to find the value of the lean readiness. As mentioned in Figures 13 and 14, the rule viewer and the surface viewer of the fuzzy inference system of MATLAB can be used to show the results for lean readiness. Just by varying the red line of the CSFs and the barriers in the rule viewer, the different values of lean readiness can be determined. In the surface viewer, the output variable increases with an increase in the input variables. The value of the CSFs is 6, which means that it lies between average and good. The value of the barriers is 7.15, which shows the medium range of the barriers to lean readiness. The results showed that the case study industry is most likely ready to implement lean in its premises. The hierarchical fuzzy system was applied in this work to overcome the rule explosion and the complexity of using a single fuzzy system; otherwise, the number of rules could go up to 59049.
8 CONCLUSION
Implementing lean in an industry is a significant challenge for managers. It is not so easy to bring people with differing opinions to a common mind. But by doing so, a win-win situation prevails. This paper is an attempt to make such a scenario in a case study industry by taking note of the opinions in areas of conflicting interest. Force field analysis was used to express the opposing nature of the critical success factors and the barriers in deciding the readiness of lean. A framework model was developed to show the sub-factors, and the factors of the CSFs and the barriers, in moving towards the objective of lean readiness. By using fuzzy logic in MATLAB, it was found that the case study industry was more likely ready to introduce lean manufacturing in its premises.
Lean readiness is an important step towards lean implementation. It helps managers to know the factors affecting lean implementation at an early stage. So it is a way to reduce the unnecessary cost of the implementation of lean tools. It also gives the necessary inputs in identifying the factors affecting lean readiness. This work can act as a 'go' or 'don't go' gauge in the lean implementation process. The limitation of this work is that it examines a single industry. However, this could also be conducted in any industry by identifying its critical success factors and barriers to lean readiness, using brainstorming and questionnaires. In the future, lean readiness can be evaluated in different industries and compared to discover a firm's willingness to adopt lean manufacturing.
ACKNOWLEDGEMENTS
We thank the management of the case study industry for their valuable suggestions about this research. We would also like to thank those who participated in the survey and gave their valuable input, thus making it possible.
REFERENCES
[1] Womack, J.P., Jones, D.T. & Ross, D. 1990. The machine that changes the world. New York: Harper Perennial. https://masdukiasbari.files.wordpress.com/2011/04/the_machine_that_changed_the_world.pdf [ Links ]
[2] Heizer, J. & Render, B. 2004. Principles of operations management. Upper Saddle River, NJ: Pearson/Prentice Hall. https://trove.nla.gov.au/version/207889516 [ Links ]
[3] Voss, C.A. 2005. Paradigms of manufacturing strategy revisited. International Journal of Operations & Production Management, 25(12), pp.1223-1227. https://www.emeraldinsight.com/doi/abs/10.1108/01443570510633620 [ Links ]
[4] Saurin, T.A, Marodin, G.A. & Riberio, J.L.D. 2011. A framework for assessing the use of production practices in manufacturing cells. International Journal of Production Research, 49(11), pp. 3211-3230. https://www.tandfonline.com/doi/abs/10.1080/00207543.2010.482567 [ Links ]
[5] Womack, J. & Jones, D. 1996. Lean thinking: Banish waste and create wealth in your corporation. New York: Simon and Schuster. https://books.google.co.in/books/about/Lean_Thinking.html?id=QZrZAAAAQBAJ&redir_esc=y [ Links ]
[6] Pakdil, F. & Leonard, K.M. 2014. Criteria for a lean organization: Development of a lean assessment tool. International Journal of Production Research, 52(15), pp. 4587-4607. https://www.tandfonline.com/doi/abs/10.1080/00207543.2013.879614 [ Links ]
[7] Hayes, B.J. 2000. Assessing for lean six sigma implementation and success. Six Sigma Advantage, https://www.isixsigma.com/implementation/basics/assessing-lean-six-sigma-implementation-and-success. [ Links ]
[8] Salonitis, K. & Tsinopoulos, C. 2016. Drivers and barriers of lean implementation in the Greek manufacturing sector. Procedia CIRP, 57, pp. 189-194. https://www.sciencedirect.com/science/article/pii/S2212827116311878 [ Links ]
[9] Al-Najem, M, Dakhal, H., Labib, A. & Bennet, N. 2013. Lean readiness within Kuwaiti manufacturing industries. International Journal of Lean Six Sigma, 4(3), pp. 280-320. https://www.emeraldinsight.com/doi/abs/10.1108/IJLSS-05-2013-0027 [ Links ]
[10] Shokri, A., Waring, T.S. & Nabhani, F. 2016. Investigating the readiness of people in manufacturing SMEs to embark on Lean Six Sigma projects: An empirical study in the German manufacturing sector. International Journal of Operations & Production Management, 36(8), pp.850-878. https://doi.org/10.1108/IJOPM-11-2014-0530 [ Links ]
[11] O'Connor, J.T., O'Brien, W.J. & Ouk Choi, J. 2014. Critical success factors and enablers for optimum and maximum industrial modularization. Journal of Construction Engineering and Management, 140, pp. 1-11. https://ascelibrary.org/doi/10.1061/(ASCE)CO.1943-7862.0000842 [ Links ]
[12] Lucey, J., Bateman, N. & Hines, P. 2005. Why lean transitions have not been sustained. Management Services, 49(2), pp. 9-13. https://www.ims-productivity.com/user/custom/journal/2005/Summer/IMSsum05p9.pdf [ Links ]
[13] Netland, T.H. 2016. Critical success factors for implementing lean production: The effect of contingencies. International Journal of Production Research, 54(8), pp. 2433-2448. https://www.tandfonline.com/doi/full/10.1080/00207543.2015.1096976 [ Links ]
[14] Achanga, P., Shehab, E., Roy, R. & Nelder, G. 2006. Critical success factors for lean implementation within SMEs. Journal of Manufacturing Technology Management, 17(4) pp. 460-471. https://www.emeraldinsight.com/doi/abs/10.1108/17410380610662889 [ Links ]
[15] Marodin, G.A. & Saurin, T.A. 2013. Implementing lean production systems: Research areas and opportunities for future studies. International Journal of Production Research, 51(22), pp. 6663-6680. https://www.tandfonline.com/doi/abs/10.1080/00207543.2013.826831 [ Links ]
[16] Coronado, R.B. & Antony, J. 2002. Critical success factors for the successful implementation of six sigma projects in organizations. The TQM Magazine, 14(2), pp. 92-99. https://www.emeraldinsight.com/doi/abs/10.1108/09544780210416702 [ Links ]
[17] Papadopoulou, T.C. & Ozbayrak, M. 2005. Leanness: Experiences from the journey to date. Journal of Manufacturing Technology Management 16(7), pp. 784-807. https://www.emeraldinsight.com/doi/abs/10.1108/17410380510626196 [ Links ]
[18] Ramarapu, N.K., Mehra, S. & Frolick, M.N. 1995. A comparative analysis and review of JIT implementation research. Int. J. Oper. Prod. Manag., 15(1), pp. 38-49. https://www.emeraldinsight.com/doi/pdfplus/10.1108/01443579510077188 [ Links ]
[19] Shah, R. & Ward, P.T. 2003. Lean manufacturing: Context, practice bundles, and performance. Journal of Operations Management, 21(2), pp.129-149. https://www.sciencedirect.com/science/article/abs/pii/S0272696302001080 [ Links ]
[20] Minh, N.D., Nguyen, N.D. & Tuan, L.A. 2015. Framework of critical success factors for lean implementation in Vietnam manufacturing enterprises. VNU Journal of Science: Economics and Business, 31 (5E), pp. 33-41. https://js.vnu.edu.vn/EAB/article/view/338 [ Links ]
[21] Zhu, Z., Meredith, P.H. & Makboonprasith, S. 1994. Defining critical elements in JIT implementation: A survey. Ind. Manag. Data Syst., 94(5), pp. 3-10. https://www.emeraldinsight.com/doi/abs/10.1108/02635579410063252 [ Links ]
[22] Dombrowski, U. & Mielke, T. 2013. Lean leadership: Fundamental principles and their application. Procedia CIRP, 7, pp. 569-574. https://www.sciencedirect.com/science/article/pii/S221282711300303X [ Links ]
[23] Garcia-Sabater, J.J. & Marin-Garcia, J.A. 2011. Can we still talk about continuous improvement? Rethinking enablers and inhibitors for successful implementation. Int. J. Technology Management, 55 (1/2), pp. 28-42. https://www.inderscienceonline.com/doi/abs/10.1504/IJTM.2011.041678 [ Links ]
[24] Jadhav, J.R., Mantha, S.S. & Rane, S.B. 2015. Analysis of interactions among the barriers to JIT production: Interpretive structural modeling approach. J. Ind. Eng. Int. , 11(3), pp. 331 -352. https://link.springer.com/content/pdf/10.1007/s40092-014-0092-4.pdf [ Links ]
[25] Marodin, G.A. & Saurin, T.A. 2015. Managing barriers to lean production implementation: Context matters. International Journal of Production Research, 53(13), pp. 3947-3962. https://www.tandfonline.com/doi/full/10.1080/00207543.2014.980454 [ Links ]
[26] Easwaramoorthi, M., Kathiresan, G.R., Prasad, P.S.S. & Mohanram, P.V. 2011. A survey on lean practices in Indian machine tool industries. International Journal of Advanced Manufacturing Technology, 52(9-12), pp. 1091-1101. https://link.springer.com/article/10.1007/s00170-010-2788-y [ Links ]
[27] Marodin, G.A. & Saurin, T.A. 2014. Classification and relationships between risks that affect lean production implementation: A study in Southern Brazil. Journal of Manufacturing Technology Management, 26(1), pp.57-79. https://www.emeraldinsight.com/doi/abs/10.1108/JMTM-12-2012-0113 [ Links ]
[28] Bhasin S. & Burcher P. 2006. Lean viewed as a philosophy. Journal of Manufacturing Technology and Management, 17(1), pp. 56-72. https://www.emeraldinsight.com/doi/abs/10.1108/17410380610639506 [ Links ]
[29] Hines, P., Holweg , M. & Rich, N. 2004. Learning to evolve: A review of contemporary lean thinking. International Journal of Operations & Production Management, 24(10), pp. 994-1011. https://www.emeraldinsight.com/doi/abs/10.1108/01443570410558049 [ Links ]
[30] Abolhassani, A., Layfield, K. & Gopalakrishnan, B. 2016. Lean and US manufacturing industry: Popularity of practices and implementation barriers. International Journal of Productivity and Performance Management, 65(7), pp. 875-897. https://www.emeraldinsight.com/doi/abs/10.1108/IJPPM-10-2014-0157 [ Links ]
[31] Bouville, G. & Alis, D. 2014. The effects of lean organizational practices on employees' attitudes and workers' health: Evidence from France. The International Journal of Human Resources Management, 25(21), pp. 3016-3037. https://www.tandfonline.com/doi/abs/10.1080/09585192.2014.951950 [ Links ]
[32] Bhasin, S. 2012. Prominent obstacles to lean. International Journal of Productivity and Performance Management, 61(4), pp. 403-425. https://www.emeraldinsight.com/doi/abs/10.1108/17410401211212661 [ Links ]
[33] Lodgaard, E., Ingvaldsen, J.A., Gamme, I. & Aschehouga, S. 2016. Barriers to lean implementation: Perceptions of top managers, middle managers, and workers. Procedia CIRP, 57, pp. 595-600. https://www.sciencedirect.com/science/article/pii/S2212827116312574 [ Links ]
[34] Panizzolo, R., Garengo, P. Sharma, M.K. & Gore, A. 2012. Lean manufacturing in developing countries: Evidence from Indian SMEs. Production Planning & Control, 23(10-11), pp. 769-788. https://www.tandfonline.com/doi/abs/10.1080/09537287.2011.642155 [ Links ]
[35] Ciarniene, R. & Vienazindiene, M. 2013. Lean manufacturing implementation: The main challenges and barriers. Management Theory and Studies for Rural Business and Infrastructure Development, 35(1), pp. 43-49. http://mts.asu.lt/mtsrbid/article/view/102/131 [ Links ]
[36] Yang, P.A. & Yu, Y.B. 2010. The barriers to SMEs' implementation of lean production & countermeasures. International Journal of Innovation, Management & Technology,1(2), pp. 220-225. http://www.ijimt.org/papers/41-M439.pdf [ Links ]
[37] Burnes, B. 2004. Managing change: A strategic approach to organisational dynamics, 4th ed. Harlow: Prentice Hall. http://www.pearsoned.co.uk/bookshop/detail.asp?item=100000000237681 [ Links ]
[38] Luecke, R. 2003. Managing change and transition. Boston, MA: Harvard Business School Press. https://hbr.org/product/harvard-business-essentials-managing-change-and-transition-seven-practical-strategies-to-help-you-lead-during-turbulent-times/8741-PBK-ENG [ Links ]
[39] Swanson, D.J. & Creed, A.S. 2014. Sharpening the focus of force field analysis. Journal of Change Management, 14(1), pp. 28-47. https://www.tandfonline.com/doi/abs/10.1080/14697017.2013.788052 [ Links ]
[40] Ragin, C. 2000. Fuzzy-set social science. Chicago: University of Chicago Press. http://press.uchicago.edu/ucp/books/book/chicago/F/bo3635786.html [ Links ]
[41] Ahmed, I., Sultana, I., Paul, S.K. & Azeem, A. 2013. Employee performance evaluation: A fuzzy approach. International Journal of Productivity and Performance Management, 62(7), pp. 718-734. https://www.emeraldinsight.com/doi/abs/10.1108/IJPPM-01-2013-0013 [ Links ]
[42] Brown, M., Bossley, K.M., Mills, D.J. & Harris, C.J. 1995. High dimensional neuro-fuzzy systems: Overcoming the curse of dimensionality. Proc. IEEE Internat. Conf., pp. 2139-2146. https://ieeexplore.ieee.org/document/409976 [ Links ]
[43] Lee, M.-L., Chung, H.-Y. & Yu, F.-M. 2003. Modeling of hierarchical fuzzy systems. Fuzzy Sets Syst., 138, pp. 343-361. https://www.sciencedirect.com/science/article/pii/S0165011402005171 [ Links ]
[44] Kouikolglou, V.S & Phillis, Y.A. 2009. On the monotonicity of hierarchical sum-product fuzzy systems. Fuzzy Sets and Systems, 160 (24), pp. 3530-3538. https://www.sciencedirect.com/science/article/pii/S0165011409000657 [ Links ]
[45] Singh, S., Olugu, E.U. & Fallahpour, A. 2014. Fuzzy-based sustainable manufacturing assessment model for SMEs. Clean Techn. Environ. Policy, 16, pp. 847-860. https://link.springer.com/article/10.1007/s10098-013-0676-5 [ Links ]
[46] Fayaz, M., Ullah, I., Park, D.-H., Kim, K. & Kim, D. 2017. An integrated risk index model based on hierarchical fuzzy logic for underground risk assessment. Applied Sciences, 7(10), pp.1-21. http://www.mdpi.com/2076-3417/7/10/1037 [ Links ]
[47] Vinodh, S., Devadasan, S.R., Vimal, K.E.K. & Kumar, D. 2013. Design of agile supply chain assessment model and its case study in an Indian automotive components manufacturing organization. Journal of Manufacturing Systems, 32(4), pp. 620-631. https://www.sciencedirect.com/science/article/pii/S0278612513000344 [ Links ]
Submitted by authors 3 May 2018
Accepted for publication 5 Apr 2019
Available online 29 May 2019
* Corresponding author. muthubas@ametuniv.ac.in