


Services on Demand
Article
 English (pdf)
 Article in xml format
 Article references
Indicators

Related links
-
 Cited by Google
 -
 Similars in Google
Share

 Permalink
South African Journal of Industrial Engineering
On-line version ISSN 2224-7890
Print version ISSN 1012-277X
S. Afr. J. Ind. Eng. vol.30 n.1 Pretoria May. 2019
http://dx.doi.org/10.7166/30-1-2089
GENERAL ARTICLES
Simulation-aided value stream mapping for productivity progression in a steel shaft manufacturing environment
T. MunyaiI, *; O.A. MakindeI; C. MbohwaII; B. RamatsetseIII
IDepartment of Operations Management, Tshwane University of Technology, South Africa
IIFaculty of Engineering and Built Environment, University of Johannesburg, South Africa
IIIDepartment of Industrial Engineering, Tshwane University of Technology, South Africa
ABSTRACT
Productivity improvement in the steel industry is pivotal to achieving competiveness that stimulate the economic growth of a country. In the past decade, the steel shaft manufacturing industry has experienced low productivity rates, making it difficult to compete at a global level. In light of this, the aim of this research study is to investigate the various process wastes and bottlenecks that limit the productivity progression of a steel shaft manufacturing environment, using integrated value stream mapping and system simulation methodologies. Data captured through the system observation of the shaft manufacturing process of a steel company was used to map and simulate the system. The results of the current state mapping of the steel shaft manufacturing environment revealed the various process wastes present in this system. The result of the simulation of the system revealed that the system bottlenecks were the saw master and milling stations. The strategic interventions in the saw master and milling stations improved these stations throughput from 959 to 1 218 (27%) and 624 to 1 003 (60.74%) components respectively. The work-in-progress components generated in the entire system after the strategic interventions reduced from 415 to 17.
OPSOMMING
Produksieverbetering in die staalindustrie is deurslaggewend om mededingendheid te behaal wat die ekonomie van 'n land stimuleer. In die afgelope dekade het die staal as vervaardigingindustrie lae produktiwiteit ervaar en dit maak dit moeilik om internasionaal mee te ding. Die doel van hierdie navorsing is om verskeie proses vermorsing en bottelnekke wat produksie beperk te ondersoek deur van geïntegreerde waardestroomkartering en stelsel simulasie metodologieë gebruik te maak. Data waargeneem in die as vervaardigingsproses van 'n staal maatskappy is gebruik om die stelsel te karteer en te simuleer. Die resultate van die huidige toestand kartering het verskeie proses vermorsings blootgestel. Die simulasie resultaat het getoon dat die proses-bottelnekke die meestersaag en die vreesmasjien stasie is. Strategiese ingrypings by die twee bottelnekke het die deurset onderskeidelik verhoog van 959 na 1218 (27%) en van 624 na 1003 (60.74%) komponente. Die werk-in-proses komponente in die algehele sisteem na die strategiese ingryping het verminder van 415 na 17.
1 INTRODUCTION
Productivity improvement in a manufacturing setting involves the efficient use of resources - such as human resources, machinery, material, finance, technology, management, layout, and location ([1], [2], [3], [4]) - and also significantly contributes to the competitiveness and profitability of an organisation. Productivity improvement in the steel industry contributes to the gross domestic product (GDP) and enhances job creation, thus improving the standard of living in a country. The steel manufacturing industry contributes 17 per cent of the GDP generated in South Africa [5]. Optimising productivity in a steel shaft manufacturing environment will enable the industry to compete in the global market in terms of quality, operations cost, and delivery, thus leading to the efficient use of resources and the reduction of inventories generated in the manufacturing system ([6], [7]). The productivity rate in the steel shaft manufacturing industry remains low, which thus lowers the competitiveness of these industries ([8], [9]). Low productivity results in: (1) increased unemployment, (2) an inability to meet local and export market demands, (3) a lower profit generation, and (4) a decline in the growth of the organisation. Despite government intervention in supporting the local industry through increased import tariffs, the industry remained in decline. The complexity of manufacturing processes makes it difficult to pinpoint the factors contributing to productivity drawbacks. Because of this, the industry experiences massive retrenchment and is unable to create new jobs. According to Marsillac and Roh [3], a number of internal factors that could contribute to low productivity include: human resource deficiencies (due to lack of skills, training, and knowledge); machine resource deficiencies (due to equipment running below its technical specifications); finance deficiencies (due to an inability to meet day-to-day operational obligations); a material resource deficiency (due to delays in delivery and low quality); a location deficiency (due to poor positioning for customers); a layout deficiency (due to the improper arrangement of machines within the facility and of the flow of work); a technological deficiency (not being innovative); and a management deficiency (lack of communication and support for employees). In the light of this, the continuous monitoring and improvement of human, material, and financial resources is necessary, with a view to preventing such deficiencies and suggesting solutions to them, if they are present in the steel shaft manufacturing industry. Existing studies on productivity improvement have focused their efforts on the application of lean techniques, the 'DMAIC' (define, measure, analyse, improve, and control) problem-solving methodology, business process re-engineering (BPR), business process management (effective and efficient manufacturing processes that encourage innovation and technology), work studies, the theory of constraints, total quality management (TQM), linear and non-linear programming, data enveloping analysis (DEA), fuzzy analytic hierarchy process (FAHP), and simulation.
However, harnessing the potential of two or more of these industrial engineering tools to improve productivity has not been fully explored in the literature. In the light of this, the study seeks to integrate simulation and value stream mapping (VSM) in order to: (1) visualise the various process wastes and bottlenecks that limit the performance of a steel shaft manufacturing environment; and (2) suggest sustainable manufacturing system strategies that will improve the productivity of this environment. The sections following this introduction are the literature review, the methodology and case study analysis of a steel shaft manufacturing environment, the results of current and future states of simulation and mapping of a steel shaft manufacturing environment, and the conclusion.
2 LITERATURE REVIEW
Numerous studies have been carried out on the application of lean ([10], [11], [12], [13], [14], [15], [16], [17], [18], [19], [20]) and system simulation ([21], [21], [23], [24], [25], [26], [27], [28], [29]) to improve the productivity of various manufacturing sectors such as aerospace, automotive, steel, telecommunication, food, pharmaceutical, rope, metal, and instrumentation. Although several studies have been conducted on the use of either VSM or simulation techniques with a view to improving the productivity of various manufacturing industries, no study in the literature has examined the integration of simulation and VSM in improving productivity in a steel shaft manufacturing environment. Gurumurthy and Kodali [11], Rasi et al. [12], and Helleno et al. [13] emphasised the need to integrate VSM and simulation to deal with low productivity in a manufacturing environment. The paper by Rohani and Zahraee [30] also recommended that further investigation be conducted to incorporate VSM and computer simulation software for process waste elimination and production throughput improvement. Therefore, simulation could be used as a subordinate and pivotal decision-making and risk-analysis tool to VSM, to determine a suitable manufacturing system configuration that will optimise the productivity of an organisation.
3 RESEARCH METHODOLOGY
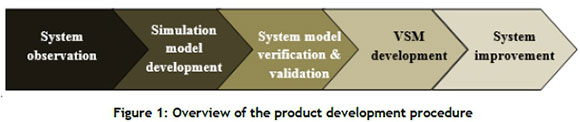
Figure 1 shows an overview of the approach used to resolve a low productivity rate in a steel shaft manufacturing environment.
The case study considered in this research work is a steel shaft manufacturing environment producing shafts. The process of manufacturing steel shafts involves: (i) cutting steel rods into various sizes, based on customer specifications, using a cutting machine, (ii) machining the cut steel workpieces using a CNC machine, (iii) threading and slotting the machine steel work piece using Herbert and milling machines, and (iv) inspecting the steel shaft product using GO/No GO gauges and vernier callipers for quality, as shown in Figure 2.
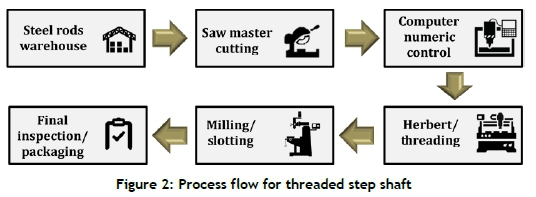
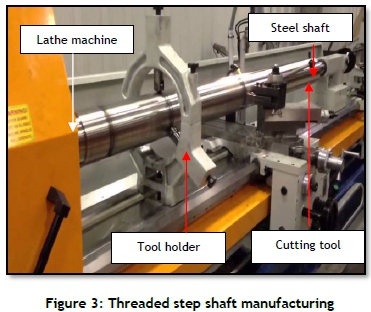
Figure 3 depicts a typical turning process carried out during the conversion of a solid round bar into a thread step shaft. In this process, six workstations are required to execute a single work part.
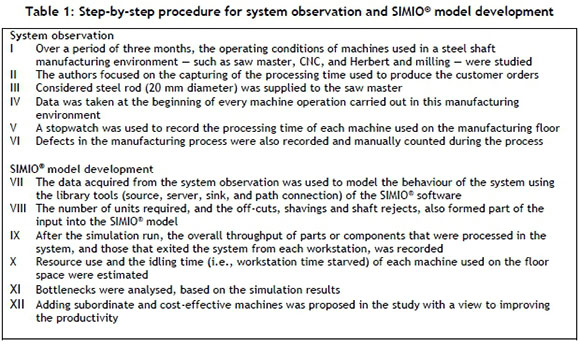
The manufacturing environment works on an eight-hour shift that includes a one-hour break for lunch. Data collection was undertaken in the manufacturing plant through system observation of the process for a period of one month. Other useful information was obtained via expert opinion (i.e., the production manager). The various types of data collected through these approaches included the customer demand data, the machines' processing time data, the work-in-progress (WIP) inventory data, defective data, and motion and transportation data. The average cycle time and average customer demand during the period investigated was used to model and simulate the behaviour of the steel manufacturing system. The detailed discussion of the various steps used to carry out the system observation (I to VI) and model development (VII to XII) during the course of the study are presented in Table 1.
The simulation of this system was conducted using SIMIO® discrete event simulation software. The following assumptions were made during the simulation:
• Assume that the material used in the manufacturing of the shafts is within the correct specifications from the supplier.
• Assume that the operators of the manufacturing systems are trained and qualified to do quality inspection.
The bottlenecked station(s) limiting the performance of the system, and the machines' performance use, became clear from the system simulation results. The results obtained from the simulation, the average WIP inventory data, the average defective data, and the average motion and transportation data were used to compute the VSM of the current state of the system. The various process wastes present in the steel manufacturing environment became apparent from the current VSM results.
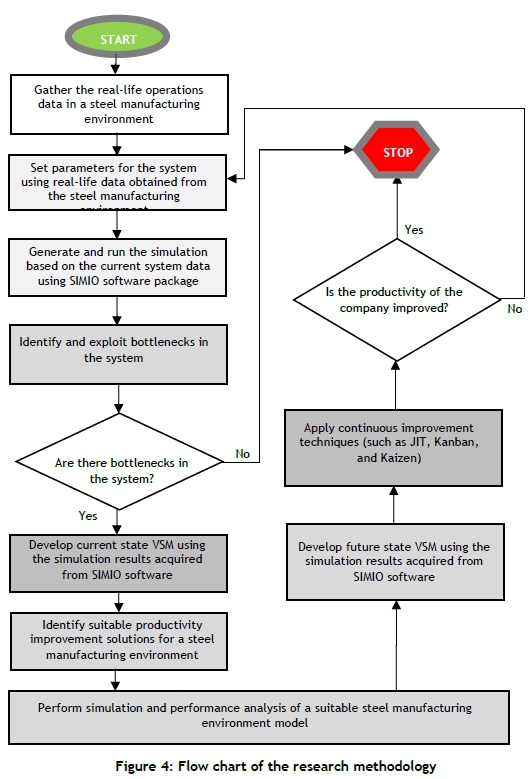
Suitable strategies capable of exploiting and alleviating the bottlenecks and process wastes present in the system were proposed and evaluated in the improved simulation model and future state VSM constructed during the course of the study. A comprehensive flow-chart methodology, which unveiled the various research activities carried out in achieving the aim of the study, is depicted in Figure 4.
4 RESEARCH STUDY RESULTS
4.1 Presentation of system observation data
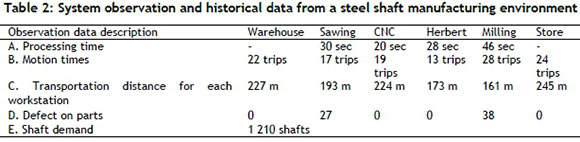
Table 2 presents the average values of the data for the machine processing time, the motion time, the transportation distance, the defects of the parts, and the shaft demand, observed from a South African manufacturing environment over a period of one month. The data for items A, D, and E in Table 2 was used to model the system of a steel shaft manufacturing environment using SIMIO® software in order to assess the performance of this system. The data for items B and C was used as inputs into the VSM of the current state, together with the results from the simulation.
4.2 Simulation model and analysis of the current state of a South African steel shaft manufacturing environment
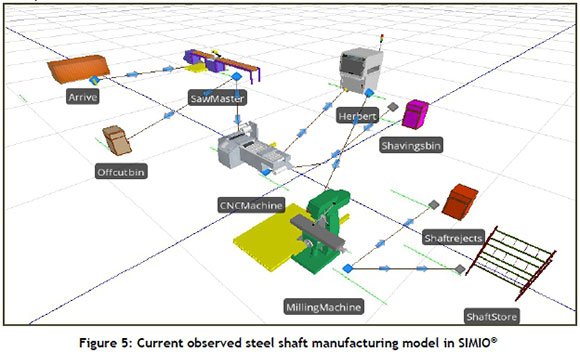
Figure 5 depicts the simulation model of the steel shaft manufacturing environment used to produce shaft products.
The simulation results of the model revealed that, of the 1 210 steel rods (i.e., raw materials) to be machined a day, only 959 were processed to produce the steel shafts. This implies that 251 components were not processed on a particular day (Table 3). Nine hundred and fifty nine cut steel pieces exited the cutting station; 932 were machined in CNC, and 787 threaded steel components and 624 milled steel components were processed, as shown in Table 3. Furthermore, the CNC and Herbert machines were under-used, with efficiency levels of 64.1 per cent and 76.54 per cent respectively.
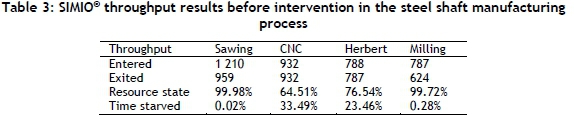
The number of unprocessed steel components lies in the saw master and milling stations, which have caused bottlenecked stations because of the high number of WIP. The total number of WIP in the entire system was 415 components. Apart from system modelling and simulation of this steel shaft manufacturing environment, VSM was conducted on the manufacturing system using the results obtained from the simulation model and other historical data obtained from the production manager of this steel shaft manufacturing environment. This activity was conducted to identify and visualise the value-adding and non-value-adding activities in the supplier, input, process, output, and customer (SIPOC) process of this manufacturing environment. Furthermore, the VSM was developed to outline the material flow and the WIP inventories generated at various stations of the steel shaft manufacturing environment.
The next section analyses the current state VSM of the steel shaft manufacturing environment.
4.3 Value stream mapping and analyses of the current state of a South African steel shaft manufacturing environment
The VSM of the current manufacturing process of the steel shaft manufacturing environment is depicted in Figure 6. Based on this, the cumulative production lead time and processing time for the steel shaft manufacturing process is 8642.98 seconds and 154 seconds respectively. The takt time of the process, obtained using eqn (1), is 23.8 seconds.
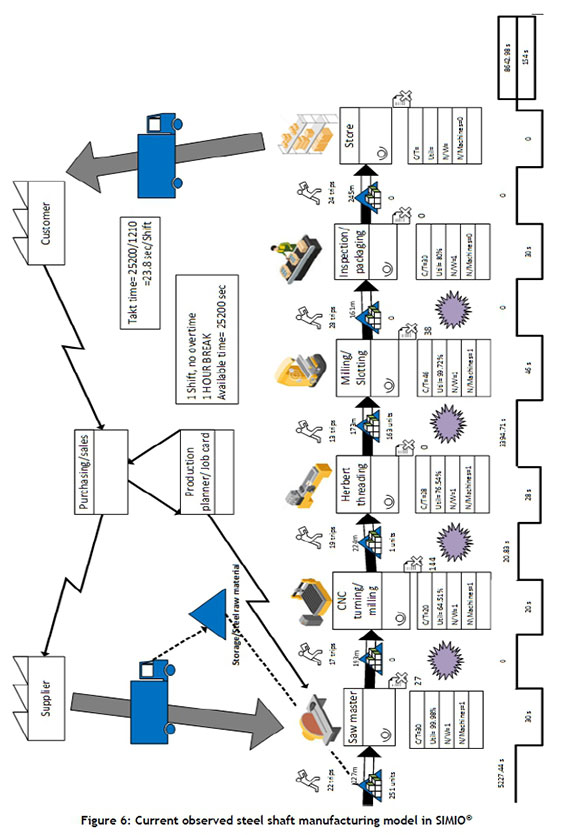
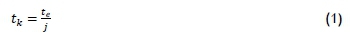
where takt time is represented by tk, while effective time is denoted by te, and daily demand is denoted by j.
Since the takt time for each shaft is about 5.5 times and 363 times of the processing time and cumulative lead time respectively, it can be inferred that the current manufacturing process is not capable of meeting customer demand. Furthermore, from Figure 6, the average WIP and defects generated daily in front of the different workstations (i.e., the warehouse, saw master, CNC, Herbert, milling, and inspection workstations) are 251, 0, 1, 163, 0, 0; and 0, 27, 0, 0, 38, 0; respectively.
The cost of poor quality in the steel shaft manufacturing system is incurred due to nonconformity or failure of the shaft component produced. The financial impact of poor quality needs to be mentioned to highlight the consequence of poor quality or of allowing defects to be the norm in production processes. The defective shafts produced in the cutting and milling section are placed in the rejection bin and sold to scrap dealers at low prices. Table 4 illustrates the various costs incurred during the shaft production process, and the scrap cost for each defective component produced at the different workstations of this system.
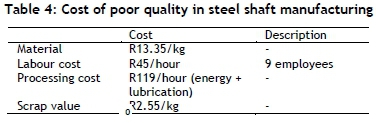
The cost of poor quality at the various workstations is calculated using eqns (2) to (4).

where N, PTand Pc, Lc, SR , Tc/ws and Tcand DRWSrepresent the number of defective components generated per workstation, the total processing time (in hours) and cost incurred to produce the defective components, the labour cost per hour, the scrap recovery cost, and the cost required to transport the defective components generated per workstation and the total defective components to the scrap processing centre, and the defect ratio per workstation.
Since 65 defective components were produced in the sawing and milling stations, the Tc(obtained using the freight classification system) required to transport the defects to the scrap processing centre is given as R831.
The Tc/wsfor the sawing and milling workstations is R349 and R482 respectively. Therefore the cost of poor quality in the steel shaft manufacturing system incurred due to nonconformity at the sawing and milling workstations, obtained using equations (2) to (4), is R2 259.34 and R3 214.58 respectively.
The current layout of the steel shaft manufacturing facility reflects a haphazard flow of WIP products, thus increasing the production cycle time. From the current layout design structure, the WIP generated in saw master, CNC, Herbert, and milling is temporarily stored in a bin located far from these stations, as indicated in Figure 7. Furthermore, in this layout, the operator responsible for the saw master is required to take materials (i.e., WIP products) to and fro from CNC, which causes unnecessary movements and results in a total distance of 1 223 metres covered during the shaft manufacturing operations. The operator from the CNC is required to perform similar movements to and fro from Herbert. The operator from Herbert is required to move threaded shafts to milling for final slotting, and move the remaining components to the WIP. Finally, the components are inspected before being transported from the milling station to the packing section, which is also positioned far from the milling station.
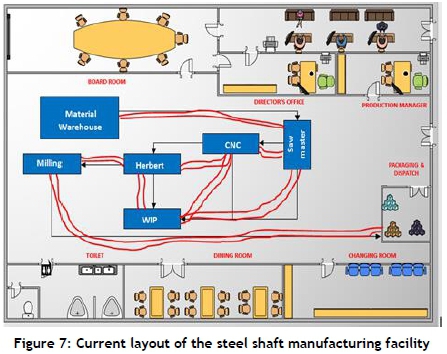
Based on the current layout design of this steel shaft manufacturing facility, the average motions exhibited by workers each day, and the transport distance covered between the workstations, is 22 trips, 17 trips, 19 trips, 13 trips, 28 trips, 24 trips and 227 m, 193 m, 224 m, 173 m, 161 m, and 245 m respectively. These excessive motions and transport distances occurring in the different workstations of this steel shaft manufacturing system resulted in a maximum production time loss of about 162 seconds, 138 seconds, 160 seconds, 124 seconds, 115 seconds, and 175 seconds respectively, assuming that each worker moves to a different destination of interest at the rate of 1.4 m/s.
It could be inferred that various process wastes, such as WIP, defects, and excessive motions and transport, are present in this steel shaft manufacturing system. An opportunity exists to reconfigure the existing process with the aim of (1) exploiting and alleviating the bottlenecked stations, (2) eliminating the various process wastes present in this steel shaft manufacturing system, and (3) reducing the cumulative production lead time of this system. The next section thus presents the simulation model and analysis of the reconfigured system of the steel shaft manufacturing process. It also outlines the improvements made after the strategic interventions carried out on the steel shaft manufacturing system.
4.4 Simulation model and analysis of an improved South African steel shaft manufacturing environment
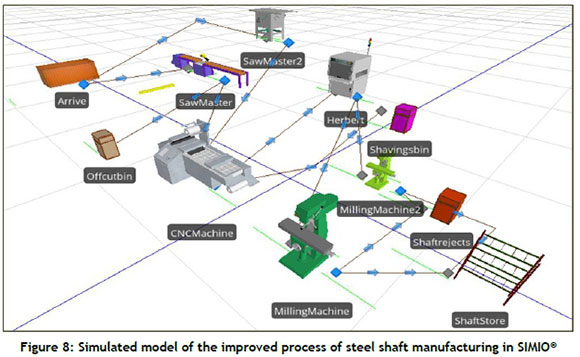
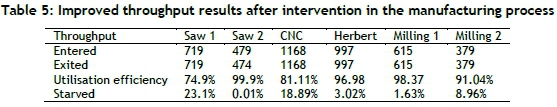
In order to alleviate the bottlenecked stations and eliminate the process wastes present in the steel shaft manufacturing environment, the introduction of a subordinate saw master and milling machine to complement the existing machines was proposed by the researcher. The simulation results of the model (Figure 8) revealed that, out of 1 210 steel rods (i.e., the raw materials) to be machined per day, 1 193 were processed by the two saw masters to produce the required steel shaft components. This implies that around 17 components were not processed on a particular day (Table 4).
One thousand, one hundred and ninety-eight cut steel pieces exited the cutting station; 1 168 were machined in CNC, and 997 threaded steel components and 994 milled steel components were processed at the Herbert machine and the two milling machines respectively, as illustrated in Table 5. Only three WIP steel pieces were unprocessed by the milling machines.
4.5 Design and analysis of an improved facility system for a South African steel shaft manufacturing environment
The new layout design of the steel shaft manufacturing system, in which design focused on the strategic re-arrangement of various workstations and other accessories with a view to reducing the production cycle time, is depicted in Figure 9.
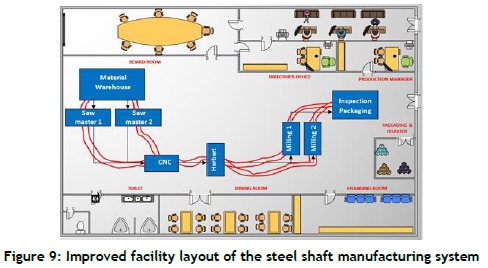
The layout design also concentrates on achieving (1) the uniform and strategic flow of raw materials, and (2) the minimum number of trips and shorter transportation distances used by the operators of different workstations to produce the shafts. A U-shaped facility layout design and a pull strategy, which ensure (1) the minimum distance between various workstation positions responsible for shaft production, and (2) the release of the exact WIP products demanded by various workstations, were proposed for this manufacturing environment. Based on this new facility layout design, the number of motions exhibited by the workers each day, and the transportation distance covered between the warehouse, the sawmaster, CNC, Herbert, milling, and packing during shaft manufacturing are 12, 11, 8, 7, 13, 14, and 123 m, 104 m, 149 m, 86 m, 93 m, and 106 m respectively.
4.5.1 Effect of layout rearrangement on the productivity of the steel shaft manufacturing environment
The total time saved (TTS) by rearranging the workstations to minimise the motions and transport needed by the workers during steel shaft manufacturing is calculated using Equation 5.

where
Dnew the new distance between two relative workstations owing to the layout rearrangement
Dcurrent = the current distance between two relative workstations before the layout rearrangement
Mnew = the number of motions exhibited by the workers during steel shaft manufacturing in the
improved facility layout
Mcurrent = the number of motions exhibited by the workers during steel shaft manufacturing in the current facility layout
W = walking speed of the worker during steel shaft manufacturing
The walking speed used to calculate the TTS is 1.4 meters per second (m/s), as stipulated by Wagnild and Wall-Scheffler [31]. The result of the total time saved owing to layout rearrangement, and calculated using Equation 5, is depicted in Table 6.
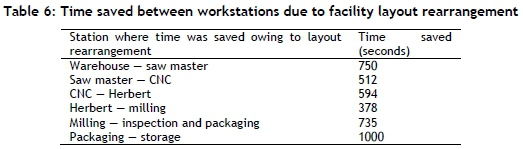
Hence the time saved between these workstations (depicted in Table 6), of 750 seconds, 512 seconds, 594 seconds, 378 seconds, and 735 seconds respectively, was used in the processing of raw materials and WIP units generated at these workstations. The number of additional units of raw material and WIP units processed (N) at these workstations using the TTS from the layout rearrangement is calculated using Equation 6.

The results of the number of additional units of raw material and WIP processed in each of the workstations using Equation 6 is presented in Table 7.
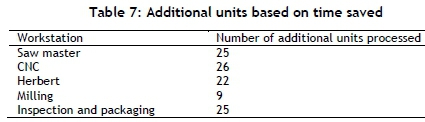
The results in Table 7 show that the additional throughput produced at the saw master, CNC machine, Herbert, and inspection/packaging owing to the rearranged layout increased by between 22 and 26 units, while the milling machine throughput increased by nine units.
The number of raw materials and WIP units (T) processed in each workstation are calculated using Equation 7.

where,
Pi-sm= Initial throughput owing to addition of subordinate machine Plr= Production throughput owing to layout rearrangement
The number of raw materials and WIP units processed in each workstation owing to the addition of the subordinate machines to the existing steel shaft manufacturing system, and the rearrangement of the layout, is presented in Table 8.
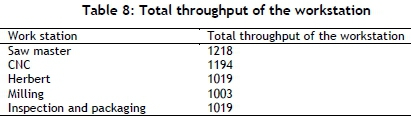
In the light of these results, it can be inferred that 1 019 steel shafts will be produced out of a customer's order for 1 210 steel shafts if the proposed interventions in the study are implemented in this manufacturing environment.
4.6 Root causes analysis of WIP defects in a South African steel shaft manufacturing environment
The root causes analysis of the WIP defects in this South African steel shaft manufacturing environment was carried out using a fishbone diagram to identify the factors that contributed to the high number of shaft defects. The result of the fishbone diagram (Figure 10) revealed that the following factors contributed to the production of WIP product defects: insufficient knowledge and know-how of the operators, inadequate operator training, failure of the operators to follow standard operating procedures, use of non-quality (i.e., out of standard specifications) raw material, use of an inefficient machine maintenance strategy, machine breakdown owing to lack of lubrication and machine component wear and tear, wrong drawings, wrong and misinterpreted customer demand specifications, and use of out-of-date techniques.
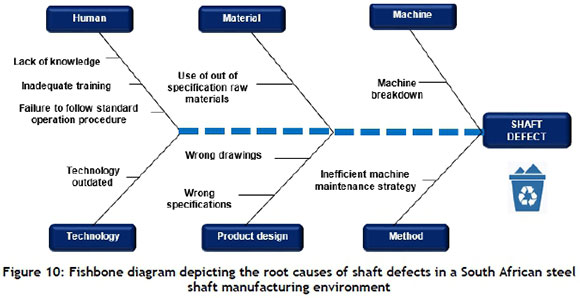
In order to alleviate these factors, the authors proposed the following remedial measures: regular training of operators on (1) the correct use of standard operating procedures, and (2) process planning, analysis, and improvement, as well as the development of preventative and predictive machine maintenance system.
4.7 Value stream mapping and analysis of the future state of a South African steel shaft manufacturing environment
The VSM of the current manufacturing process of the steel shaft manufacturing environment is depicted in Figure 11.
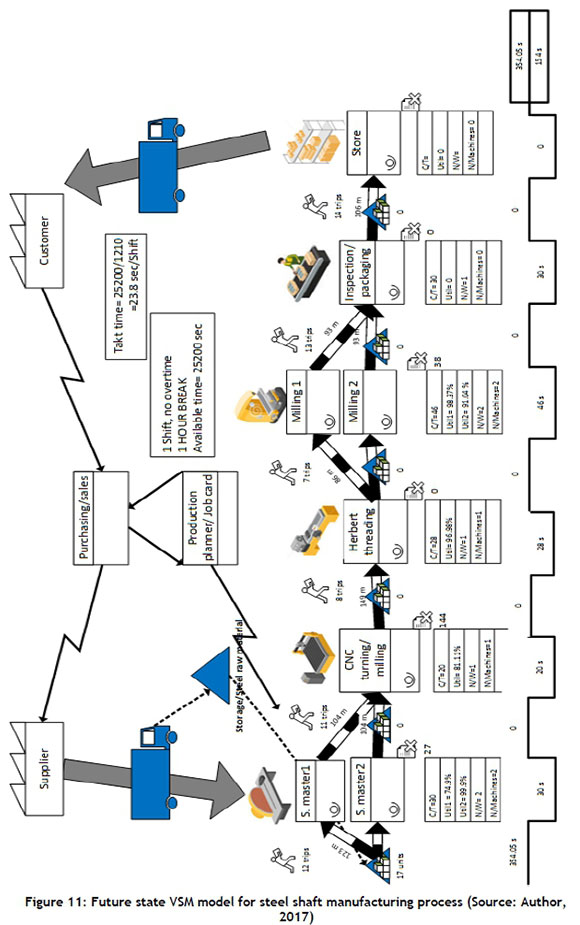
Based on Figure 11, the cumulative production lead time, and the processing time for the steel shaft manufacturing process are 354.05 and 154 seconds respectively. Furthermore, from Figure 11, the average WIP and defects generated in front of the different workstations (i.e., warehouse, saw master, CNC, Herbert, milling, and inspection workstations) each day are 17, 0, 0, 0, 0, 0 and 5, 0, 0, 8, 0, 0 respectively. Based on the new facility layout design of this steel shaft manufacturing system, the average motions and transports exhibited by the workers at different workstations each day are 12 trips, 11 trips, 8 trips, 7 trips, 13 trips, and 14 trips, and 123 m, 104 m, 149 m, 86 m, 93 m, and 106 m respectively.
4.8 Discussion of the process improvements obtained from the improved steel shaft manufacturing simulation model and future VSM
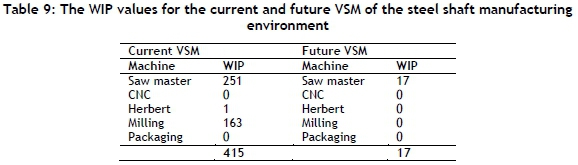
The introduction of extra saw master and milling machines to complement the existing machines in the steel shaft manufacturing system reduced the WIP in the manufacturing process, as shown in Table 9.
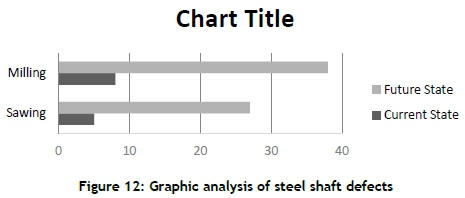
The introduction of regular training for operators on (1) the correct use of standard operating procedures, and (2) process planning, analysis, and improvement, and the development of a preventative and predictive machine maintenance system in this manufacturing environment, reduced the defects produced from the saw master and milling machines by 81.48 per cent (from 27 to 5) and 78.95 per cent (38 to 8) respectively (Figure 12).
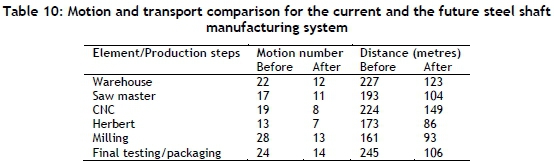
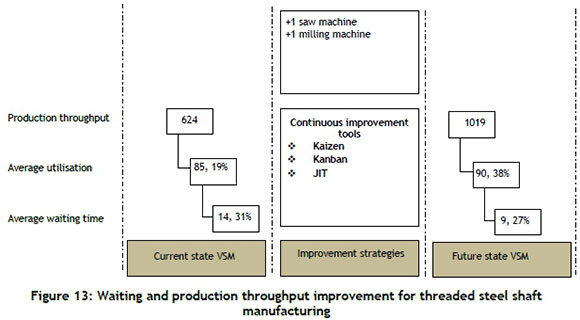
The redesigned steel shaft manufacturing system reduced the number of motions and transports in the warehouse, saw master, CNC, Herbert, milling, and packaging workstations, as shown in Table 10. In the light of the interventions to restructure and improve the current steel shaft manufacturing system, it could be inferred that the production throughput and average machine use increased by 59.29 per cent (from 624 to 994) and 5.19 per cent, while the average WIP waiting time reduced by 5.04 per cent (Figure 13).
5 CONCLUSION
This paper has demonstrated the sequential use of both the SIMIO® discrete event simulator platform and VSM to identify, map, quantify, alleviate, and eliminate the bottlenecks and process wastes limiting the productivity of a steel shaft manufacturing environment. The simulation results of the current steel shaft manufacturing system revealed that the saw master and milling machines are the bottlenecked workstations. The results of the value stream mapping of the current state of this manufacturing environment revealed that the various process wastes impeding the productivity of this organisation are excess WIP products, excessive motions, excessive transport, and defects generated at various workstations of the steel shaft manufacturing system. Various interventions, such as (1) the introduction of subordinate saw master and milling machines to complement the existing machines used in the steel shaft manufacturing system, (2) the restructuring and rearrangement of the layout of the shaft manufacturing facility, and (3) the introduction of predictive machine maintenance systems and training for the operators, reduced the average WIP, average defects, average motions, average transports, and average waiting time of the system by 97.74 per cent, 80.22 per cent, 46.67 per cent, 45.78 per cent, and 5.04 per cent respectively. They also increased the system productivity throughput and average machine use by 63.30 per cent and 5.19 per cent respectively.
REFERENCES
[1] Manville, G., Greatbanks, R., Krishnasamy, R. & Parker, D.W. 2012. Critical success factors for Lean Six-Sigma programmme: A view from middle management. International Journal of Quality and Reliability Management, 29(1), pp. 7-20. [ Links ]
[2] Krajewski, L.J., Malhotra, M.K. & Ritzman, L.P. 2016. Operations management: Processes and supply chains. 11th ed. Harlow: Pearson. [ Links ]
[3] Marsillac, E. & Roh, J.J. 2014. Connecting product design, process and supply chain decisions to strengthen global supply chain capabilities. International Journal of Production Economics, 147, pp. 317-329. [ Links ]
[4] Chauhan, P.S. & Agrawal, C.M. 2014. Identification of manufacturing defects leading to rejection during manufacturing of stabiliser bar. International Journal of Productivity and Quality Management, 14(4), pp. 408-422. [ Links ]
[5] SEIFSA. 2015. Outlook for steel and engineering sector 2016-2017. SEIFSA NEWS, November/December, pp. 1-43. [ Links ]
[6] Nowduri, S. 2012. Framework for sustainability entrepreneurship for small & medium enterprises (SMEs) in an emerging economy. World Journal of Management, 4(1), pp. 55-66. [ Links ]
[7] Oeij, P.R.A., De Looze, M.P., Have, K.T., Van Rhijn, J.W. & Kuijt-Evers, L.F.M. 2012. Developing the organisation's productivity strategy in various sectors of industry. International Journal of Productivity and Performance Management, 61(1), pp. 93-109. [ Links ]
[8] Coka, B. 2014. Annual report 2013-2014. Midrand: Productivity SA. [ Links ]
[9] Statistics SA. 2015. Manufacturing: Production flat in 2014. http://www.statssa.gov.za/?p=4064. [ Links ]
[10] Dhandapani, V., Potter, A. & Naim, M. 2004. Applying lean thinking: A case study of an Indian steel plant. International Journal of Logistics Research and Applications, 7(3), pp. 239-250. [ Links ]
[11] Gurumurthy, A. & Kodali, R. 2011. Design of lean manufacturing systems using value stream mapping with simulation: A case study. Journal of Manufacturing Technology Management, 22(4), pp. 444-473. [ Links ]
[12] Rasi, R.Z.R., Pahat, B., Abdullah, R., Omar, N., Jaya, H.T. & Mohamed, S. 2014. Value stream mapping using simulation at metal manufacturing industry. Proceedings of the International Conference on Industrial Engineering and Operations Management, Bali, Indonesia, January 7-9, pp. 2455-2464. [ Links ]
[13] Helleno, A.L., de Moraes, A.J.I. & Simon, A.T. 2017. Integrating sustainability indicators and lean manufacturing to assess manufacturing processes: Application case studies in Brazilian industry. Journal of Cleaner Production, 153, pp. 405-416. [ Links ]
[14] Chiabert, P., D'Antonio, G., Inoyatkhodjaev, J., Lombardi, F. & Ruffa, S. 2015. Improvement of powertrain mechatronic systems for lean automotive manufacturing. Procedia CIRP, 33, pp. 53-58. [ Links ]
[15] Lacerda, A.P., Xambre, A.R. & Alvelos, H.M. 2016. Applying value stream mapping to eliminate waste: A case study of an original equipment manufacturer for the automotive industry. International Journal of Production Research, 54(6), pp. 1708-1720. [ Links ]
[16] Gandhi, N.S., Thanki, S.J. & Thakkar, J.J. 2018. Ranking of drivers for integrated lean-green manufacturing for Indian manufacturing SMEs. Journal of Cleaner Production, 171, pp. 675-689. [ Links ]
[17] Garre, P., Bharadwaj, V.N., Shashank, P.S., Harish, M. & Dheeraj, M.S. 2017. Applying lean in aerospace manufacturing. Materials Today: Proceedings, 4(8), pp. 8439-8446. [ Links ]
[18] Salonitis, K. & Tsinopoulos, C. 2016. Drivers and barriers of lean implementation in the Greek manufacturing sector. Procedia CIRP, 57, pp. 189-194. [ Links ]
[19] Verma, N. & Sharma, V. 2017. Sustainable competitive advantage by implementing lean manufacturing: A case study for Indian SME. Materials Today: Proceedings, 4(8), pp. 9210-9217. [ Links ]
[20] Yuvamitra, K., Lee, J. & Dong, K. 2017. Value stream mapping of rope manufacturing: A case study. International Journal of Manufacturing Engineering, 1(1), pp. 1-11. [ Links ]
[21] Potter, A., Yang, B. & Lalwani, C. 2007. A simulation study of despatch bay performance in the steel processing industry. European Journal of Operational Research, 179(2), pp. 567-578. [ Links ]
[22] Salleh, N.A.M., Kasolang, S. & Jaffar, A. 2012. Simulation of integrated total quality management (TQM) with lean manufacturing (LM) practices in forming process using Delmia Quest. Procedia Engineering, 41, pp. 1702-1707. [ Links ]
[23] Bozickovic, R., Radosevic, M., Cosic, I., Sokovic, M. & Rikalovic, A. 2012. Integration of simulation and lean tools in effective production systems: Case study. Strojniski vestnik - Journal of Mechanical Engineering, 58(11), pp. 642-652. [ Links ]
[24] Afazov, S.M. 2013. Modelling and simulation of manufacturing process chains. CIRP Journal of Manufacturing Science and Technology, 6(1), pp. 70-77. [ Links ]
[25] Liraviasl, K.K., ElMaraghy, H., Hanafy, M. & Samy, S.N. 2015. A framework for modelling reconfigurable manufacturing systems using hybridized discrete-event and agent-based simulation. IFAC Conference, 48(3), pp. 1490-1495. [ Links ]
[26] Omogbai, O. & Salonitis, K. 2016. Manufacturing system lean improvement design using discrete event simulation. Procedia CIRP, 57, pp. 195-200. [ Links ]
[27] Bako, B. & Bozek, P. 2016. Trends in simulation and planning of manufacturing companies. Procedia Engineering, 149, pp. 571-575. [ Links ]
[28] Munyai, T., Mbohwa, C., Makinde, O.A. & Ramatsetse, B.I. 2017. A system model to improve the productivity of a South African steel industry. IEEE International Conference on Industrial Engineering and Engineering Management (IEEM), pp. 329-333. [ Links ]
[29] Singh, A., Philip, D., Ramkumar, J. & Das, M. 2018. A simulation-based approach to realize green factory from unit green manufacturing processes. Journal of Cleaner Production, 182, pp. 67-81. [ Links ]
[30] Rohani, J.M. & Zahraee, S.M. 2015. Production line analysis via value stream mapping: A lean manufacturing process of color industry. Procedia Manufacturing, 2, pp. 6-10. [ Links ]
[31] Wagnild, J. & Wall-Scheffler, C.M. 2013. Energetic consequences of human sociality: Walking speed choices among friendly dyads. PloS One, 8(10), e76576. [ Links ]
Submitted by authors 14 Nov 2018
Accepted for publication 17 Apr 2019
Available online 29 May 2019
* Corresponding author. MunyaiT@tut.ac.za

